




Abstract
Introduction
Y
However, due to the acid-resistant glass-free composition structure of the zirconia, the difficulty to adhere to this material is a major limitation. 4 Roughening the surface might allow resin cement to penetrate into microretentions and create stronger mechanical interlocking and increase the bond strength. 5
Surface treatment methods used for surface roughening include grinding, abrasion with diamond rotary instruments, airborne particle abrasion with Al2O3, silicate coating, hydrofluoric acid etching, silane coupling, and combinations of these methods. Recently, laser irradiation has become an alternative method for roughening the surface of ceramics to improve the adhesion of composite resin. Laser types used for surface treatment are Er:YAG laser, Nd:YAG laser, CO2 laser, and ytterbium-doped fiber laser (YbPL). 4,6,7
Conversion of light energy into heat energy is the principal of laser application. The absorption of laser energy by the substrate is the most important interaction between the laser light and the substrate. 8 Erbium and ytterbium lasers are widely used in biomedical applications. While the Yb3+-ion transitions offer potentially high pumping efficiency due to small quantum defect, ytterbium lasers operate near 1 μm and offer small nonradiative losses, low heating, almost 80% conversion efficiency, and ∼25% wall-plug efficiency. 9 One recent study showed that a YbPL was the best surface treatment for shear bond strength between YTZP and resin cement. 10
High peak power ytterbium-pulsed lasers operating in the Q-switched and mode locking regimes are seen in ultrashort laser applications and are alternatives to the Nd:YAG lasers that are widely used in medical applications. 11 –13 Pulsed ytterbium lasers with over 80 W of peak power and microsecond duration have a wide range of application areas, including gynecology, abdominal surgery, cardiovascular surgery, and dental curing. 10,14
The wettability of a material can be described as the interaction of material with fluids. 15 Contact angles can be measured on the macroscopic level to characterize the average wettability of a material. They have great potential utility. 16 Wetting of a material increases as the contact angle decreases to 0°; impregnation occurs when it is smaller than 90°. 17
X-ray diffraction is the most common technique to quantitatively determine the monoclinic fraction. 18 The relative amount of phase transformation is calculated with a modified Garvie–Nicholson formula via X-rays with a penetration of 5 μm. 19
The different phase and/or amplitude of light reflected from an object surface are measured by a scanning optical profilometer. This information may then be interpreted as a topographical and reflectivity variation in the object surface. 20,21 The aim of this study was to evaluate the effect of different parameters of the YbPL on surface roughness and wettability of zirconia. The null hypothesis of this study was the frequency, and power setting changes do not have effects on the surface roughness and wettability of zirconia.
Materials and Methods
Zirconia specimens (n = 147) were prepared to evaluate the effects of YbPL with different parameters.
Specimen preparation
The presintered zirconia samples, 6.31 mm in diameter × 4.21 mm in height (ZirkonZahn, Steger, Italy), were fabricated using CAD-CAM (Yenemak, Kayseri, Turkey). Zirconia specimens were sintered at 1500°C for 16 h in a furnace and 6 mm in diameter by 4 mm in height after construction.
The specimens were ground with 240-, 400-, and 600-grit silicon carbide abrasive papers (3 M ESPE, St. Paul, MN) for 15 sec with a grinding machine (Minitech 233; Presi, Grenoble, France) under running water. The ground specimens were then cleaned in ethanol and deionized water bath for 3 min and dried with oil-free air.
Surface treatments
All zirconia disk specimens were randomly divided into four groups according to the power of the laser application (5, 12, 17, and 20 W group) and these groups were divided into five subgroups according to the different frequencies (25, 40, 60, 80, and 100 kHz) (n = 7). The control group had no surface treatment.
Laser irradiation
The zirconia disk surfaces were irradiated with 5, 12, 17, 20 W output power of Yb-doped fiber-based nanosecond pulsed laser (Vision, Neukirchen, Germany). The irraditation was carried out with YbPL at 1064 nm and a frequency of 25, 40, 60, 80, and 100 kHz, 1 mJ pulse energy, and pulse duration of 100 ns (ultrashort pulse). The laser beam was directed over the zirconia disk surface in a noncontact mode at a working distance of 17.8 mm with laser focusing on the zirconia disc surfaces via vertical and horizontal scanning. The spot size of the laser device is less than 50 μm. There is an air-cooling system in the laser device (Table 1).
Evaluation of surface roughness
The surface roughness of the specimens was measured with a noncontact profilometer (NANOVEA 3D, CA). The cutoff value was set at 0.8 mm. Each zirconia sample was tested three times, and the mean values of these measurements were adopted as indicated by the corresponding specimen. The Ra values were measured, and the mean value of each group was calculated. Higher Ra values might indicate a rougher surface.
Evaluation of surface wettability
Zirconia specimens were measured with a goniometer to examine the effects of laser irradiation on wetting and surface energy (Attension Theta, Stockholm, Sweden). The contact angles, Ɵ, of the distilled water on the untreated and YbPL-treated zirconia specimens were detected in atmospheric condition at 25°C using a sessile drop measure machine (First Ten Ångstroms, Inc., VA). The specimens were cleaned with acetone before the measurement, rinsed with distilled water, and dried to eliminate contaminant layers. Contact angles were measured based on a previous study, and the mean value of each group was calculated. A lower contact angle value might indicate the best wettability for a zirconia surface. 15
Examination with a scanning electron microscope
A scanning electron microscope (SEM) (S-3400N; Hitachi High-Technologies Corporation, Tokyo, Japan) was used to observe the surface treatment effects. The analysis procedures were carried out after gold sputtering with × 250, × 1000, × 2500, × 5000, and × 10,000 magnification (Figs. 1 –4).

SEM images of 5 W group:

SEM images of 12 W group:

SEM images of 17 W group:

SEM images of 20 W group:
Analysis of crystallographic structure
To evaluate the effects of different power and frequency combinations of YbPL on the phase transformation of zirconia, one specimen from each group was randomly selected. The changes in the surface crystalline structure were analyzed with X-ray diffractometry (XRD-6100; Shimadzu, Japan). The XRD data were collected with a θ/2θ diffractometer (RINT-2500; Rigaku, Tokyo, Japan) using Cu-Kα = 1.54 Å radiation at 40 kV and 120 mA. Diffractograms were obtained from 25° to 37° at a scan speed of 1°/min. The monoclinic phase fraction was calculated by the Garvie–Nicholson method. 22
Statistical analysis
PASW statistics 18 software (SPSS for Windows: SPSS, Inc., Chicago, IL) was used for statistical analysis. The wettability surface roughness was checked for homogeneity of variance and normality with the Shapiro–Wilk test. Groups were compared using a one-way ANOVA with Duncan's analysis at the 95% significance level. Pearson's correlation analysis was applied to test for a possible correlation between surface roughness and wettability.
Results
Statistical analysis indicated that the surface roughness and wettability varied according to power (5, 12, 17, and 20 W) and frequency (25, 40, 60, 80, and 100 kHz) of laser application (p < 0.05). The value of the surface roughness was highest at 20 W and 100 kHz. Further, the Ra values of all groups were higher than the control group. The differences in surface roughness values between groups (5 W, 40 kHz; 5 W, 60 kHz; 12 W, 25 kHz; and 20 W, 25 kHz) were not significant (p > 0.05).
The value of the contact angle was highest at 20 W and 100 kHz. The contact angle values were different from control and the (5 W, 40 kHz) group. The difference of contact angle values between (17 W, 25 kHz; 17 W, 60 kHz; 12 W, 25 kHz; 20 W, 25 kHz; 12 W, 40 kHz; 17 W, 40 kHz; 20 W, 60 kHz; and 20 W, 80 kHz) groups were not significant (p > 0.05) (Table 2).
Mean values followed by different lowercase letters in columns differed statistically by Duncan test at 5% level of significance, p < 0.05.
SD, standard deviation.
The best wettability characteristics are shown in the (5 W, 60 kHz) group. The 20 W group had the highest value for surface roughness, and the wettability of this group was low. The correlations of the Ra and wettability were low but significant. The Pearson's correlation coefficient between Ra and wettability was r = 0.511 (p < 0.05).
The 5 W group and control group showed no visible morphological and color changes. The remaining groups had visible morphological effects and visible color changes.
The group roughened with 5 W showed no microcracks, however, melted areas were observed in SEM examination. (Fig. 1A, B) Obvious grooves and zirconia grains across different levels were seen in this group. Versus the control group, the zirconia grains were not different. In all other groups, microcracks and melted layers were observed (Figs. 2A, B; 3A, B; and 4A, B). On the contrary, these groups were most likely to generate partial melting, which erased some grooves. Further, molten particles were observed in the uppermost layer. All groups exhibited micromechanical irregularities on the zirconia surfaces.
Only the tetragonal (T)-phase structure could be detected on the zirconia surface. There was no T/M-phase transformation. The relative amounts of monoclinic (M) zirconia were varied between 5.08% and 7.4%. The (5 W, 100 kHz) group had the lowest monoclinic content (5.08%). A significantly lower T/M-phase transformation was observed for specimens at 5 W as well as the (12 W, 25 kHz) group and the (17 W, 25 kHz) group. The monoclinic phase was not detected in other groups (Figs. 5 and 6).
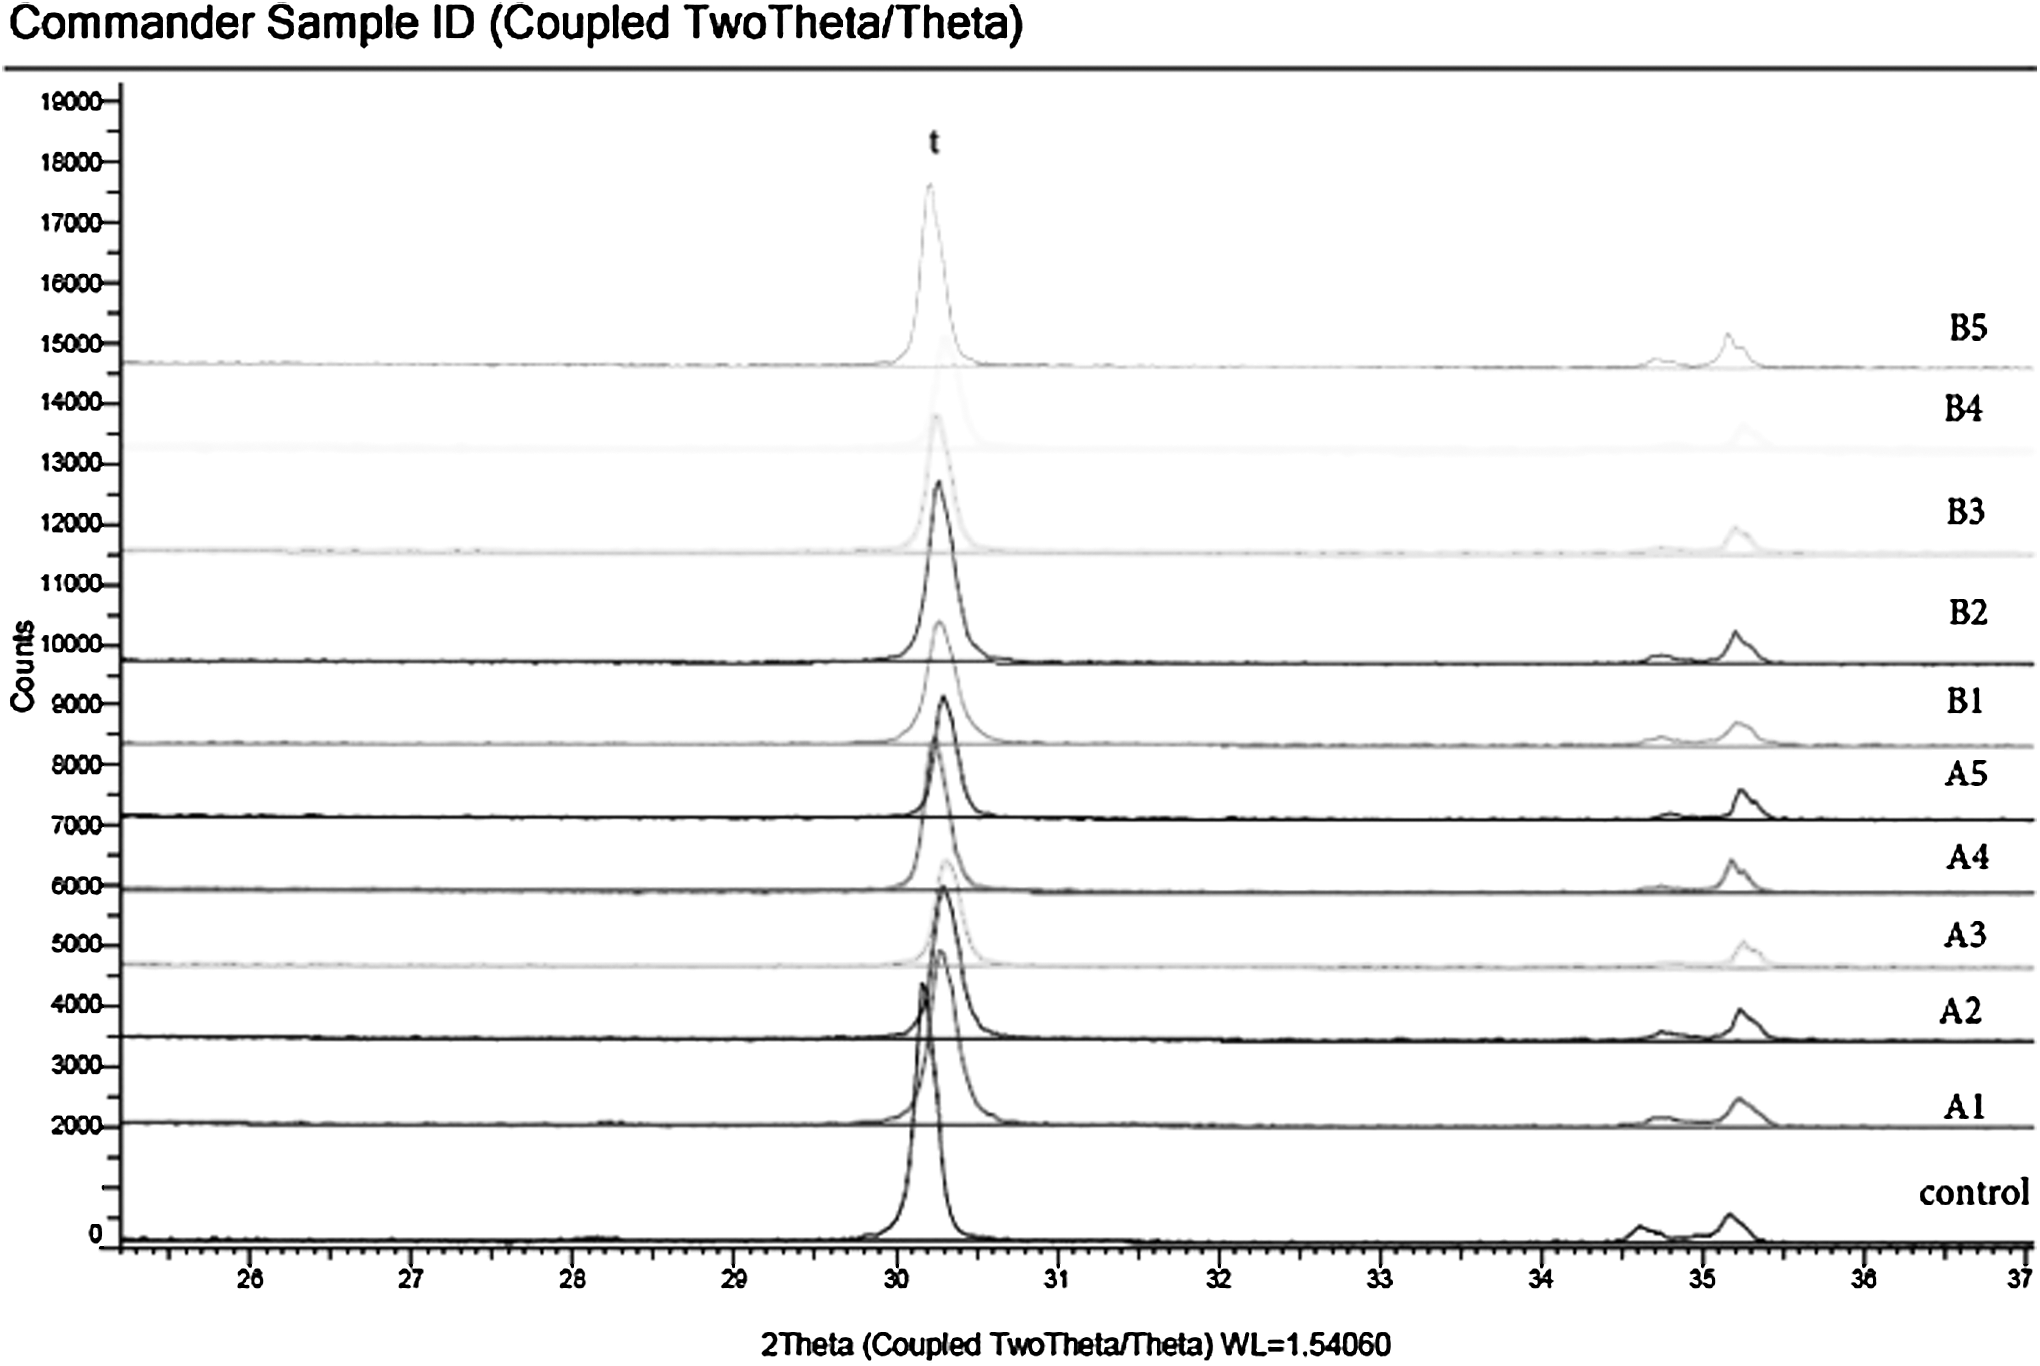
XRD patterns of zirconia surfaces after laser irradiation (5 and 12 W groups). XRD, X-ray diffractometry.

XRD patterns of zirconia surfaces after laser irradiation (17 and 20 W groups).
Discussion
The changes of power and frequency affected the surface roughness and wettability of zirconia. Thus, the null hypothesis of the study was rejected.
Laser applications are increasingly popular and are infiltrating into dental treatments and dental laboratories. Previous studies have indicated that laser applications such as CO2, Er:YAG, and YbPL increased the bond strength between zirconia and cement. 7,10,22,23 Further, Unal et al. reported that YbPL irradiation provides rougher zirconia surfaces and higher bond strengths than sandblasting and Cojet. 10 However, there are contradictory results regarding Nd:YAG laser application. While Usumez et al. reported that the Nd:YAG laser irradiation significantly increased surface roughness of YTZP surfaces, Akyil et al. reported that Nd:YAG laser irradiation could decrease the bond strength between zirconia and cement. 22,23 In the current study, the YbPL affected the zirconia surface and increased surface roughness.
Microcrack formation is a potential problem that can occur during the surface treatment. Laser irradiation with CO2 and Nd:YAG lasers might cause microcrack formation as well. Further, during laser irradiation, the surface temperature of the ceramic increases as a result of superficial emission of the ions, electrons, and atoms. 7 A physical plasma arises due to the characteristics of photoionization. 19 This formation is accompanied by high pressure and temperatures ranging from 9700 to 49,700°C. These extreme conditions may cause physical stress in the rehardening ceramic surface and lead to microcracks. 24 Further, these microcracks might reduce the resistance of zirconia. 22 In the current study, all groups exhibited micromechanical irregularities on the surfaces, however, the group irradiated with 5 W power did not exhibit any cracks or melting areas. Obvious grooves and zirconia grains were seen at SEM magnifications. The increase of power caused microcrack formation, and thus, excessive power application should be avoided.The zirconia grains did not show difference from the control group within the 5 W group, within the other groups (12, 17, and 20 W) there were microcracks and also melted layers. Melting was visible in the uppermost layer.
Bond strength is not only dependent on surface roughness. 24 Although the increase in surface roughness influences the wettability, it plays only a minor role. 15 Enhancement of the surface oxygen content and surface energy may influence the wettability characteristics as well. 15 In our study, the highest surface roughness value was observed in the (20 W, 100 kHz) group, but the highest wettability was in the (5 W, 60 kHz) group. This predicts that treatment of zirconia with these parameters might increase bond strength. When the surface roughness value (Ra) was 0.5–0.9, wettability was highest. Thus, increases in Ra values do not linearly increase wettability.
The volume fraction measurement depends on determining the area of the XRD peak areas accurately. Approximately 5% of the volume is transformed, and the area of the monoclinic phase peak is too small relative to the background to be measured reliably. 18 Usumez et al. reported that the Nd:YAG laser irradiation exhibited significantly higher monoclinic zirconia contents. 22 In the current study, there is no phase transformation in the sample during XRD. In addition, bending resistance is not affected when the monoclinic phase was 12–50% on the zirconia surface. 25 Only the tetragonal (T)-phase structure could be detected on the zirconia surface. Thus, the zirconia resistance has not been diminished.
Surface roughness is a crucial factor for surface wettability. Several methods, including contact stylus tracing, laser reflectivity, noncontact laser stylus metrology, SEM, and compressed air measurements, can study surface roughness. In contact mode, the sample surface is scanned beneath the AFM tip. However, on scanning the excessive rough surfaces, there is a risk of breaking the AFM tip (AFM tip is precise at +4 μm height and −4 μm deep). Thus, the sample surface was scanned with noncontact mode via the optical profilometer. The profilometer and the atomic force microscope have similar patterns. 21
This study shows surface roughness and wettability after YbPL irradiation with different powers and frequencies. The bond strength was not investigated, and it should be analyzed in a subsequent study.
Conclusions
The limitations and conclusions of the study include the following: 1. YbPL irradiation roughened the zirconia surface, and the changes of power and frequency settings affected surface roughness and wettability differently. 2. Although laser treatment affected zirconia surfaces and provided surface roughness, the power and the frequency should be adjusted to achieve optimum results.The most favorable wettability was shown at 5 W and 25, 40, 60, 80, and 100 kHz. 3. The samples with Ra value between 0.5 and 0.9 showed the best wettability. 4. An excessive increase in surface roughness does not offer increased wettability.
Footnotes
Author Disclosure Statement
No competing financial interests exist.