
Abstract
Introduction
G
Extracorporeal shock wave lithotripsy (ESWL) is used for stones that are difficult to extract using traditional methods. Despite advancements in ESWL, several sessions with this particular procedure are needed for effective fragmentation before initiating ERCP several days later to collect stone fragments from the ducts. Complete ductal clearance is not always achievable, especially for large or intrahepatic stones. 8 –12
Laser lithotripsy has been successful in many unusual clinical situations due to its precise targeting. 13 However, laser lithotripsy has two major limitations: (1) risk of accidental damage to the bile duct wall, which necessitates use of direct endoscopic vision or “cholangioscopic guidance” that requires two dedicated and experienced endoscopists and expensive fragile equipment 14 ; and (2) the efficiency depends heavily on the chemical composition of the stone. Several studies on ablation mechanisms showed that the damage threshold for pigment stones is much lower than for cholesterol-based stones at any wavelength or pulse duration. 15 –17 We have extensively studied the mechanism of stone destruction and discrimination using imaging, correlation, and laser spectroscopy, 18 –22 but additional studies are required for reliable diagnosis to easily and accurately distinguish cholesterol stones from pigment stones and to specify the laser power, pulse width, repetition rate, and number of pulses needed to achieve effective results. 23
Laser-induced fluorescence spectroscopy (LIFS) has the potential for in vivo diagnosis of diseased tissues and characterization of biological tissue and stones. 24 –28 Changes in tissue fluorophores can be correlated with changes in overall fluorescence emission, which is an ensemble of each fluorescent constituent. Several studies have used this technique to gain further information and insight into how to overcome the abovementioned limitations of laser lithotripsy. Jakobs et al. 9 used an optical stone-tissue detection system based on spectral-domain LIFS as a “feedback system” in a clinical setting to reduce the likelihood of accidental bile duct damage. This method aids the use of laser lithotripsy under sole fluoroscopic guidance, thereby reducing the cost of this medical procedure. Wrobel et al. 23 applied LIFS to distinguish cholesterol stones from pigment stones. The LIFS technique has the potential to increase the efficacy of laser lithotripsy by aiding in optimizing laser parameters such as pulse power and pulse width according to the chemical compositions of different stones (cholesterol or pigment stones).
Recently, time-resolved fluorescence spectroscopy techniques 28 –31 have been used to monitor physiological and chemical changes. Time-resolved measurement resolves fluorescence intensity decay over time, which provides additional information not typically captured through conventional spectral-resolved measurement.
In the present study, we examined the capability of time-resolved LIFS (TR-LIFS) to classify gallbladder stones and to distinguish gallbladder stones from tissues.
Materials and Methods
Samples
This study was conducted on 54 gallbladder stones and seven gallbladder tissue samples obtained from 54 patients who had cholecystectomies performed at the Mubarak Al-Kabeer Hospital, Kuwait. The gallbladder stones and tissues were stored in a saline solution at 4°C before analysis. Gallbladder tissues were spectroscopically analyzed within 24 h of extraction to minimize degradation of tissue components. Spectra for pure samples, including cholesterol (Fluka Chemika, 26740, St. Louis, MO), calcium bilirubinate, and bilirubin (Fluka Chemika, 14370, St. Louis, MO), were also collected for correlation with the major constituents of gallbladder stones. 32 Calcium bilirubinate was prepared using a previously described method. 33
Fluorescence measurement
The stones and tissues were spectroscopically analyzed with TR-LIFS (Fig. 1). The excitation light was a 400 nm femtosecond laser obtained from a second harmonic generation (SHG) device (frequency doubler, Spectra-Physics) with an 800 nm Ti:Sapphire laser (Tsunami, 800 nm, 100 fs, repetition rate 80 MHz; Spectra-Physics) beam. A cutoff wavelength 750 nm short-pass filter (FF01-750; Semrock) was placed after the SHG device to eliminate the light source (800 nm). The light source output was delivered to the sample using a bifurcated fiber bundle (BF19Y2HS02; Thorlabs) that consisted of nine excitation fibers (200 μm, numerical aperture 0.22) mixed with a collection of 10 fibers (200 μm, numerical aperture 0.22). The fiber optics bundle configuration offers more uniform illumination over the tissue and more efficient light collection. The fluorescence emission was focused into a spectrograph (50 line/grating; Acton) by two collimating lenses (f = 15 cm) and was detected by a streak camera (model C10910-01, repetition rate 80 MHz; Hamamatsu) placed at the spectrograph exit slit. A cutoff wavelength 420 nm long-pass filter (LP 420; Thorlabs) was placed at the entrance slit of the spectrograph to eliminate the excitation laser reflected by the sample.
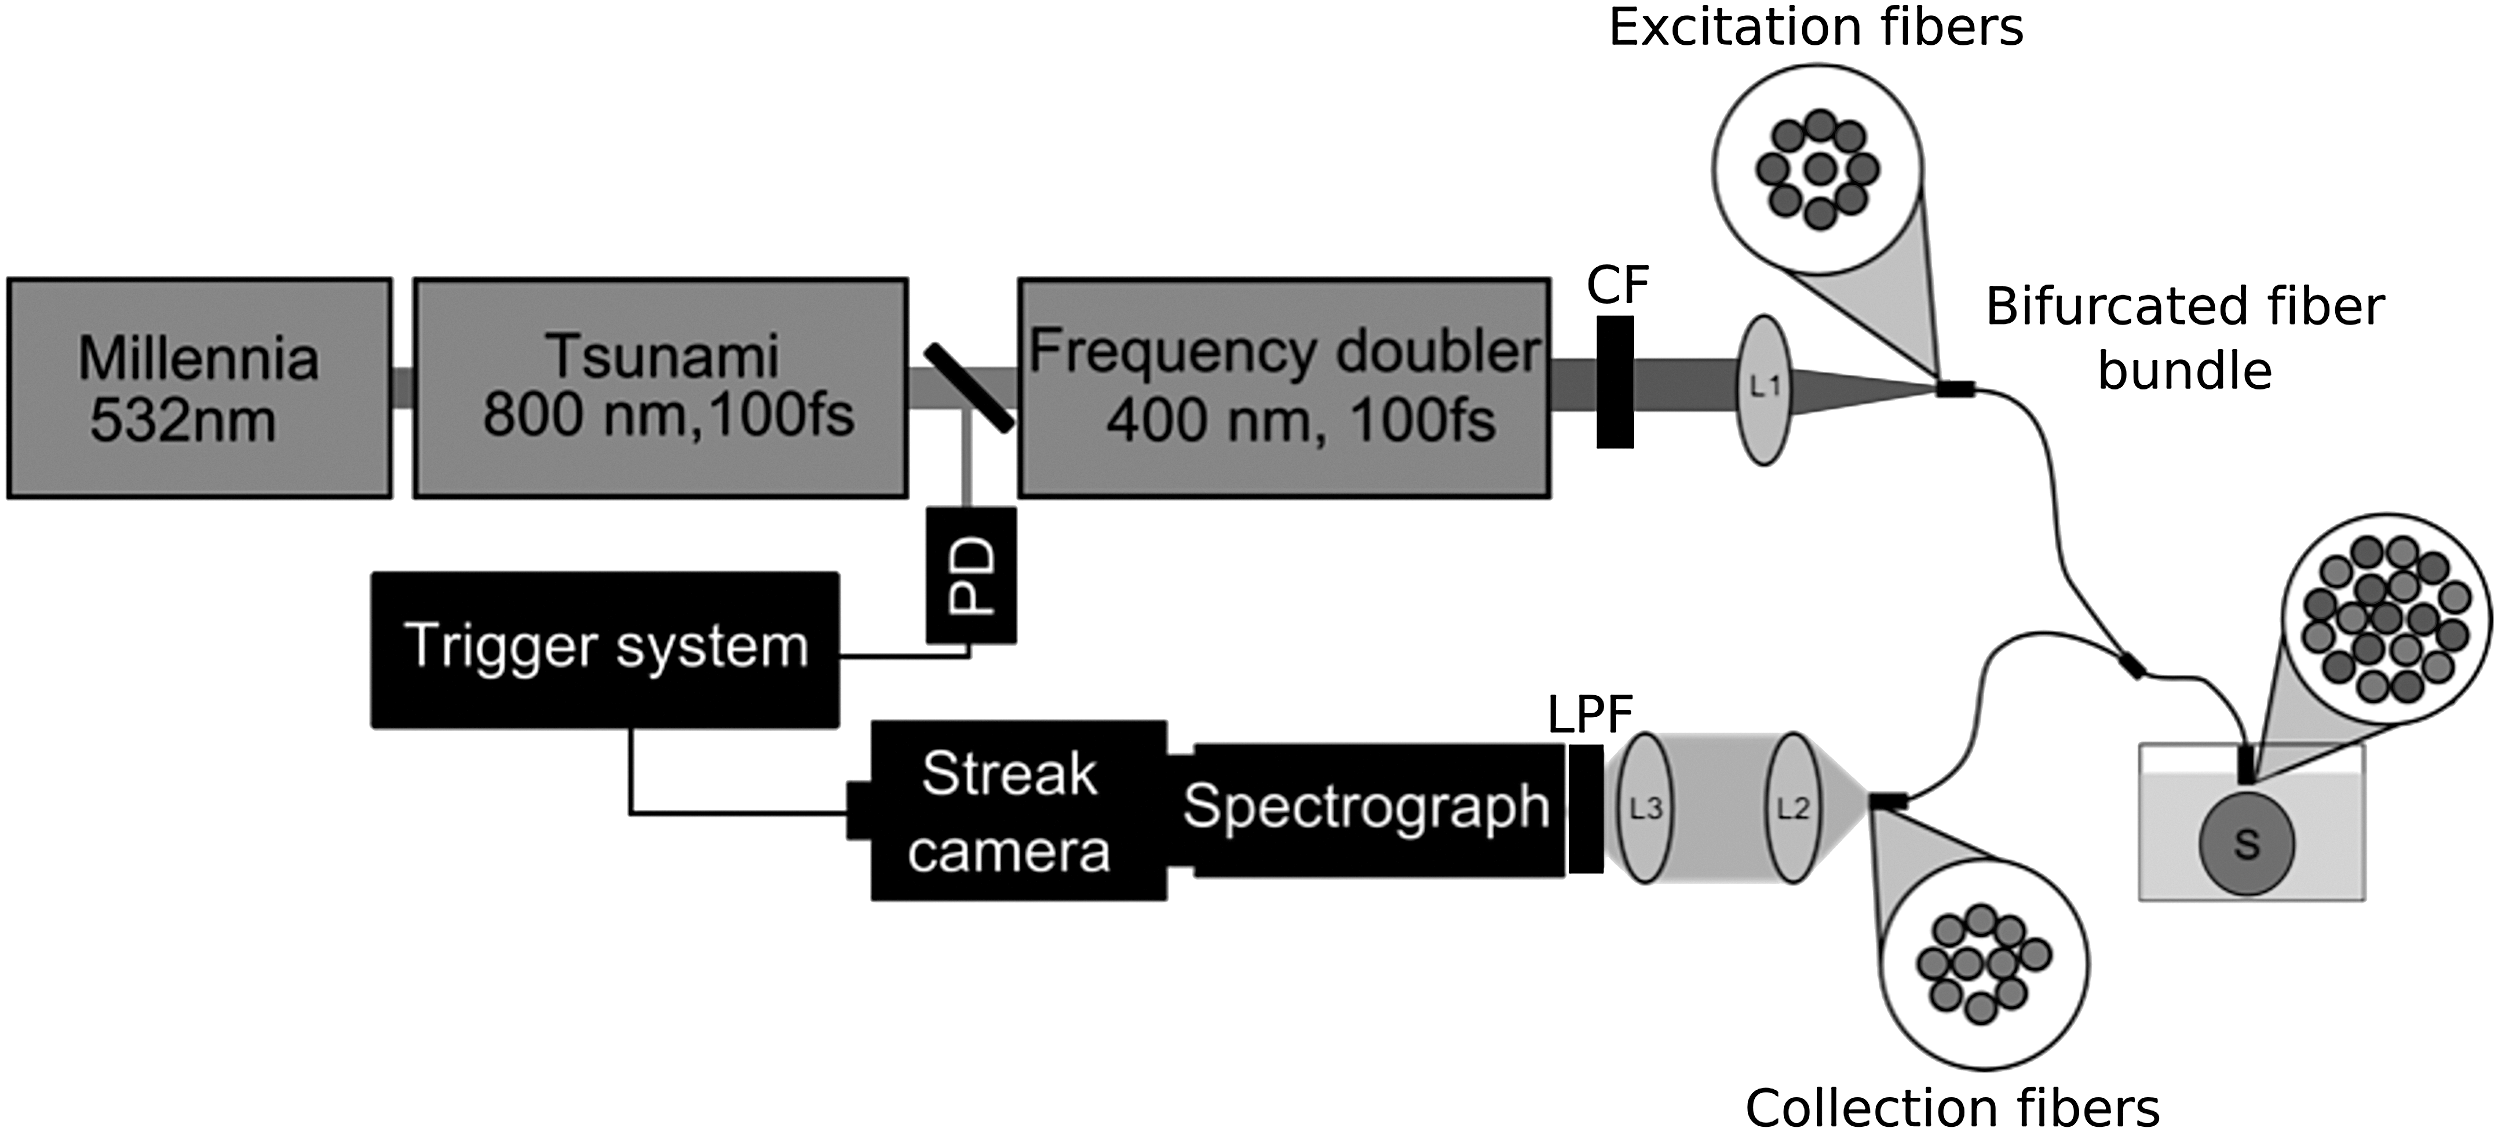
Schematic illustration of the instrument setup for time-resolved laser-induced fluorescence spectroscopy. CF is the cutoff filter; LPF is the long-pass filter; L1, L2, and L3 are lenses; and S is the sample (gallbladder stone or tissue). A streak camera serves as an ultrafast photon detector that delivers intensity versus time versus wavelength. PD is a photo detector that is used to synchronize streak camera triggering.
Experimental procedure
The samples were immersed in saline water to mimic the clinical environment, and the fiber optic probe was placed 3 mm above the sample to optimize probe light collection efficiency. The recorded range of the time-resolved emission of each sample was 450–700 nm with a resolution of 0.415 nm and a temporal resolution of 4.13 ps. The excitation laser energy output for the sample was adjusted to 5 mJ. The sample fluorescence measurement acquisition time was 10 s.
Data Analysis
Spectral analysis
For discrimination analysis, the spectral intensities used as the input were chosen based on the observed emission peaks at wavelengths 520 and 560 nm. Due to emission peak spread, the intensity values around the peak (±10 nm) were summed because they represent specific chemical components. The ratio between the normalized intensity of the wavelength regions (I 520, I 560) and the emission intensity (I 650) at the 650 nm wavelength was used for classification instead of using spectral correction. 34
Temporal analysis: Nonlinear fitting for lifetime fluorescence decay curve
The time-resolved fluorescence spectrum was constructed by numerical deconvolution of the measured laser pulse from the measured fluorescence. The time-resolved fluorescence profile for a given wavelength region was summed and fitted with a weighted two-exponential model,
35
as shown in Eq. (1):
where I(t) represents normalized lifetime intensity, τ1 and τ2 are the lifetimes of the individual exponential components, and a
1 and a
2 are the individual exponential component weights. A constant term b was added to account for the constant baseline noise. Matlab software (Mathworks, Natick, MA) was used for data fitting by implementing a nonlinear least squares curve-fitting method. The accuracy of the fit was judged by χ
2 values and visual observation of the fit line and residuals. Intensity-weighted mean lifetime (τm)
36
was calculated using Eq. (2):
with the parameters corresponding to those described for Equation (1). The temporal parameters used for sample classification were also selected from two wavelength regions: 520 and 560 nm. Thus, three time-dependent parameters—τ1, τ2, and τm—were calculated for each of the two emission regions, resulting in six temporal parameters for each sample.
Statistical analysis and classification
The results are expressed as mean ± standard deviation. Statistical analysis was performed and based on one-way analysis of variance with Tukey's post hoc test applied to the spectroscopic parameters for all samples (cholesterol stones, pigment stones, and tissues). A p value <0.05 was considered statistically significant.
To quantify the differences between the samples, a linear discriminant analysis was used to generate a classification model (discrimination functions). The discrimination function analysis was appropriate for small samples. The discrimination function and classification accuracy were determined for three cases: (1) parameters selected from only spectral features, (2) parameters selected from only temporal features, and (3) parameters selected from both spectral and time-resolved features. To create the test/training set, a “leave one out” method was used. This approach avoids splitting the available sample set into training and test sets yet maintains independence between them. The classification accuracy was determined by computing the specificity and sensitivity. Linear discrimination analysis was performed with the software package SPSS® version 20.
Results and Discussion
Classification of gallbladder stones
Gallbladder stones are usually classified into two groups, cholesterol and pigment stones, based on their major composition. 32,37 Cholesterol stones have cholesterol as the main constituent, whereas those predominantly composed of calcium bilirubinate and bilirubin are categorized as pigment stones. Fragments from all stones were analyzed using Fourier transform infrared absorption spectroscopy to confirm the classification that was established through visual inspection. 16,38,39 Of the 54 gallbladder stones used in this analysis, 31 and 23 were classified as cholesterol and pigment stones, respectively.
Spectral and time-resolved fluorescence emission spectra
Cholesterol stone (Chol.)
The fluorescence spectrum of cholesterol stones showed an emission characterized by a peak centered around 520 nm (Fig. 2a). The intensity emission in the 520 nm region (I 520/I 650 = 4.68 ± 0.17) was significantly larger than the emission intensity in the 560 nm region (I 560/I 650 = 3.19 ± 0.50). The fluorescence lifetime (Fig. 2c) in the first region was τ520 = 0.63 ± 0.21 ns, and it was τ560 = 0.55 ± 0.20 ns in the second region.
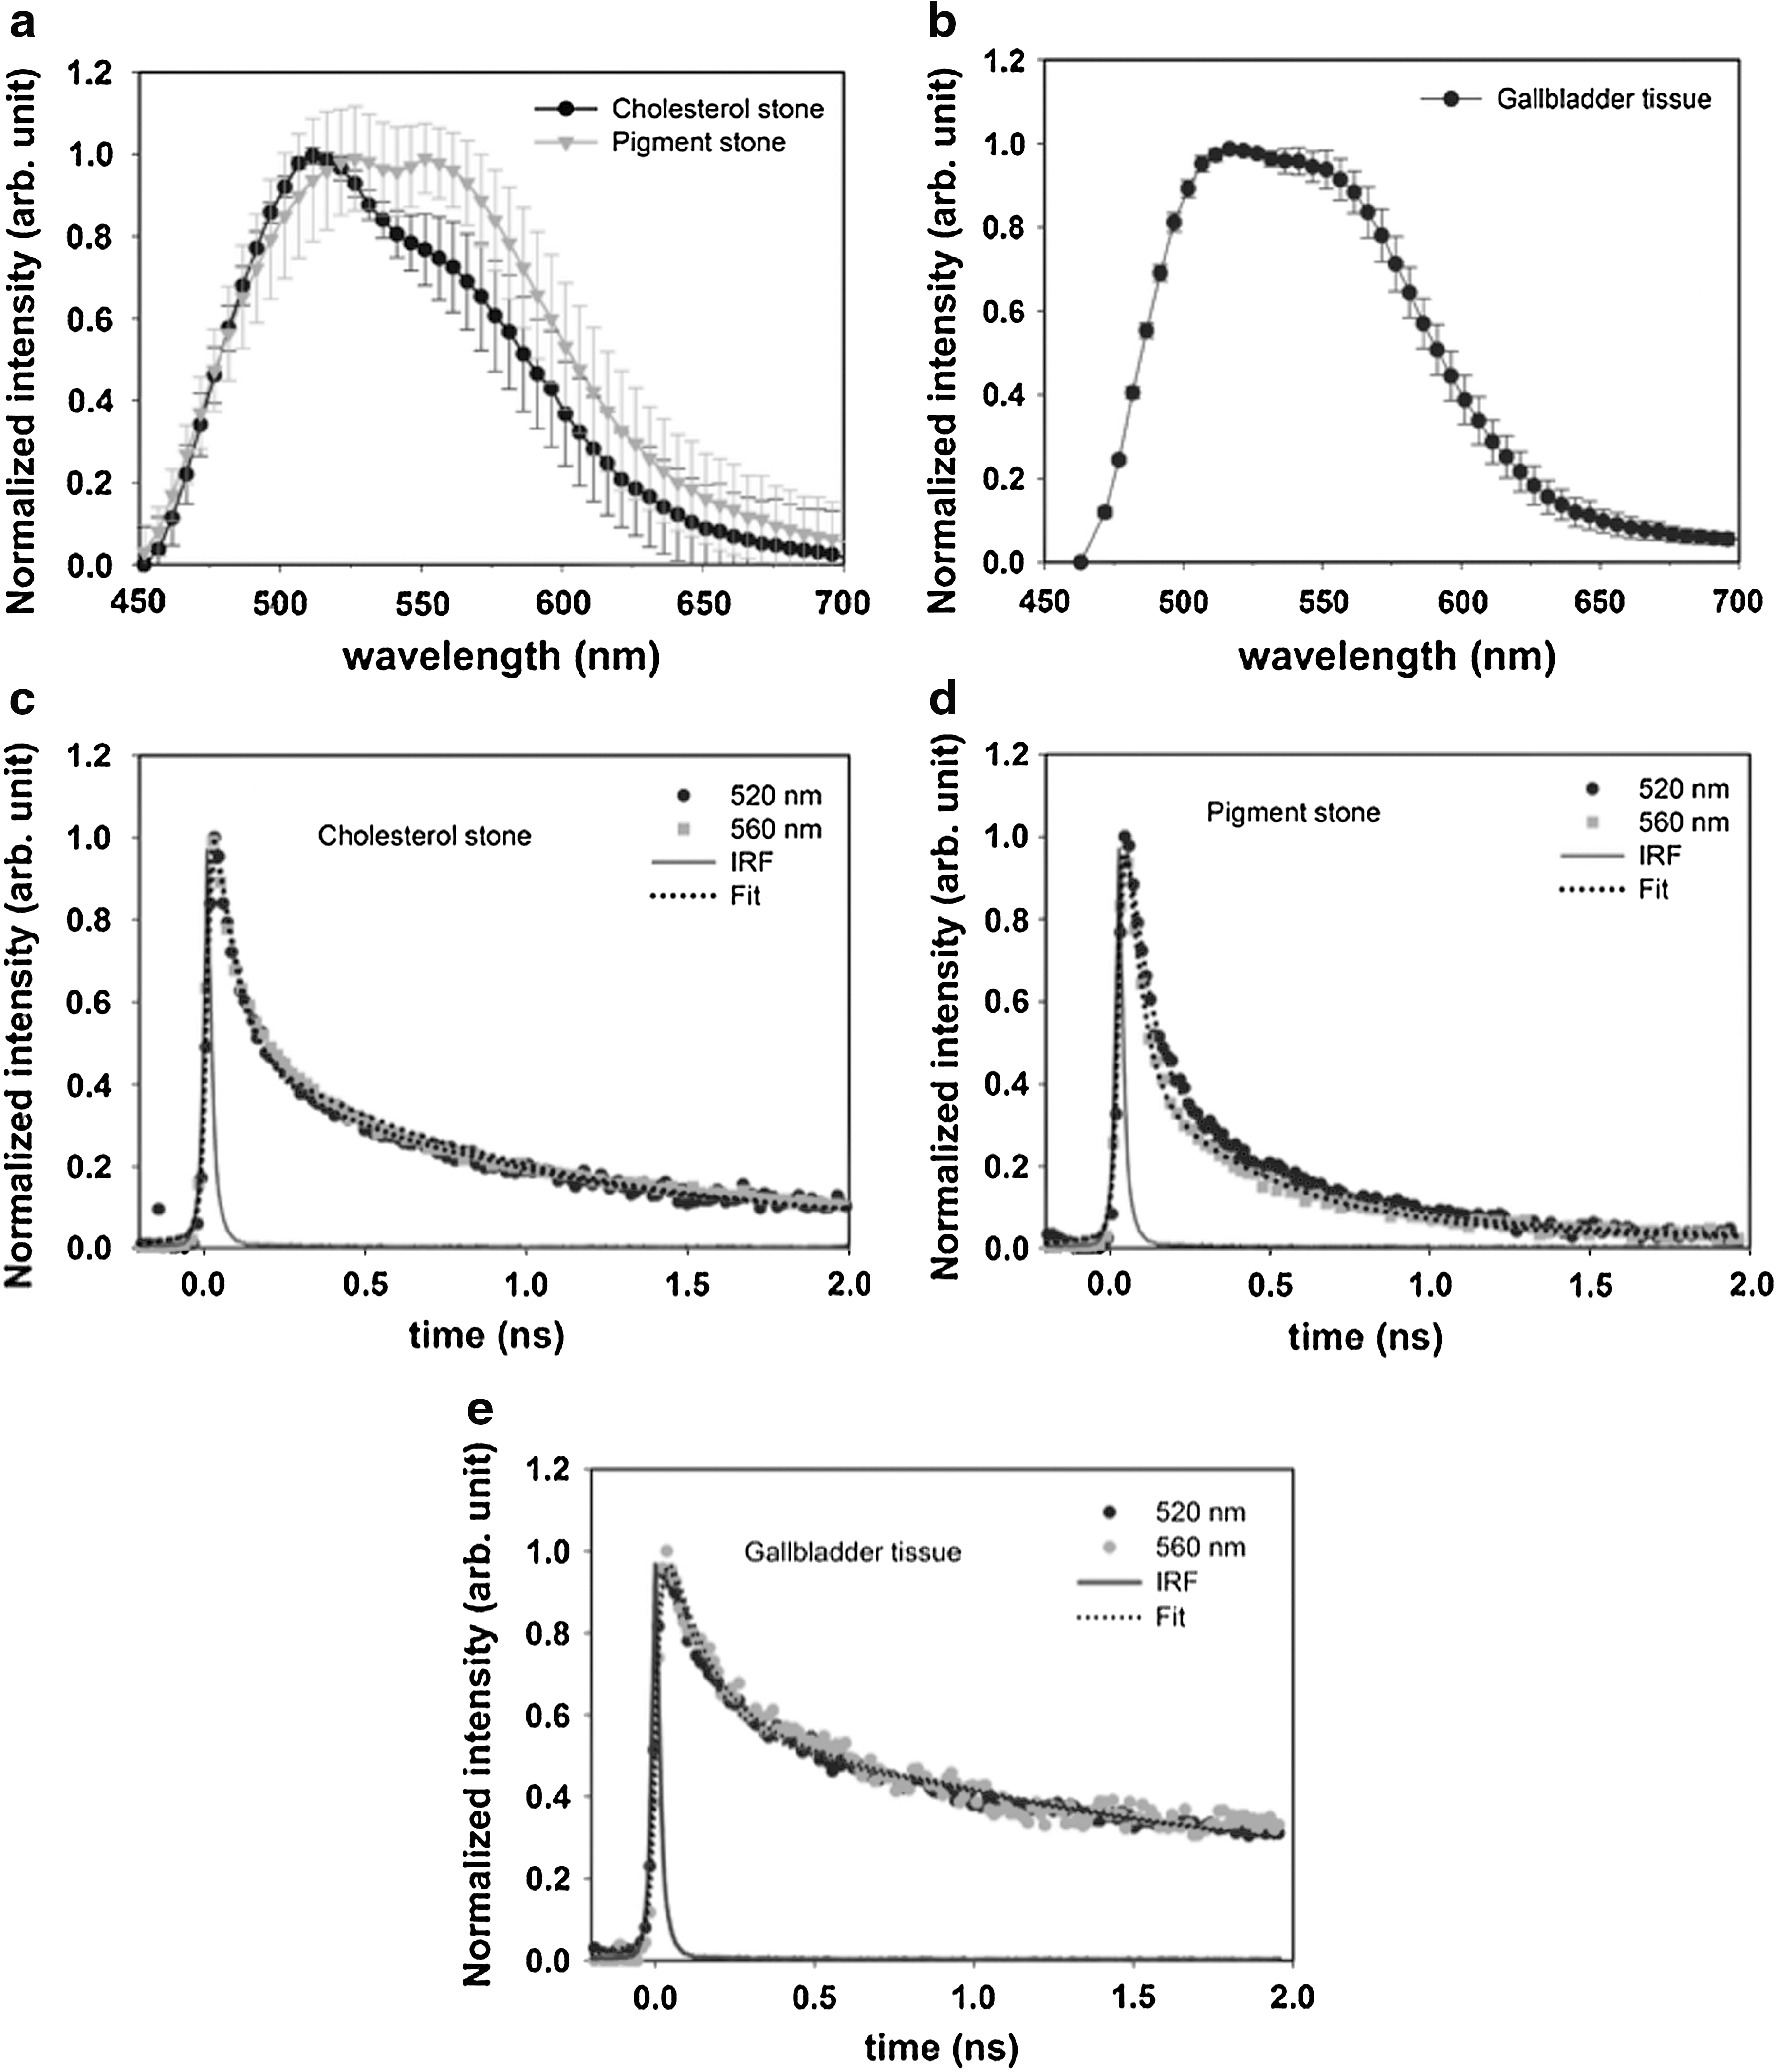
Fluorescence spectra and lifetime of gallbladder stones and gallbladder tissues. Fluorescence spectrum with 400 nm excitation of
Pigment stone [major component is calcium bilirubinate and cholesterol is the minor component (Cal. Bil ± Chol.)]
The typical emission spectrum for pigment stones was characterized by two emission peaks centered at about 520 and 560 nm (Fig. 2a). The intensity emission in the 520 nm region (I 520/I 650 = 4.28 ± 0.69) did not differ significantly from the emission intensity in the 560 nm region (I 560/I 650 = 4.13 ± 0.40). The fluorescence lifetime (τm) of the 520 and 560 nm peaks was 0.44 ± 0.28 and 0.43 ± 0.28 ns, respectively (Fig. 2d).
Tissue
The fluorescence spectrum of the gallbladder tissue samples was characterized by two peak emissions centered close to 520 and 560 nm (Fig. 2b). The fluorescence spectral characteristic showed that the emission intensity ratio for the 520 nm region (I 520/I 650 = 4.80 ± 0.14) was significantly larger than that for the 560 nm region (I 560/I 650 = 2.14 ± 0.27). The fluorescence lifetime was significantly longer in the 520 nm emission region (τm(520) = 1.81 ± 0.10 ns) than the 560 nm emission region (τm(560) = 0.96 ± 0.06 ns) (Fig. 2e).
Autofluorescent chromophores exhibit characteristic absorption and fluorescence spectra, and each chromophore can therefore be distinguished from others when excitation and detection wavelengths are appropriately selected. The cholesterol fluorescence emission of gallbladder stones at 400 nm laser excitation had one major peak at about 520 nm with a fluorescence lifetime of τ m = 1.52 ns (Fig. 3a). Meanwhile, the calcium bilirubinate peak was at 565 nm and had a lifetime of τ m = 0.197 ns, whereas the bilirubin showed a peak at 630 nm and had a very short lifetime of τ m = 0.12 ns. Figure 3b shows the fluorescence spectra of three sample stones: a cholesterol stone, a pigment stone consisting of calcium bilirubinate and cholesterol, and a pigment stone consisting mainly of calcium bilirubinate. Notably, only one stone consisting mainly of calcium bilirubinate was seen in the collected samples. The cholesterol and typical pigment stones are those that were discussed above and are also shown in Fig. 2a. The pigment stone consisting mainly of calcium bilirubinate was characterized by a fluorescence emission spectrum that had only one peak at 560 nm (Fig. 3b). The fluorescence lifetime of a pigment stone that was mainly calcium bilirubinate but also contained cholesterol had peaks in the 520 and 560 nm regions, and the fluorescence lifetime was τm(520) = 0.21 ns and τm(560) = 0.16 ns.
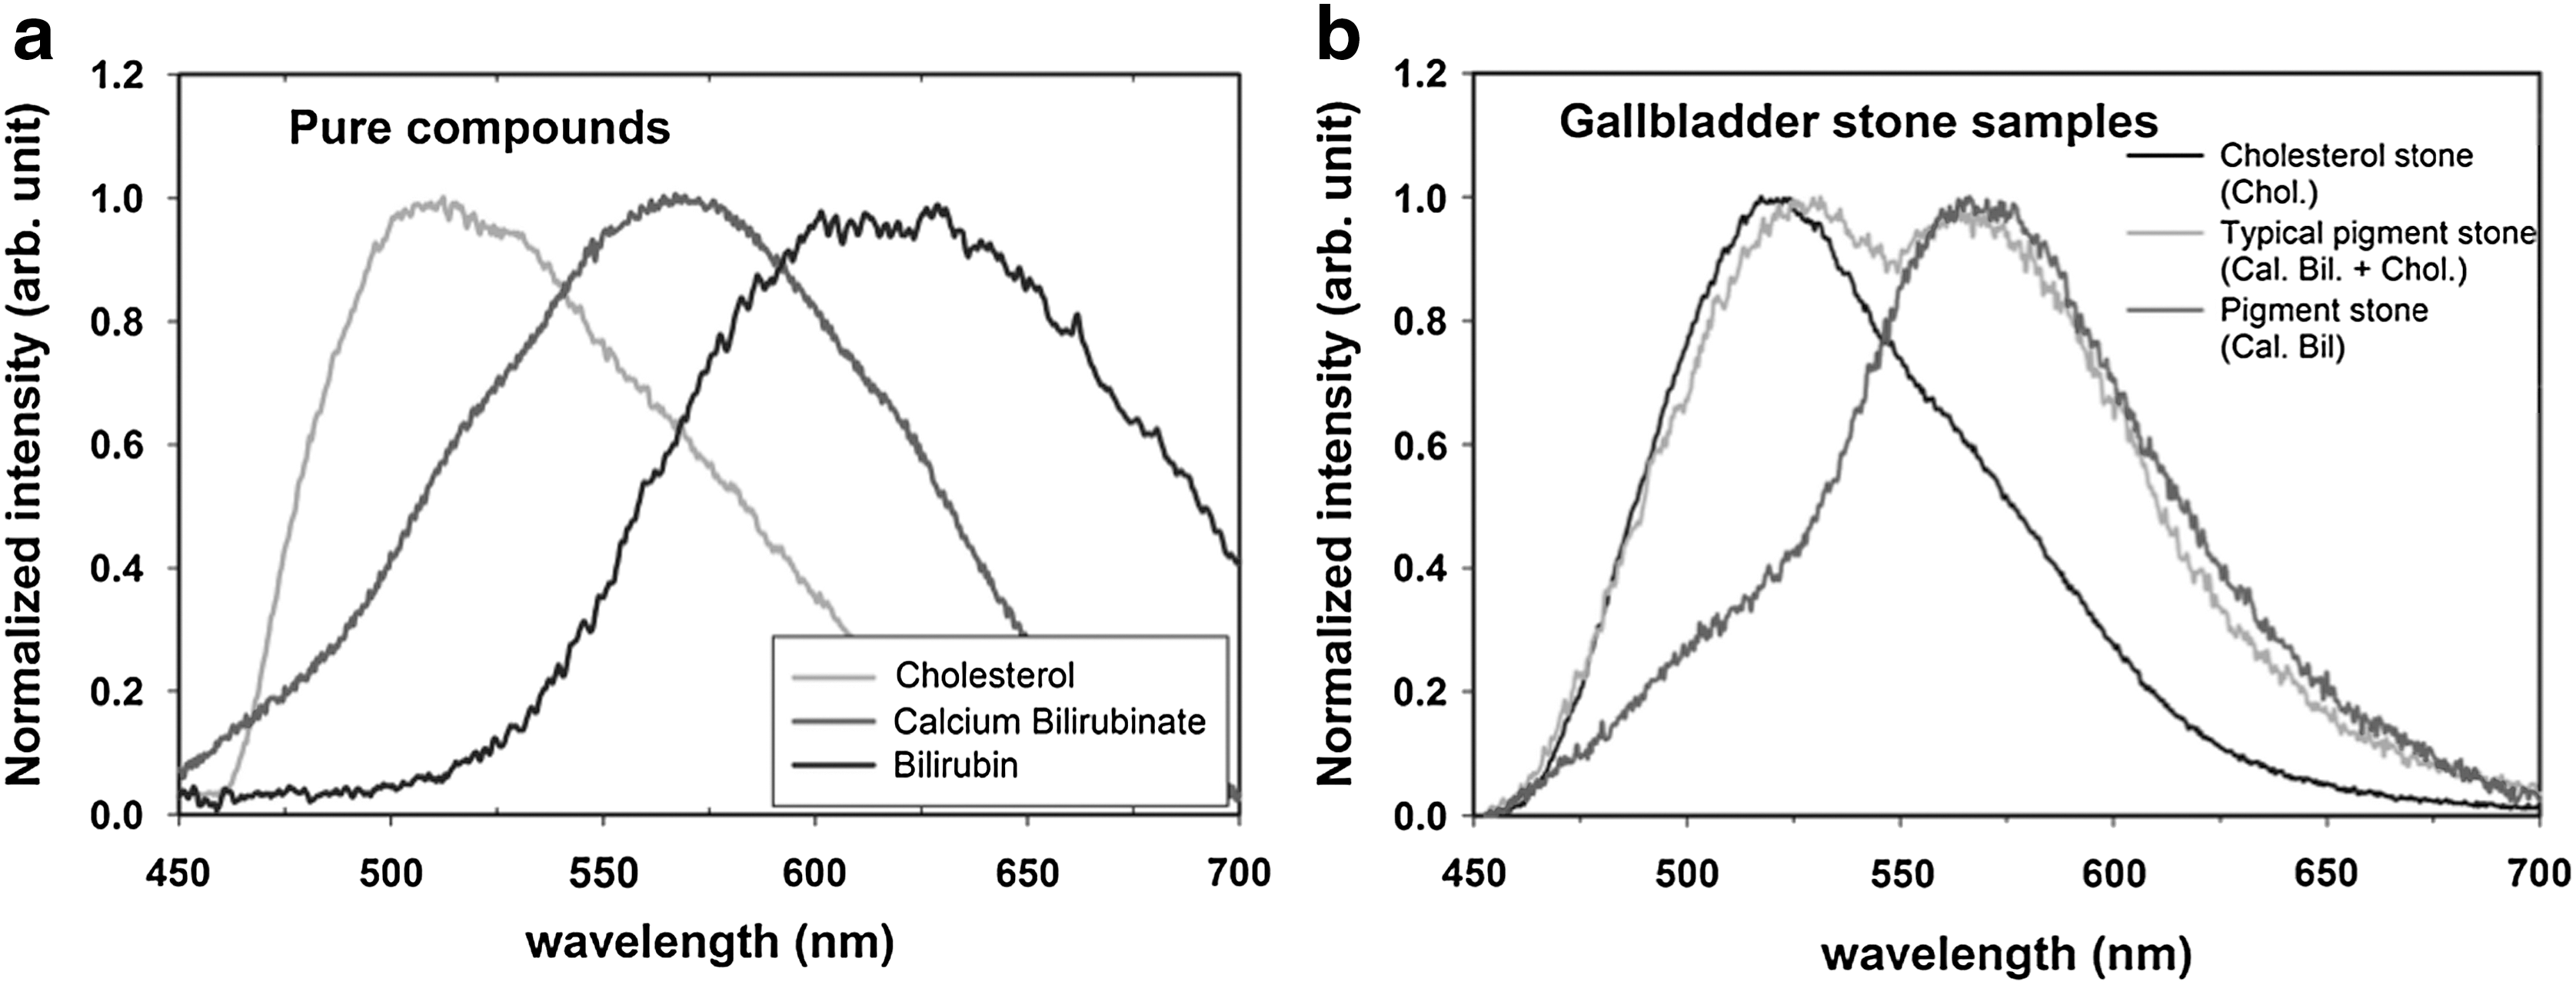
Fluorescence spectra of gallbladder stones compared with pure standards (400 nm excitation).
A comparison between the spectral and temporal analyses of cholesterol and pigment stones, as well as gallbladder tissues in the 520 and 560 nm regions, showed that for the 520 nm peak region, the cholesterol stone (I 520/I 650 = 4.68 ± 0.166) and tissue (I 520/I 650 = 4.81 ± 0.14) had significantly higher emission intensity ratios compared to the pigment stone (I 520/I 650 = 4.28 ± 0.69) (Fig. 4). In terms of fluorescence lifetime, the gallbladder tissue had a significantly longer fluorescence lifetime value (τm(520) = 1.81 ± 0.1 ns) than the cholesterol stone (τm(520) = 0.69 ± 0.29 ns), which was higher than that for the pigment stone (τm(520) = 0.44 ± 0.29 ns). For the 560 nm peak region, the pigment stones showed a significantly higher intensity ratio (I 560/I 650 = 4.13 ± 0.40) than both cholesterol stones (I 560/I 650 = 3.19 ± 0.50), which was significantly higher in intensity than the tissue (I 560/I 650 = 2.14 ± 0.27). The fluorescence lifetimes of the pigment stone (τm(560) = 0.43 ± 0.29 ns) and cholesterol stone (τm(560) = 0.60 ± 0.24 ns) were both significantly shorter than the tissue (τm(560) = 0.96 ± 0.06 ns).
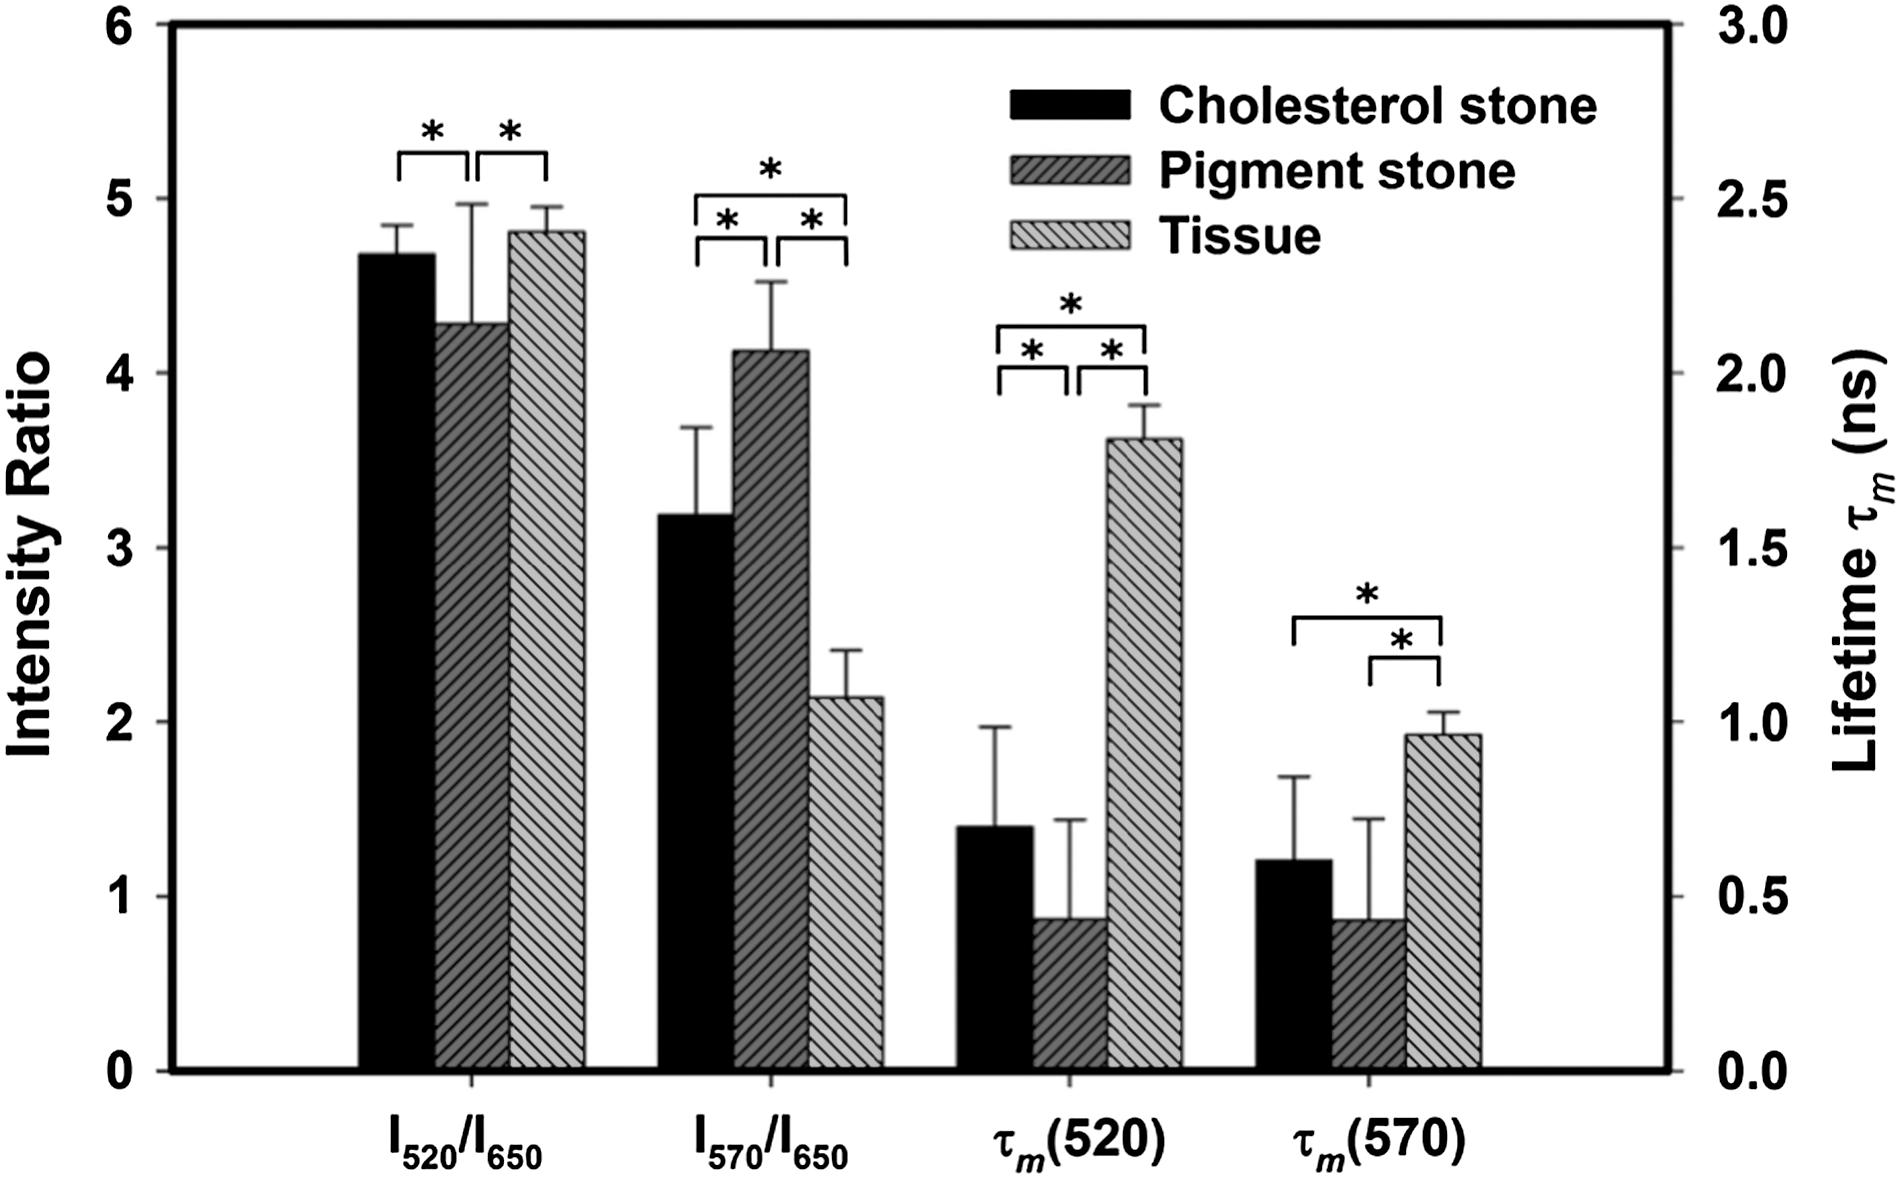
Comparison of the spectral and the temporal parameters at emission wavelength 520 ± 10 and 560 ± 10 nm for the stone and tissue samples (cholesterol stone, pigment stone, and tissue). Error bars indicate mean ± standard deviation, *p < 0.05 (analysis of variance with Tukey's post hoc test).
Discriminant analysis and classification
Next, a two-dimensional scatterplot of two discriminant functions was constructed using the parameters from both spectral- and time-resolved domains (Fig. 5), and the samples were discriminated in terms of classification sensitivity, specificity, and accuracy (Table 1). Function 1 discriminated stones from tissues, whereas Function 2 enabled discrimination of cholesterol stones from pigment stones. Parameters derived from either only spectral features or only temporal features could successfully discriminate between the samples (cholesterol stone, pigment stone, and gallbladder tissue). However, the overall classification accuracy improved (94.88%) when both spectral- and time-resolved parameters were used for discrimination. Meanwhile, the overall classification accuracy was lower when either spectral features (84.39%) or only time-resolved features (85.79%) were used as input predictor variables.
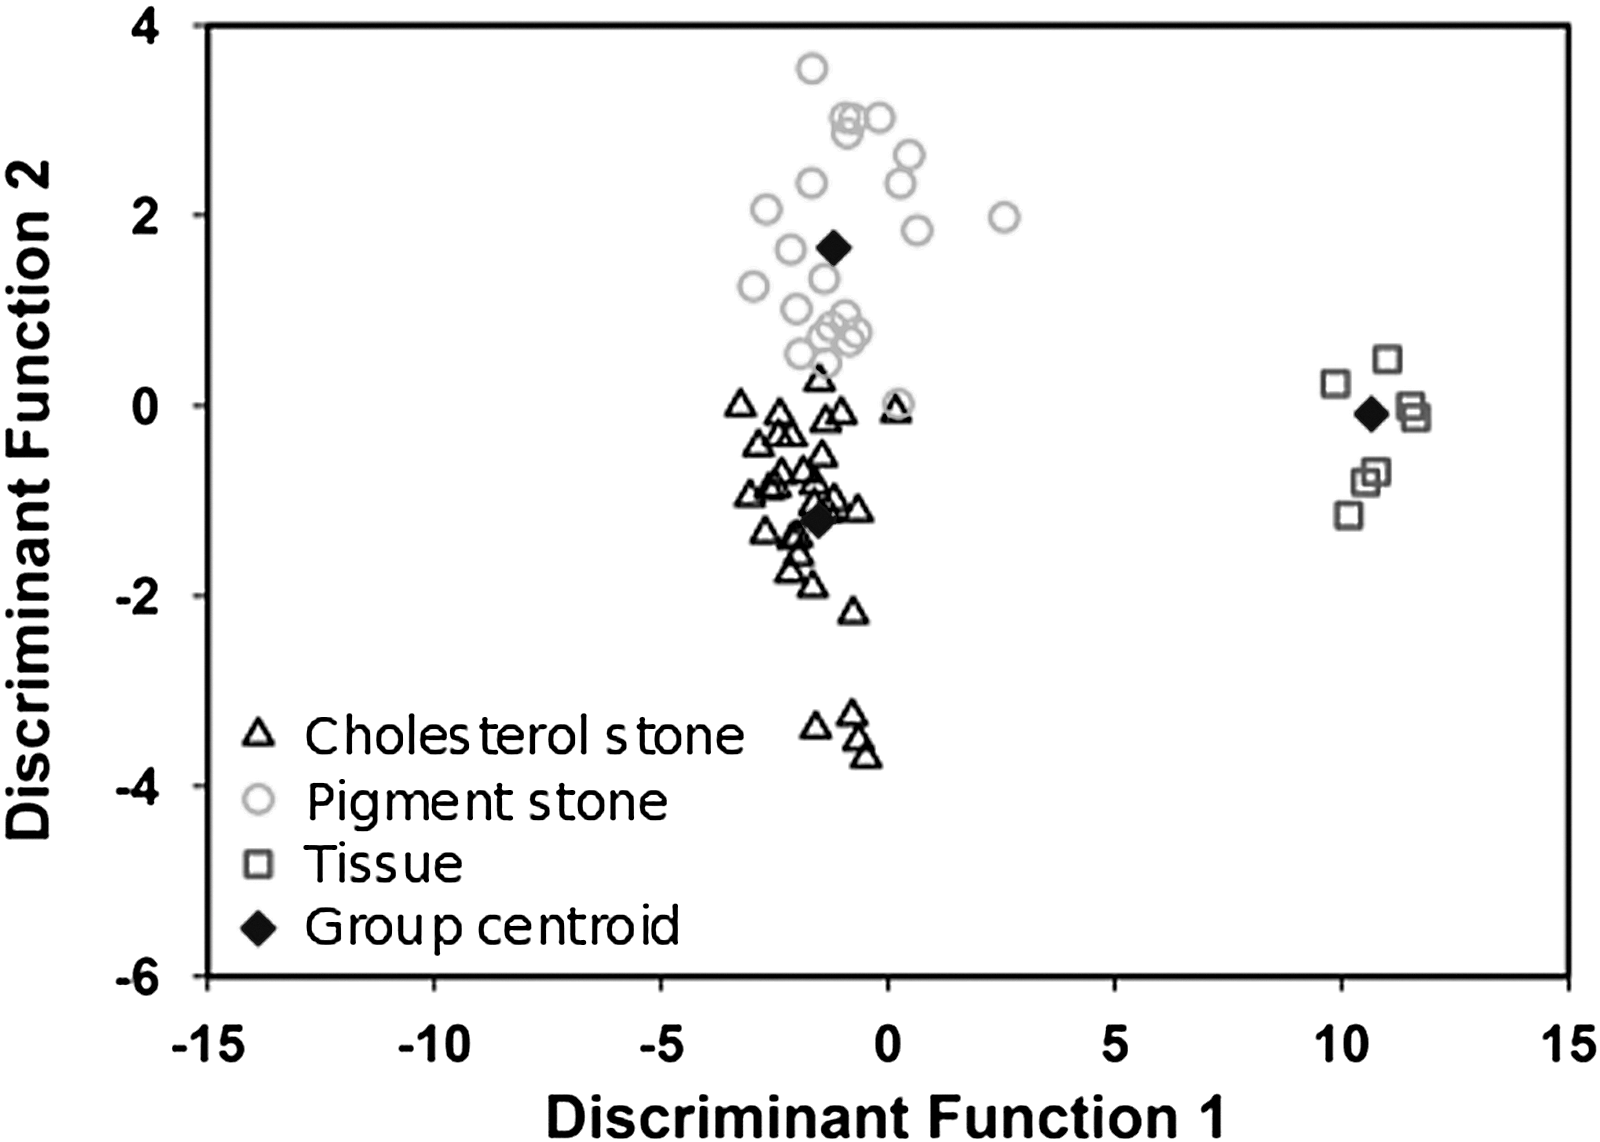
Linear discriminant analysis results using parameters derived from both spectral- and time-resolved domains. The scatterplot shows the discriminant score for the three groups of samples (cholesterol stone, pigment stone, and gallbladder tissue).
To our knowledge, this study is the first to use TR-LIFS to classify stone types (cholesterol and pigment stones) and distinguish stone from tissues to improve guidance during the use of laser lithotripsy procedures. Time-resolved fluorescence emission of the samples was examined with a 400 nm femtosecond laser excitation source and characterized by a unique aspect of fluorescence that allowed classification of the different stone types and discern stone and tissues with high sensitivity and specificity.
TR-LIFS was used to measure both spectral- and time-resolved fluorescence emissions from a single setup. The acquisition of both spectral- and time-resolved measurements provided a better understanding of the biochemical composition of the samples, which improved the accuracy of classification of the stone types and stone-tissue discrimination. Some research groups have shown that spectral-resolved LIFS alone is a potential tool for stone type classification, 23 whereas others demonstrated that spectral-resolved LIFS can be used as a stone-tissue detection tool. 9
The limitation of steady-state fluorescence spectroscopy is that the broad emission band of the chromophore fluorescence may reduce the ability to resolve spectrally overlapping components (cholesterol stones, pigment stones, and tissue). Further, on one hand, the geometry of the excitation/emission can strongly influence the measured spectral profile. On the other hand, time-resolved measurement acquires a fluorescence decay profile and, thus, provides additional information about the chemical composition of the tissue (or stone). The fluorescence lifetime technique
40
has three main advantages for classifying stones and tissue: (1) Lifetime measurement can discriminate between biomolecules that have overlapping spectral emissions but different fluorescence decay profiles. (2) Lifetime measurement can analyze changes in the physiochemical environment. (3) Fluorescence lifetime measurement is less sensitive to the presence of endogenous absorbers (e.g., hemoglobin) or changes in excitation–collection geometry.
We used TR-LIFS in the present study as a guidance (or classification) tool for gallbladder stone laser lithotripsy. For clinical application, this technique has an advantage over the use of dyes (exogenous fluorophores) in that the injection of an external imaging agent (contrast media) is not needed and, in turn, the possibility of agent side-effects (e.g., toxicity) is eliminated.
Conclusions
In summary, an accurate identification of stone types and stone-tissue discrimination plays a crucial role in laser lithotripsy. The ability of clinicians to classify gallbladder stones will help ensure proper setup of laser parameters to improve laser lithotripsy efficacy. Our findings established the feasibility of using TR-LIFS as a tool to identify gallbladder stone types and as a stone-tissue detection system to improve procedure outcomes and reduce the risk of damaging biliary tract tissue. By taking advantage of stone and tissue autofluorescence, the technique described in this article has high potential for further development as a real-time diagnostic tool for guidance in gallbladder stone lithotripsy. Our discrimination analysis performed on 54 gallbladder stones and seven gallbladder tissue samples indicated that TR-LIFS is a robust technique that can classify stone types and discriminate between stone and tissue. Further work is underway in our laboratory to select the optimal wavelength for the LIFS and to thoroughly extract information from the fluorescence spectra. Animal experiments will also be required to verify the efficiency and safety of the technique before clinical trials.
Footnotes
Acknowledgments
The authors thank the general facility projects GS01/08, GS01/05, and GS03/01 of Kuwait University, Faculty of Science for support of this study. The authors thank Mr. Mathew Joseph and Mrs. Remya Nair for their assistance in conducting the experiments.
Author Disclosure Statement
No competing financial interests exist.