
Abstract
Introduction
T
The pulp tissue of permanent and primary or deciduous teeth houses mesenchymal stem cells. 3 –5 Stem cells from human exfoliated deciduous teeth (SHED) were first mentioned by Miura et al. 3 and have adequate proliferation capacity along with differentiation into odontoblasts, osteoblasts, nerve cells, adipose cells, chondrocytes, and myoblasts, as well as the expression of neural cell markers. 3 –15 Studies on the therapeutic applications of SHED demonstrate the capacity of such cells to contribute to the repair process of some tissues, including pulp tissue when cultivated in matrices, 5,14 bone tissue, 16,17 and the epithelium of the cornea. 18 SHED have also demonstrated an immunomodulatory capacity, with good results reported in the treatment of adverse conditions of the immune system, such as systemic lupus erythematosus 7 and rheumatoid arthritis. 19 Different studies have sought to establish conditions that favor high degrees of stem cell proliferation, viability, and plasticity. 20 –22
Photobiomodulation [PBM, often referred as low-level laser therapy (LLLT)] using laser or light-emitting diodes (LEDs) has demonstrated the ability to modulate the viability and proliferation of different cell types, and the effect of these light sources has also been evaluated in stem cell cultures. 23 –26 The effect of PBM on SHED has recently been described and it has been demonstrated that irradiation with infrared LED (850 nm and 40 mW/cm2) is capable of increasing the expression and activity of alkaline phosphatase and collagen synthesis and the expression of dentin sialophosphoprotein in SHED cultivated in a medium that induces osteogenic differentiation. 27 Moreover, PBM has been found to increase the viability, proliferation, and production of mineralized tissue in stem cells from deciduous teeth that remain for 12 h in a state of nutritional deprivation before irradiation. 28
The evaluation of PBM using LED on stem cells is important, as this resource is an efficient low-cost alternative to PBM using low-level laser. 27 –32 Thus, the aim of the present study was to evaluate the effects of red LED, using dosimetric parameters similar to those recently described, in cell cycle, mitochondrial membrane potential, and cellular senescence of SHED.
Materials and Methods
Patients
For the acquisition of SHED, deciduous teeth were obtained from two healthy patients: one male (10 years of age; tooth 63) and one female (11 years of age; tooth 65). The teeth were sound (with no carious lesions or inflammatory/infectious processes) and had had a clinical indication of extraction due to mobility related to the natural exfoliation process. The methods used in this study received approval from the human research ethics committee (protocol no. 133.407 on May 17, 2012 and no. 1249061 on September 29, 2015).
Cell isolation
Immediately after extraction, each tooth was placed in a tube containing DMEM/F12 medium (Invitrogen, Carlsbad, CA) with the addition of 4% antibiotic (100 U/mL of penicillin and 100 μg/mL of streptomycin sulfate; Invitrogen) and 15% fetal bovine serum (FBS) (HyClone, South Logan, UT). In laminar flow, the pulp tissue was removed with sterile endodontic files, transferred to a Petri dish, washed with phosphate-buffered saline (PBS) 0.01 M, pH 7.4, fragmented, and distributed in six-well culture plates containing DMEM F12 medium (Invitrogen) with the addition of 100 U/mL of penicillin, 100 μg/mL of streptomycin sulfate (Invitrogen), 1% nonessential amino acids (Invitrogen), and 15% FBS (HyClone). The plates were maintained in a laboratory incubator at 37°C with 5% CO2 for 20 days, with the culture medium changed every 3 days. The cells were then detached (trypsin 0.25%; Invitrogen) and plated (104 cells) in 25-cm2 bottles. The cultures were kept in semiconfluence to avoid differentiation. Cultures above three passages on tissue culture plastic were analyzed for surface marker expression. All experiments described henceforth were performed separately for each cell line (n = 3 for each).
Characterization by flow cytometry
The extracted cells were cultured for 48 h, washed thrice with PBS (Invitrogen), and harvested in 0.25% trypsin/ethylene diamine tetraacetic acid (EDTA). Aliquots containing 106 cells were stained with the following fluorescein isothiocyanate (FITC)-conjugated antibodies: CD105 (AbD Serotec, Raleigh, NC), CD45 (Sigma-Aldrich, St. Louis, MO), CD90 (Abcam, Cambridge, MA), CD34 (Santa Cruz Biotechnology, Dallas, TX), CD29 (Santa Cruz Biotechnology), CD73 (Santa Cruz Biotechnology), and CD146 (Abcam) at a concentration of 1 μg/mL at 4°C for 1 h. The corresponding isotope antibody was used as the negative control, and goat anti-Mouse IgG (H/L): FITC (AbD Serotec) was used as a secondary antibody. The cells were pelleted, washed twice with PBS, and fixed with 1% paraformaldehyde. Fluorescence-activated cell sorting (FACS) analysis was performed in a BD Biosciences FACSCalibur flow cytometer (Becton Dickinson, San Jose, CA). Surface antigen expression was determined with a variety of directly labeled antibodies following the supplier's recommendations.
Cell culture
The cell cultures were kept in Dulbecco MEM medium (DMEM; Vitrocell, Campinas, São Paulo, Brazil) and Ham's/F12 supplement (Vitrocell) at a proportion of 1:1, to which a 1% antibiotic solution (100 U/mL of penicillin and 100 μg/mL of streptomycin sulfate) (Vitrocell), 1% nonessential amino acid solution (100 × ; Sigma-Aldrich, St. Louis, MO), and 15% FBS (Vitrocell) were added. The cultures were maintained in semiconfluence to prevent cell differentiation until reaching a sufficient amount for the experiments (maximum of six passages). The medium was exchanged every 2 days to maintain cell viability. The number of viable cells for the experiments was determined using the exclusion technique of nonvital cells stained with Trypan Blue (Invitrogen). All experiments were performed in triplicate (n = 6).
Photobiomodulation
A single irradiation was performed using a cluster of four LEDs. The characteristics of each LED, as well as the dosimetric parameters used in this study, are described in Table 1.
FWHM, full width at half maximum; LED, light-emitting diode.
Light absorbance was calculated as described by Silva et al. 33 The absorption coefficient was estimated at about 93%. As the effects of PBM depend on the absorption of energy by the cell or target tissue, the description and calculation of the energy that effectively reaches the target are essential in any study involving PBM. 33
The LED (emitters) was positioned over the upper portion of the plate such that each irradiated a well in continuous mode simultaneously (Fig. 1). The temperature of the medium increase was less than 1°C after the irradiation in all groups, except the group receiving 32 J/cm2 where the increase was 1.5°C.
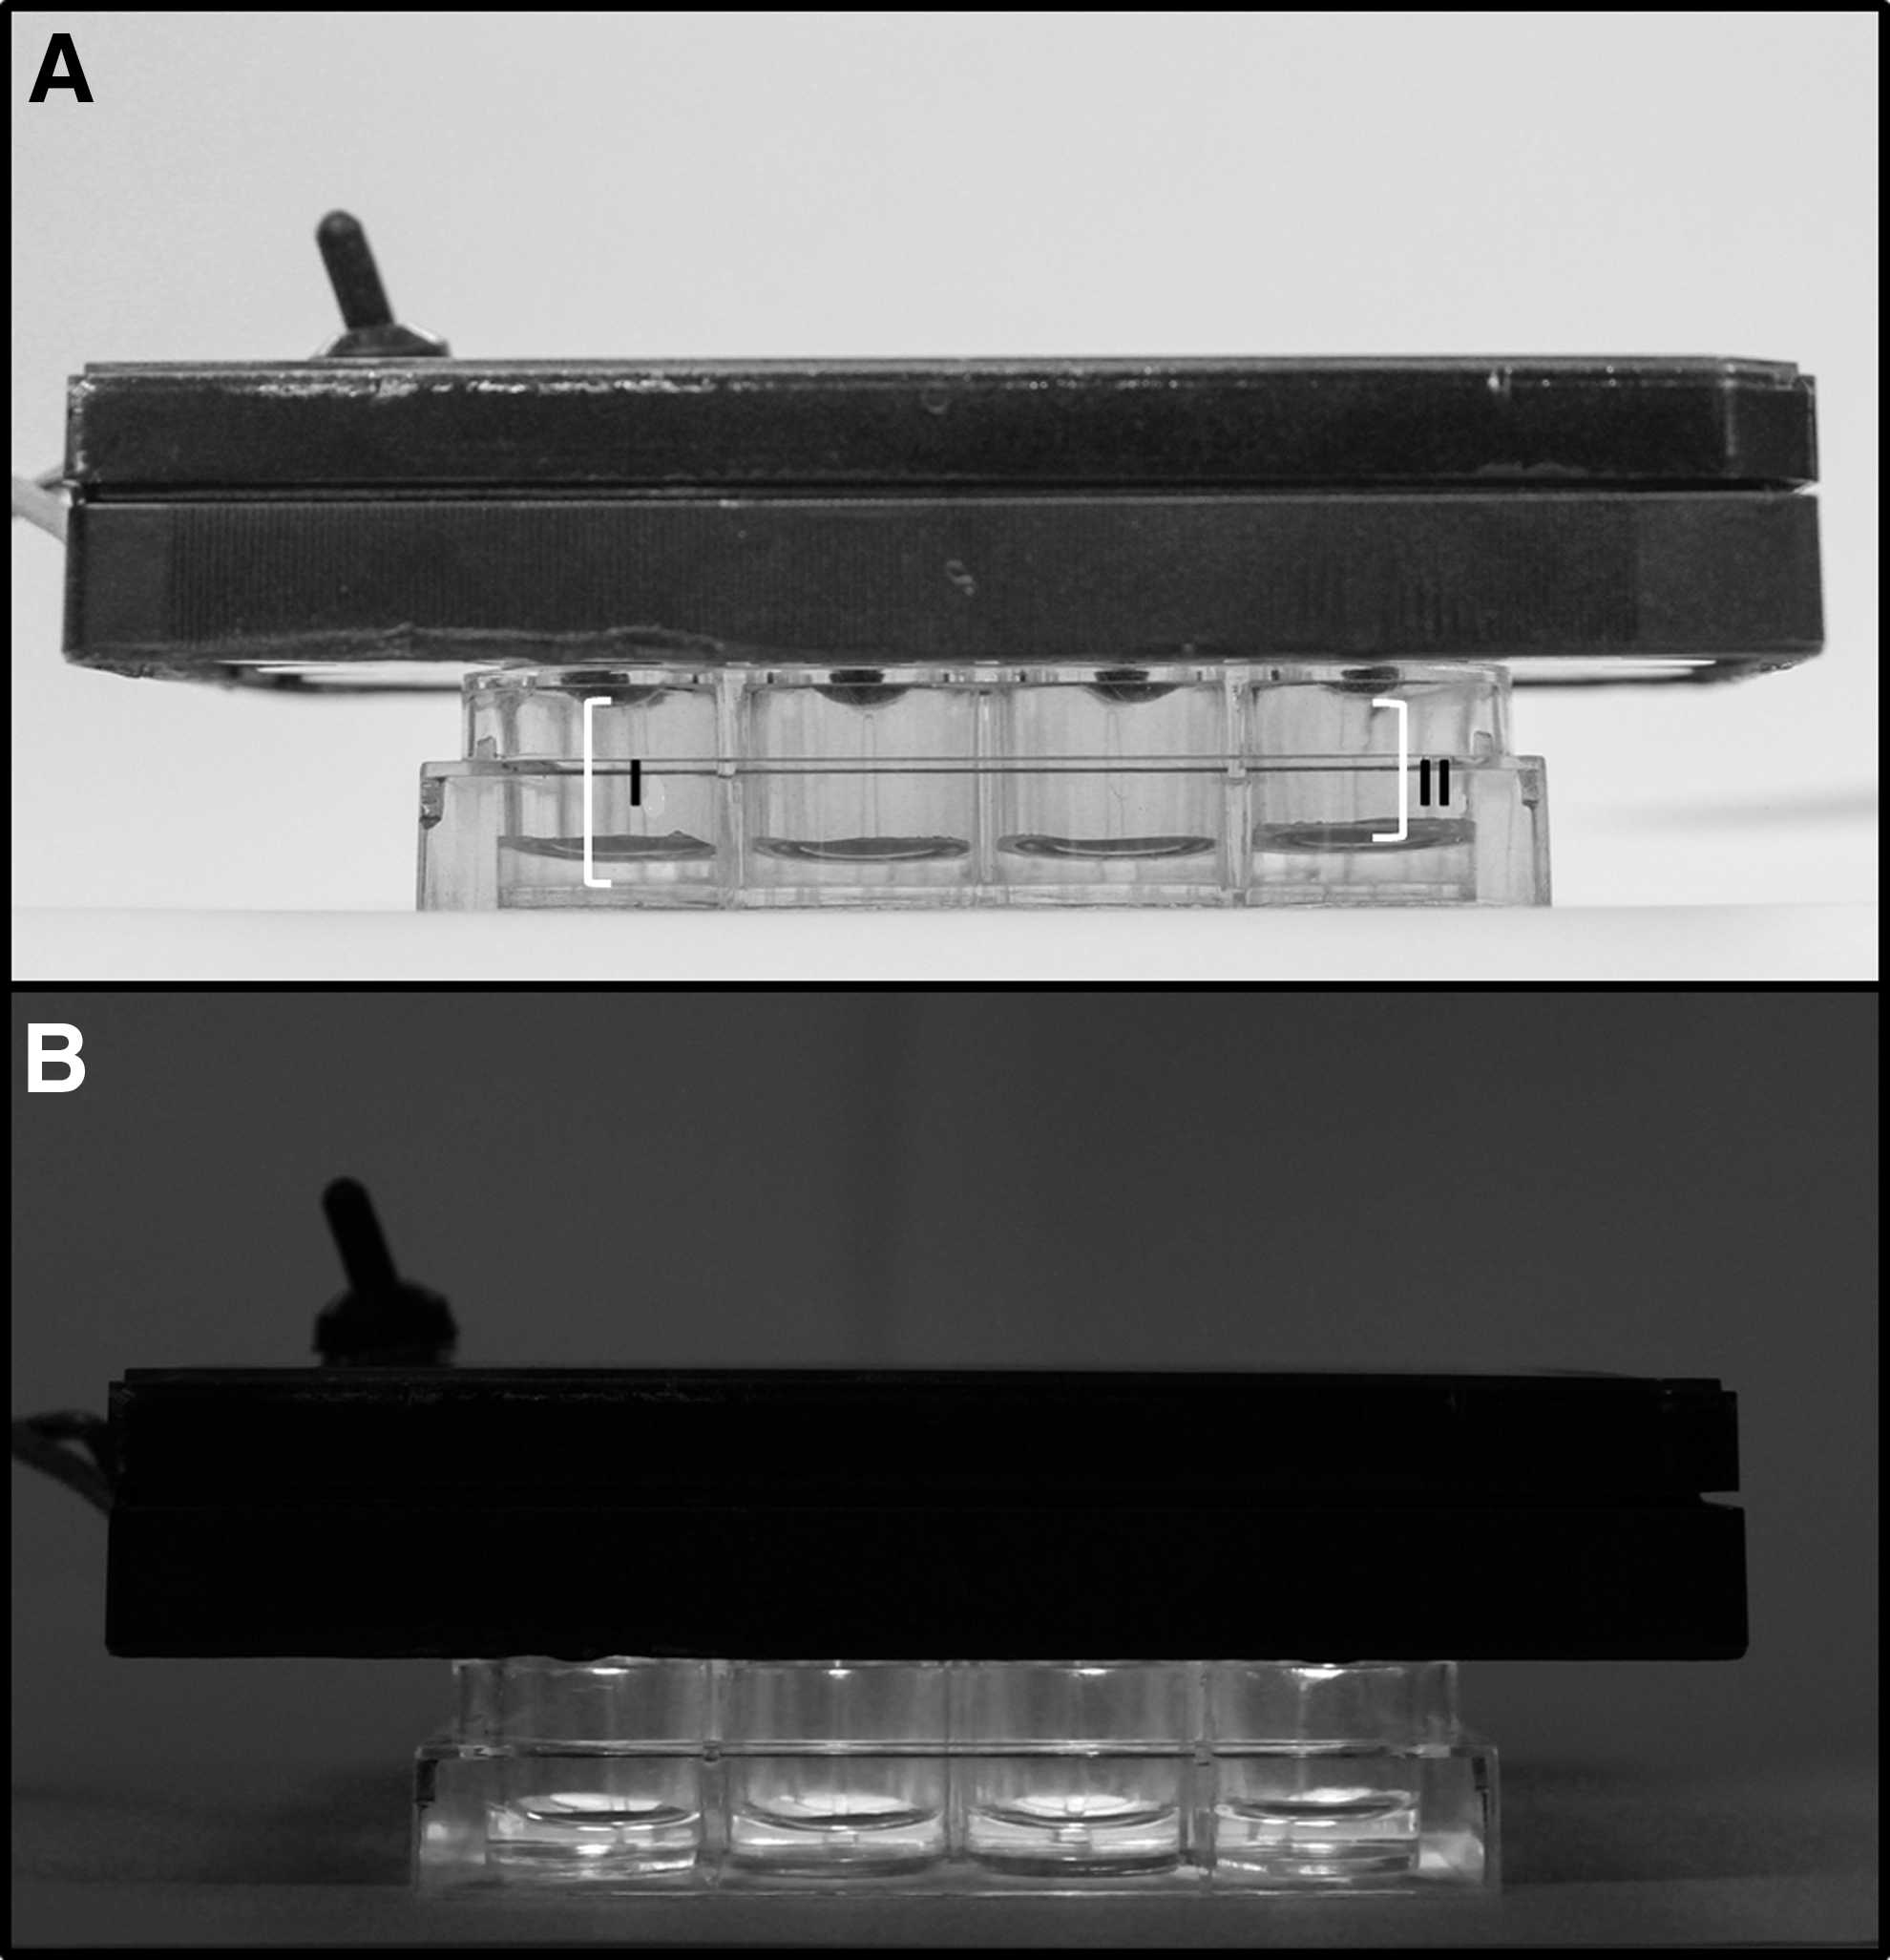
SHED irradiation procedure, demonstrating cluster with four LEDs positioned over 24-well culture plate [
Evaluation of PBM effect on cell cycle and mitochondrial membrane potential (ΔΨm)
The cells (105/mL per well) were plated in triplicate (n = 6) in 24-well culture plates (Techno Plastic Products AG, Zollstrasse, Switzerland) in DMEM/F12 medium containing a 1% antibiotic solution and 10% FBS, based on Eduardo et al. 34 and irradiated with five different energy densities (2, 4, 8, 16, and 32 J/cm2), as previously described by Turrioni et al. 28
After irradiation, the plates were incubated at 37°C for 24 h in an atmosphere with 5% CO2. The cultures in all groups were then incubated (in triplicate) with trypsin solution at 37°C for 10 min in an atmosphere with 5% carbon dioxide, and the contents of the wells were centrifuged at 293 g for 5 min.
For the cell cycle analysis, the precipitates were resuspended in an RNAse alcohol solution and stored in a freezer at −20°C for 24 h. The samples were then centrifuged for 10 min at 1811 g, resuspended in 200 μL of FACS buffer (with 10% Triton X-100 and 18 μg/mL of propidium iodide) (Sigma Chemical Co., St. Louis, MO), and kept at room temperature for 30 min in the dark. The samples were then transferred to cytometric tubes and analyzed using a FACSCalibur flow cytometry system (Becton Dickinson Biosciences, San Jose, CA) at FL-2 H fluorescence intensity. The histograms were performed with the aid of the CellQuest™ program, version 3.1.
For the analysis of mitochondrial membrane potential, rhodamine 123 (Rh123) (Sigma Chemical Co., St. Louis, MO) was added (5 μg/mL) to the tubes, and the samples were incubated for 30 min at 37°C in an atmosphere with 5% carbon dioxide. The tubes were then centrifuged, the supernatant was discarded, and the precipitates were resuspended in 100 μL of FACS buffer. The reading and analysis of Rh123 were performed in a FACSCalibur flow cytometer with the aid of the CellQuest program, version 3.1.
After the analysis of the data from the dose–response assays, 2 and 16 J/cm2 were chosen, as these energy densities achieved the best results in the cell cycle analysis. The justification for this choice is described in the Results section.
Evaluation of PBM on senescence of SHED
The cultures of SHED in the control group and in the irradiated groups with 2 or 16 J/cm2 were incubated for 24 h at 37°C in an atmosphere with 5% carbon dioxide. The medium was then removed, and the wells were washed with PBS 1 × buffer solution, fixed, and stained using the β-Galactosidase Staining Kit (Cell Signaling Technology, Inc. Danvers, MA). The plate was then kept at room temperature for 15 min. The wells were washed again with PBS, and the stained cultures were viewed under an inverted microscope (Nikon, Eclipse) with the aid of the NIS-Elements F3.00, SP7, Laboratory Imaging program at a magnification of 80 × . The percentage of cells in senescence was determined by counting blue stained cells on photographs obtained directly from the inverted microscope. Three independent experiments were performed in triplicate.
Data analysis
Analysis of variance (ANOVA) followed by the Tukey–Kramer test was used to identify statistically significant differences among the groups. A significance level of α = 0.05 was assumed. The graphs were created with the aid of the Prism program (version 5.0) and ModFit program (version 3.2).
Results
Cell phenotype of SHED
The SHED cultures demonstrated adherence to the culture bottles and were positively labeled for CD29, CD73, CD90, CD105, and CD146. No labeling occurred for CD45 and CD34, confirming the characterization of mesenchymal stem cells (see Dominici et al. 35 ).
Effects of PBM on cell cycle phases
No differences were found between the experimental groups and control group in relation to the percentage of cells in the G0/G1 and G2/M phases (Fig. 2). Only the group irradiated with 16 J/cm2 had a higher percentage of cells in the S phase in comparison to the control group (p < 0.05). No significant differences in relation to cell cycle phases were found in the groups irradiated with other energy densities in comparison to the control. The groups irradiated with 2, 4, and 16 J/cm2 showed higher number of cells in the S phase in comparison to the group irradiated with 32 J/cm2 (p < 0.05).
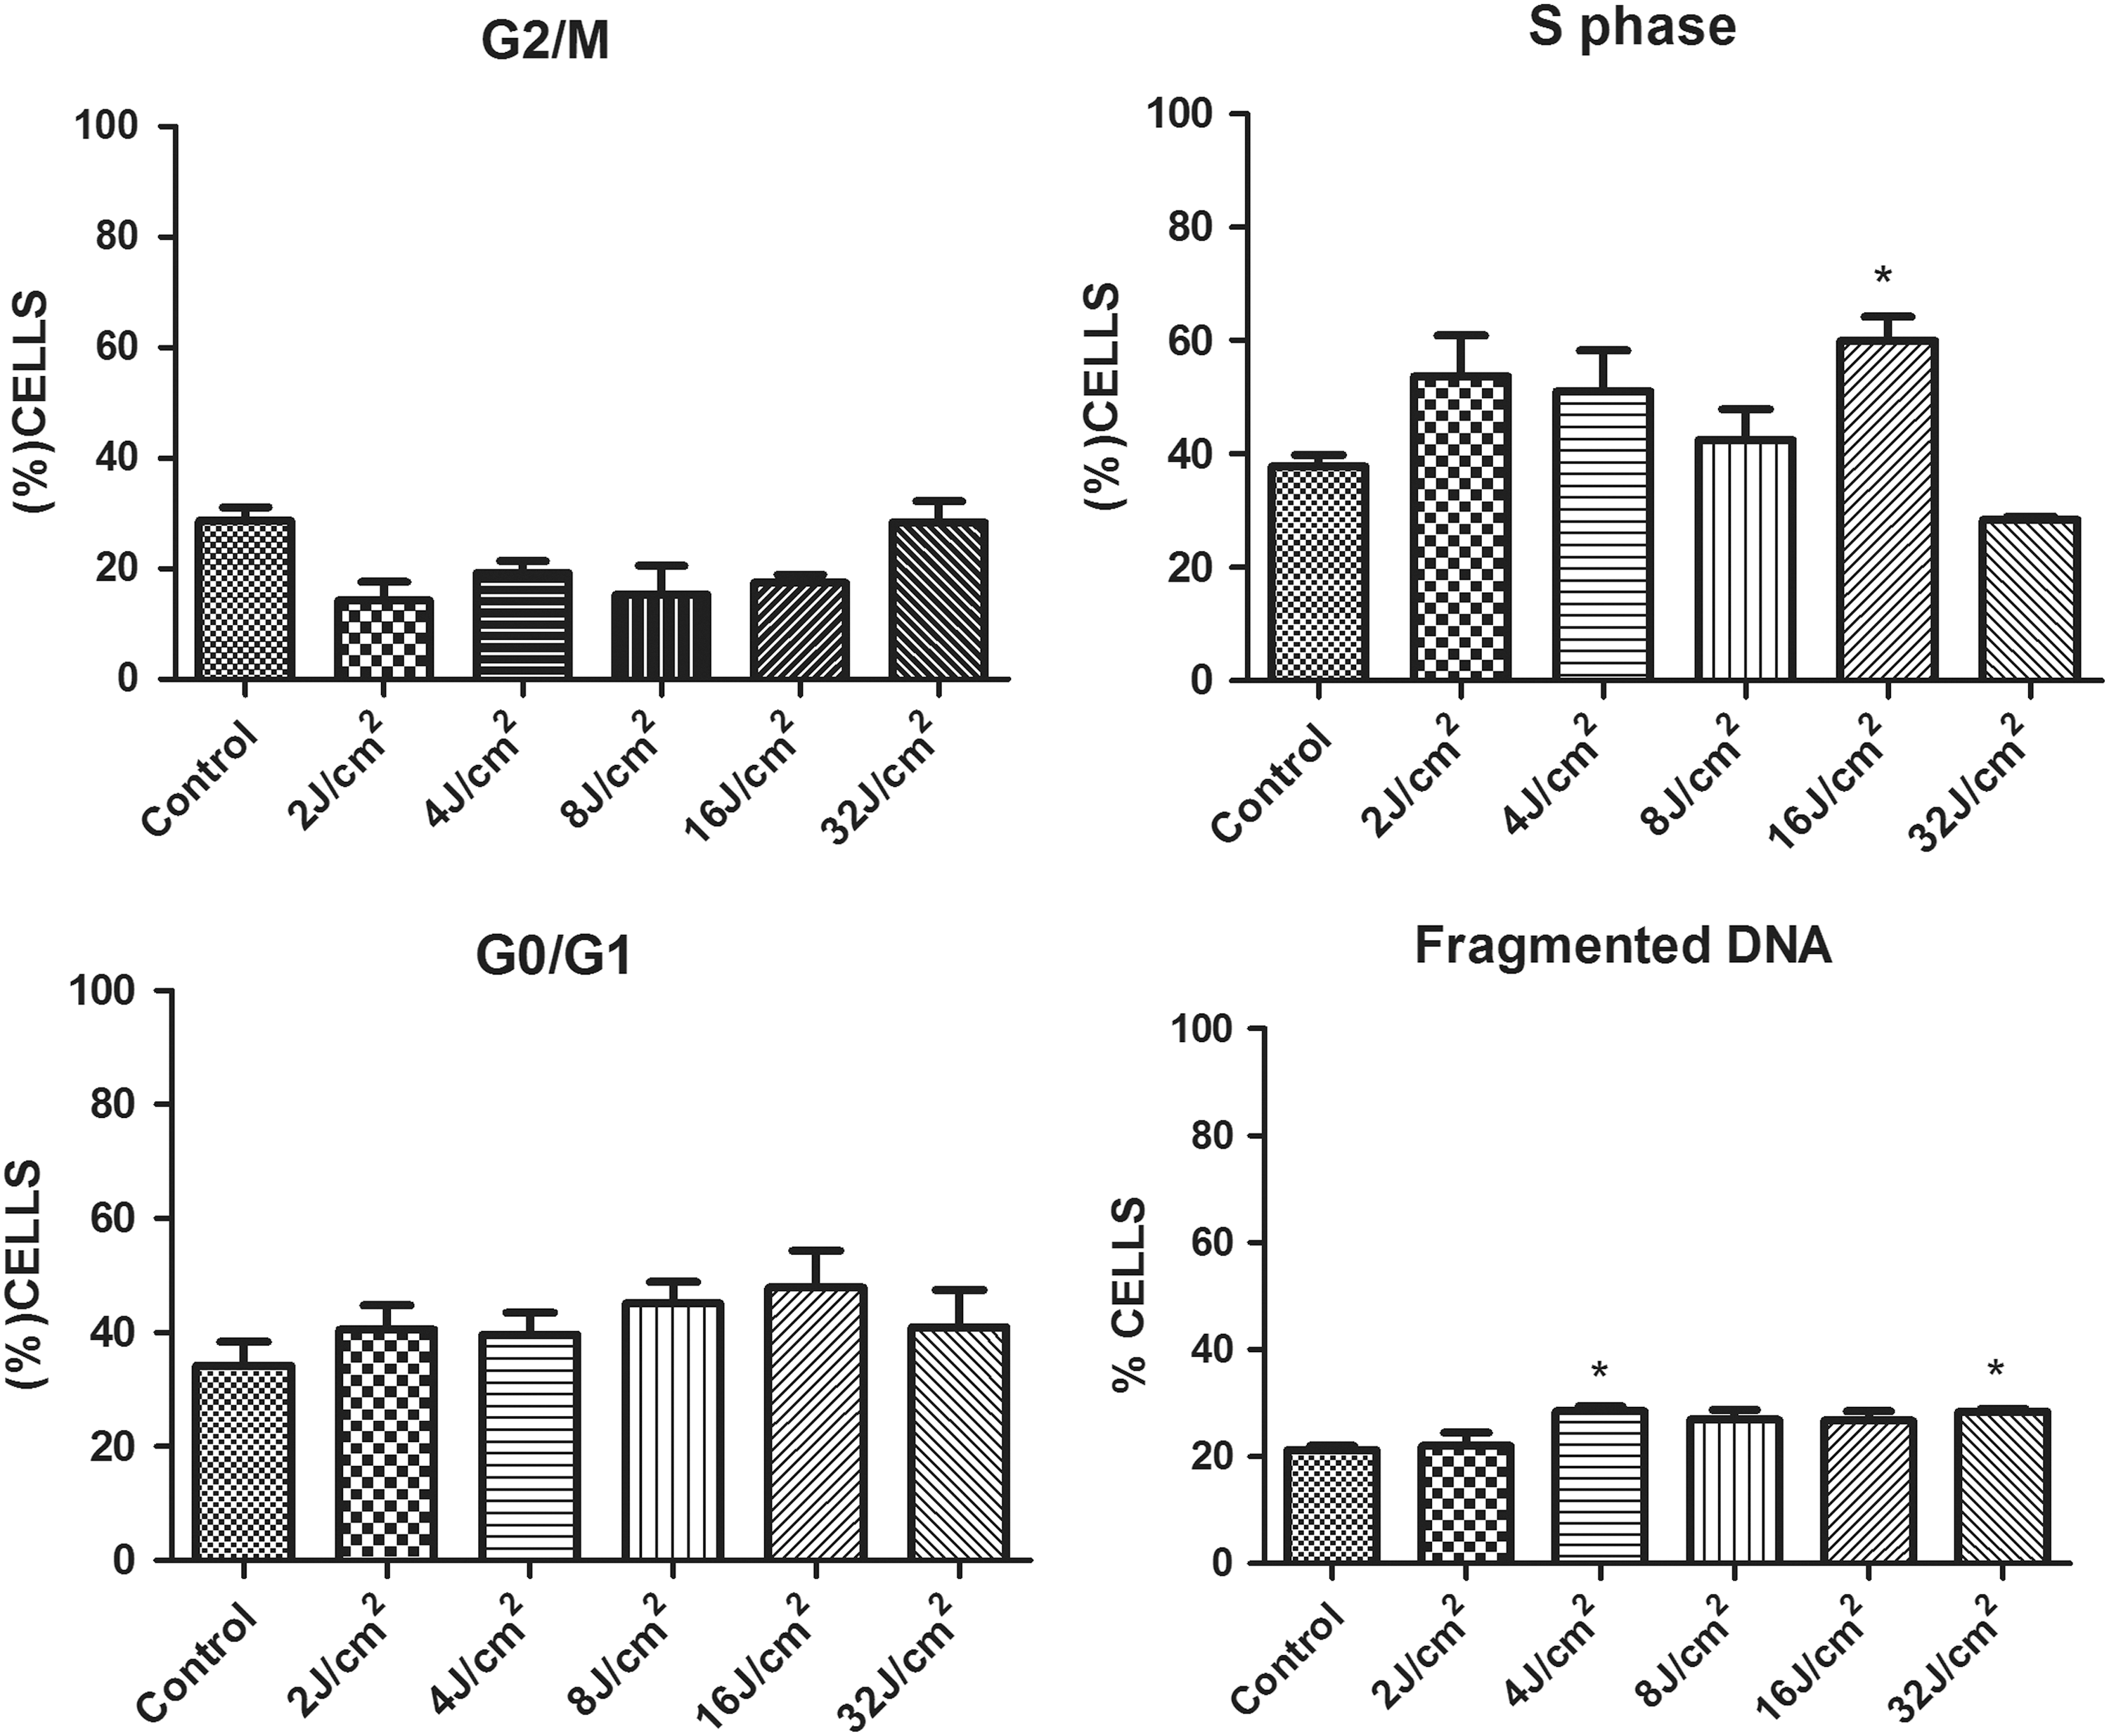
Percentage of cells distributed throughout cell cycle (G0/G1, G2/M, Phase S, and fragmented DNA) in all experimental groups; *statistically significant difference in comparison to control (p < 0.05); data expressed as mean ± SD of three independent experiments.
The percentage of cells with fragmented DNA was higher in the groups irradiated with 4 and 32 J/cm2 in comparison to the control group (p < 0.05). The group irradiated with 32 J/cm2 also had a higher percentage of cells with fragmented DNA in comparison to the group irradiated with 2 J/cm2 (p < 0.05). There was no difference in DNA fragmentation between irradiated groups.
Effect of PBM on mitochondrial membrane potential (Δψm)
No differences among the experimental groups were found with regard to the percentage of cells with active mitochondria (Fig. 3).
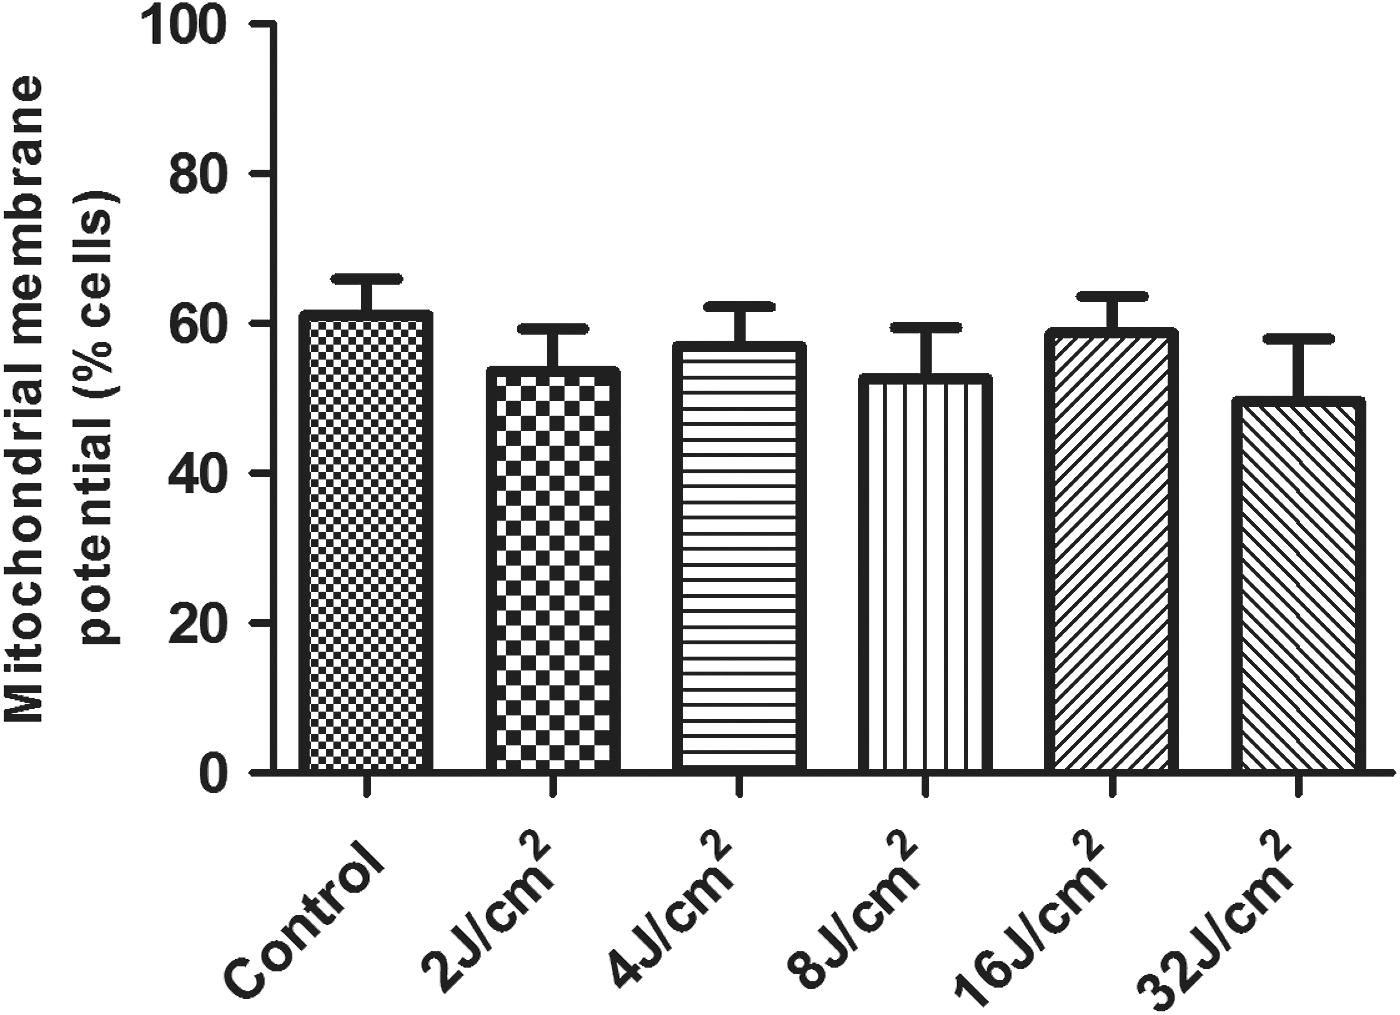
Evaluation of mitochondrial membrane potential: percentage of cells with active mitochondria in each experimental group; data expressed as mean ± SD.
Choice of dosimetric parameters for evaluation of senescence
Irradiation with 16 J/cm2 increased the percentage of cells in the S phase, indicating the potential induction of a proliferative response. Cultures irradiated with 4 and 32 J/cm2 had higher percentages of cells with fragmented DNA in comparison to control cultures, indicating the induction of apoptosis. Cultures irradiated with 2 and 8 J/cm2 exhibited no statistically significant differences in comparison to the control group for any of the phases of the cell cycle. However, cells irradiated with 2 J/cm2 demonstrated a nonsignificant increase in the percentage of cells in the S phase in comparison to the control group. Thus, energy densities of 2 and 16 J/cm2 were chosen for the evaluation of senescence.
Effect of PBM on senescence
SHED irradiated with 2 and 16 J/cm2 showed no difference in the percentage of cells in senescence compared to control (Figs. 4 and 5).
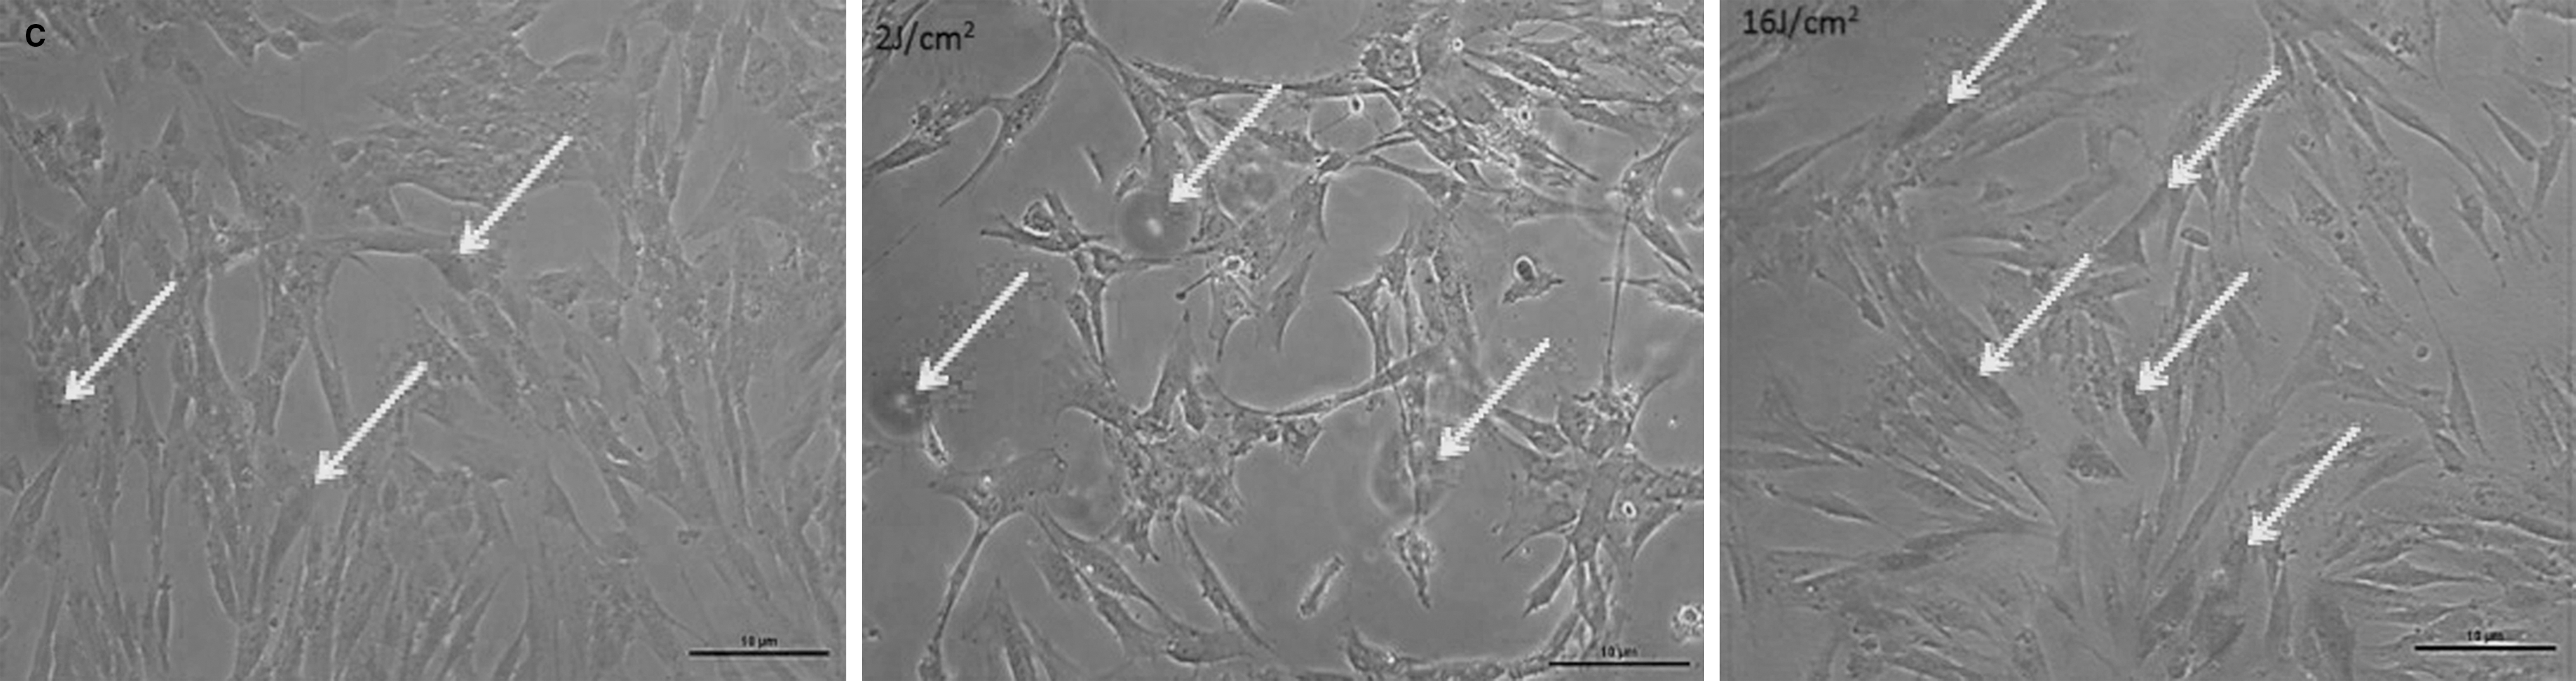
Senescence assay in control culture (C) and cultures irradiated with 2 and 16 J/cm2. Arrows indicate cells in a senescent state.
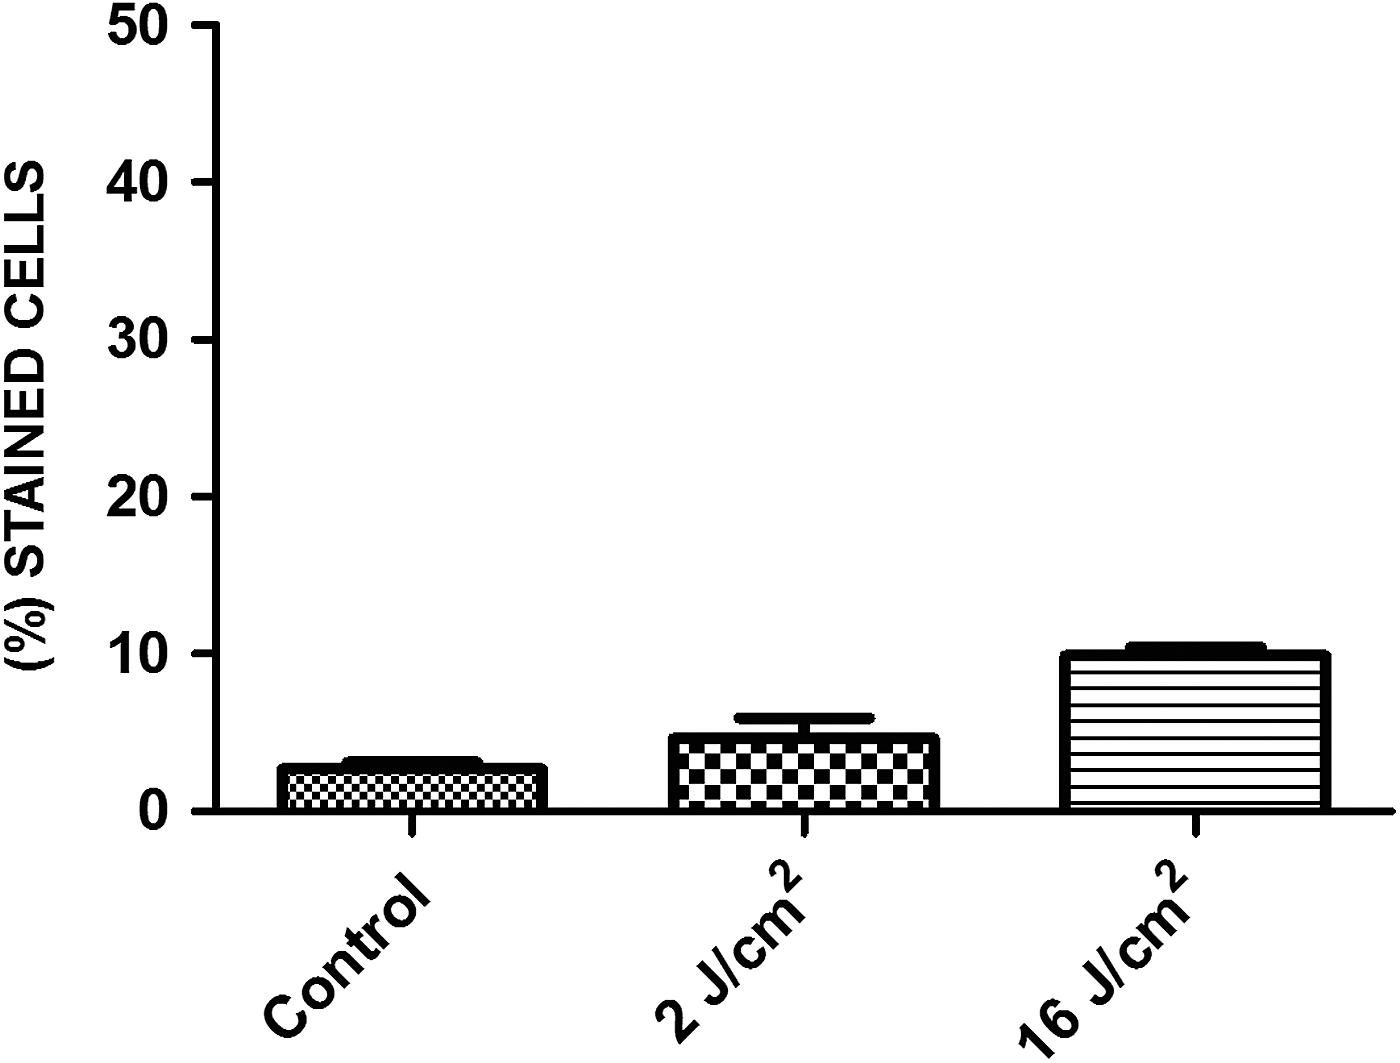
Percentage of senescent cells in each experimental group; data expressed as mean ± SD.
Discussion
The present study evaluated the effects of red LED (630 nm, 37 mW/cm2, 75 mW) using five different energy densities (2, 4, 8, 16, and 32 J/cm2) on the cell cycle, mitochondrial membrane potential, and cellular senescence of SHED. Irradiation with 16 J/cm2 was capable of inducing a proliferative response in SHED without affecting mitochondrial function or inducing senescence.
The behavior of stem cells used in TERM is regulated by a number of factors, some of which are linked to the origin of the cells and others are linked to the microenvironment into which the cells are inserted. 36 Thus, many researchers have sought scaffolds, biologically active products, and other methods that favor the maintenance of high rates of stem cell proliferation, viability, and plasticity. 21,22,37
The effects of PBM, that is, LLLT and/or LED on stem cell cultures have previously been evaluated. 23 –29 The wavelengths used were red (∼660 nm) and infrared (∼810 nm), as well as difference radiances, energy densities, operating modes, evaluation periods, and methods hinder the direct comparison of the findings. 23 –26 Both LLLT and LED seem to be able to modulate the proliferative response and differentiation of stem cells, depending on the dosimetric parameters. 23,24
The effects of PBM do, however, vary due to the dosimetric parameters and cell type, 23,24,38 –40 including stem cells derived from the pulp tissue of permanent and deciduous teeth. Four studies addressed the effect of laser irradiation on stem cells from permanent teeth 39 –42 ; all used red laser (660 nm), irradiation of 20–40 mW, and energy densities ranging from 0.5 to 42 J/cm2 (with the exception of two groups in the study conducted by Pereira et al., 41 who reported that PBM using laser crossed the dentinal barrier). These findings varied considerably, which hinders the establishment of the optimal dosimetric parameters for the treatment of dental pulp stem cells. Recent studies have also reported positive effects of PBM using laser radiation on the viability and proliferation of SHED, depending on the dosimetric parameters used. 43,44
The same difficulty is encountered regarding the establishment of the optimal dosimetric parameters for phototherapy involving LED to maintain the viability and proliferation of stem cells derived from the pulp tissue of deciduous teeth. Only two studies addressing this issue were found in the literature. 27,28
Turrioni et al. 27 investigated the effects of infrared LED irradiation on the expression and synthesis of proteins related to the formation of mineralized tissue by SHED cultivated in an osteogenic differentiation inducing medium. The cells were irradiated with a set of 24 LEDs (850 ± 10 nm, 40 mW/cm2) for 50 sec (2 J/cm2) or 100 sec (4 J/cm2), and better results were achieved using irradiation with 4 J/cm2. The same group of researchers 28 investigated the effect of LED (850 ± 10 nm, 40 mW/cm2) irradiation on SHED without the use of a differentiation inducing medium, and the stem cells were kept in a medium with 0.5% FBS for 12 h before the experiments to simulate a state of nutritional deprivation. The authors report that the stem cell cultures irradiated with 4 J/cm2 demonstrated greater viability than nonirradiated cells after 12 and 72 h [as evidenced by the MTT (3-(4, 5-dimethylthiazol-2-y)-2, 5-diphenyl tetrazolium bromide) assay]. In addition, all irradiated cultures had a larger number of viable cells in comparison to nonirradiated cells after 12 h, whereas only those irradiated with 4 J/cm2 demonstrated an increase in proliferation after 72 h.
Unfortunately, the importance of each physical irradiation parameter (wavelength, power, energy, radiant exposure, number of irradiations, and interval between irradiations) has not yet been fully clarified. However, it is accepted that the beneficial effects of PBM depend on the biphasic dose response; the challenge is obtaining the best dose (radiant exposure/energy density) for each application. 40,45,46 In the present study, irradiation with 16 J/cm2 was the only energy density capable of inducing an increase in the percentage of cells in the S phase of the cell cycle, demonstrating a positive effect on cellular proliferation. Moreover, no significant differences in mitochondrial membrane potential or senescence were found with this energy density in comparison to the nonirradiated control group, suggesting that LED has no undesirable effect on SHED.
The divergences between the present findings and those described by Turrioni et al. 28 may be linked to the difference in the LED wavelength used, the use of different evaluation methods and periods, and/or the fact that the cells were maintained in a medium with 10% FBS beginning at the time of irradiation. However, both studies indicated that SHED irradiated with LED showed significant increase in cell viability and proliferation, using particular dosimetric parameters.
For the desired results in tissue engineering, 5,14,16 –19 stem cells must have good proliferation and viability rates, 21–22 as well as a low rate of senescence. 47 In this context, based on our results, PBM with LED may be an important tool in tissue engineering. Thus, further studies should be conducted to optimize dosimetric parameters 40 and the metabolic pathways involved in PBM of SHED by LED.
Conclusions
In this study, LED irradiation at 630 nm (37 mW/cm2 and 75 mW) at an energy density of 16 J/cm2 induced a proliferative response on SHED without affecting mitochondrial function or inducing senescence. Further studies could demonstrate that LED is a useful tool for the modulation of SHED for use in tissue engineering and regenerative medicine.
Footnotes
Acknowledgments
K.P.S.F. (CNPq—National Council for Technological and Scientific Development), Grant No. 311078/2015-0 and FAPESP (São Paulo Research Foundation) Grant No. 2013/07502-1. D.A.M. (CNPq), Grant No. 306124/2015-7. R.A.M.F. (CNPq), Grant No. 305739/2014-0 and FAPESP Grant No. 2014/12381-1, S.K.B. (CNPq), Grant No. 305905/2014-7.
Ethical Statement
All procedures performed in this study involving human participants were in accordance with the ethical standards of the institutional and national research committee and with the 1964 Helsinki Declaration and its later amendments or comparable ethical standards.
Author Disclosure Statement
No competing financial interests exist.