
Abstract
Introduction
L
Once cirrhosis develops, liver transplantation is the only effective therapy to avoid a fatal outcome. 1 Therefore, accurate staging of liver fibrosis is a crucial aspect to make a reliable prognosis and start the appropriate therapy for preventing disease progression. Although several noninvasive techniques such as imaging ultrasonography, elastography, and serum biomarkers have been developed and proposed, 5 –7 currently liver biopsy is still the gold-standard method to staging and grading the liver fibrosis. Nonetheless, biopsy drawbacks are well known; they include the procedure invasiveness, the sampling error, and the diagnosis underestimation due to intra- and interobserver variability. 8
For these reasons, the development of new complementary tools for the staging and grading of liver biopsy is of paramount importance to obtain an objective evaluation of the different fibrosis stages, which is, in turn, necessary to provide a more accurate diagnosis and to guide the appropriate therapy.
Recently, the interest in techniques based on the light interaction with biological material such as tissue has increased. These techniques have been called by several authors as optical biopsy or optical diagnosis. They use the light absorption and scattering to quantify the biochemical composition and morphological characteristics of tissue in a noninvasive or minimally invasive manner. 9,10 Some of these existing optical techniques lay on fluorescence. This is because fluorescence is produced by several endogenous fluorophores such as NAD(H), NAD, flavins, porphyrins, and collagen, among others. 11,12 The amount and distribution of these endogenous fluorophores could be modified by the genesis of pathological conditions producing a modification of their fluorescence emission, particularly in tumoral cells compared to normal cells.
Several studies in different tissues have been carried out to evaluate the feasibility of fluorescence spectroscopy. 13 –15 During the liver fibrosis development, the tissue suffers compositional and structural changes, which produce an alteration of the optical properties. The present study has been aimed to find if liver tissue samples of varying degrees of fibrosis show differences in fluorescence spectra, while studying the possibility of developing an analytical tool to complement liver biopsy diagnosis.
Materials and Methods
Paraffin-preserved human liver samples
The preserved liver tissue samples were provided by the Department of Pathology at the Post-Mortem Division of the General Hospital of Mexico and were evaluated after the written informed consent of the patients or their relatives were obtained. Patients who authorized the study of their paraffin-preserved hepatic samples were not subject to a different liver biopsy procedure. A review board of the hospital approved the study which guaranteed that it was conducted in accordance with the Helsinki Declaration principles.
Histological analysis
Once collected, the liver samples were perfused using 4% p-formaldehyde (J.T. Baker, Mexico) and then placed in 10% neutral buffered formalin (Leica Biosystems, Germany) for four days. Then, liver samples were washed twice with a phosphate-buffered saline (PBS) 1× solution (Sigma Aldrich, Mexico) and were progressively dehydrated using 80%, 95%, and 100% ethanol (J.T. Baker, Mexico) in separate incubations of 15 min each. Finally, tissue samples were placed into xylene (J.T. Baker, Mexico) for 30 min and, following an extra washing step using PBS 1 × solution, were embedded in 60 8C pure liquid paraffin. After 6 h solidification, each paraffin-embedded liver specimen was sequentially cross-sectioned obtaining six tissue slices of 4 μm each, using a manual microtome (Microtome Olympus Cut 4060).
The tissue slices were, following the manufacturer's instructions (Sigma-Aldrich, St. Louis, MO), one by one stained using the Masson's Trichrome stain. The stage of liver fibrosis was independently assessed by two senior experienced pathologists in a single-blind test, according to a semiquantitative score derived from the Metavir score, as previously reported: 16 F0 (no fibrosis), F1–F2 (early fibrosis), F3 (advanced fibrosis), and F4 (cirrhosis). Microphotographs were acquired at 40 × magnification using an optical microscope (Microphot-FXA; Nikon) coupled to a digital camera (DXM1200F; Nikon). The total collagen percentage was estimated for each liver specimen using MATLAB® 7.1 software by considering the total collagen-positive area divided by the total area of the liver tissue section on the microphotograph multiplied by 100.
Instrumentation
A portable fiber-optic setup was used to induce and acquire the fluorescence spectra from liver biopsies. The instrumentation includes: a UV-light source, a bifurcated fiber optic, a mini-spectrometer, and a portable computer. The setup is showed in the Fig. 1. As excitation light sources, LEDs operating at 330 nm (UVTOP330, SETi), 365 nm (NCSU033A(T), Nichia), and 405 nm (405-1WUE, Violed Int) at 3, 200, and 350 mW optical powers, respectively, were used. Delivery and collection of light were achieved through a bifurcated fiber-optic probe (QR400-UV-VIS, Ocean Optics), which is an optical fiber bundle with two branches, one contains a capture single fiber and the other contains six illumination fibers around the illumination one. All fibers have a 400 μm core diameter and a 0.22 NA.
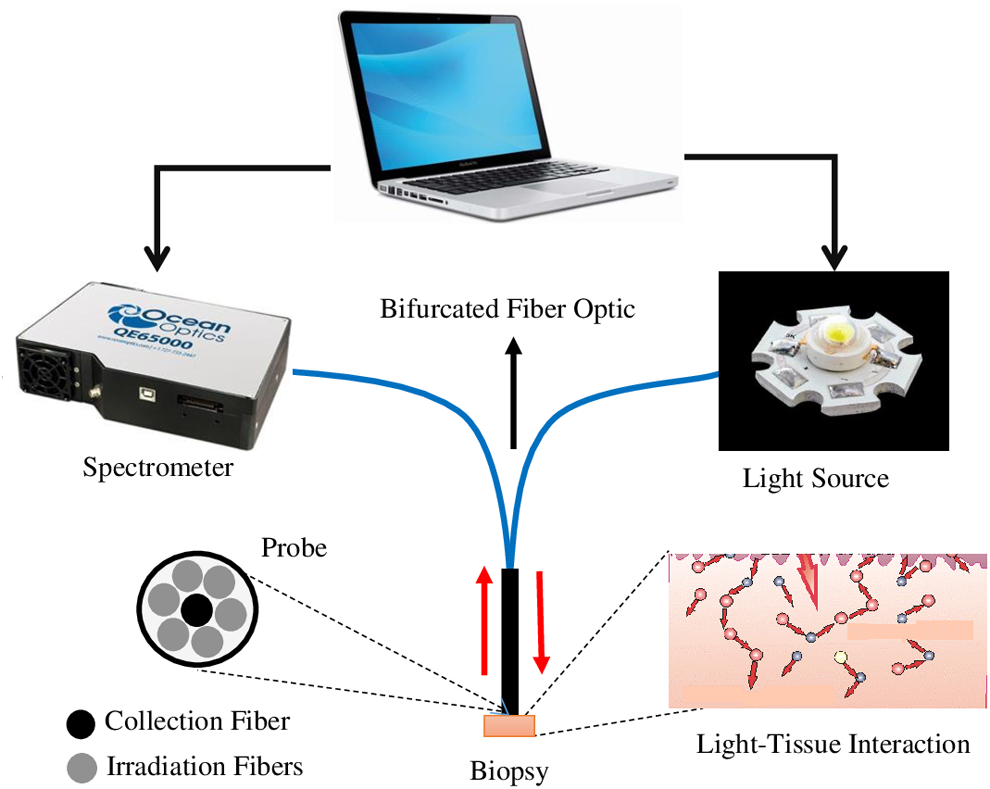
Schematic representation of the portable fiber-optic fluorescence system and geometry of the probe.
The collection fiber is coupled directly to the spectrometer (QE65000-ABS, Ocean Optics), which operates in UV-NIR region (200–950 nm). The spectrometer is equipped with a 10 μm slit at its entrance port, which yields a spectral resolution of 2 nm. Both the spectrometer and the light source are connected to the computer through a universal serial interface. A computer program was developed in National Instruments LabVIEW 2012 to control the entire spectral acquisition, as well as for dimming the intensity of the used light sources.
Measurements and preprocessing
In the present study 19 different preserved liver biopsies were used, 4 for F0, four for F1–F2, five for F3, and six for F4. Over the surface of each biopsy, fluorescence measurements (∼4–5) on each site of liver tissue (∼15–22 sites randomly selected) were taken by establishing surface contact between the optical probe and the preserved tissue without removing any tissue from the paraffin block. Before each set of measurements, the fiber-optic probe was cleaned in a saline water solution. All spectral measurements were acquired in a single-blind manner. During the measurements, the ambient light from the workroom was turned off, and the integration time of the spectrometer was set to 5 sec. The total time to acquire fluorescence spectra from a single investigated site was less than 1 min.
To avoid the effects induced by the paraffin, fluorescence measurements of paraffin were carried out using the three wavelengths mentioned above. These measurements reveal that only the 330-nm wavelength produces a weak fluorescence in the 400–450 nm region. Also, this paraffin spectrum was subtracted from all measurements carried out at 330 nm excitation wavelength to correct the spectra. In addition, a background spectrum was recorded with the probe placed on the preserved biopsy but without excitation light. Such spectrum was rested from all the measured fluorescence spectra. A fourth order Savitzky–Golay smoothing filter was in MATLAB 7.1 software implemented to eliminate the high frequency noise produced by the spectrometer.
Statistical analysis
After spectral preprocessing, four consecutive steps for statistical analysis on each spectroscopic data set, gathered from one liver-biopsy specimen at different excitation wavelengths, were undertaken to generate a discrimination algorithm. First, as we are interested in the spectral distribution of the collected light, all spectra were normalized at one arbitrary intensity, corresponding to a wavelength of 510 nm. This would eliminate the differences related to the irradiation geometry.
As a second step, a diagnostic information extraction using a multi-variate analysis named principal component analysis (PCA) is performed. Although PCA may not provide direct insight to the structural and biochemical basis of the fluorescence spectra, PCA provides a novel approach that recasts all the spectral information into few manageable components, which account for most of the variance of the original data set, with minimal information loss. 17 Further, each principal component could be easily related to the original emission spectrum, thus providing insight into diagnostically useful emission variables.
The third step consisted in the selection of the appropriate principal component scores (PCs), for which average values of the PCs were calculated for every principal component in each tissue category (in our study F0, F1–F2, F3, and F4). A two-tailed Student's t-test was used to determine the contribution of each principal component. In this case, the hypothesis evaluated was that the mean values of the PCs of two diagnostic categories are different for: (1) F0 and F1–F2, (2) F1–F2 and F3, (3) F3 and F4, as well as F1–F2 and F4. PCs with statistical differences, taken as Student's t-test p-values p < 0.05, were included in a linear discrimination analysis (LDA).
A LDA was performed to generate a discriminant function based on the linear combination of the predictor variables that provide the best discrimination between different groups. 18 There are several methods for classification. Further, a diagnostic algorithm was developed using the discriminant functions with a leave-one-out method of cross-validation. Diagnostic accuracies were determined from the discriminant function scatter plot.
Finally, receiver operating characteristic (ROC) curves were also constructed using the discriminant function scores to assess the potential of fluorescence spectral data to differentiate: (1) F0 and F1–F2, (2) F1–F2 and F3, (3) F3 and F4, as well as (4) F1–F2 and F4. The area under the ROC curves (AUC) for each case was computed. The whole statistical analysis was conducted using MATLAB 7.1 software. In Fig. 2, the complete processing data are summarized by means of a flow diagram. In addition, in the Appendix 1 of this issue, a MATLAB source code of the processing carried out is shown.
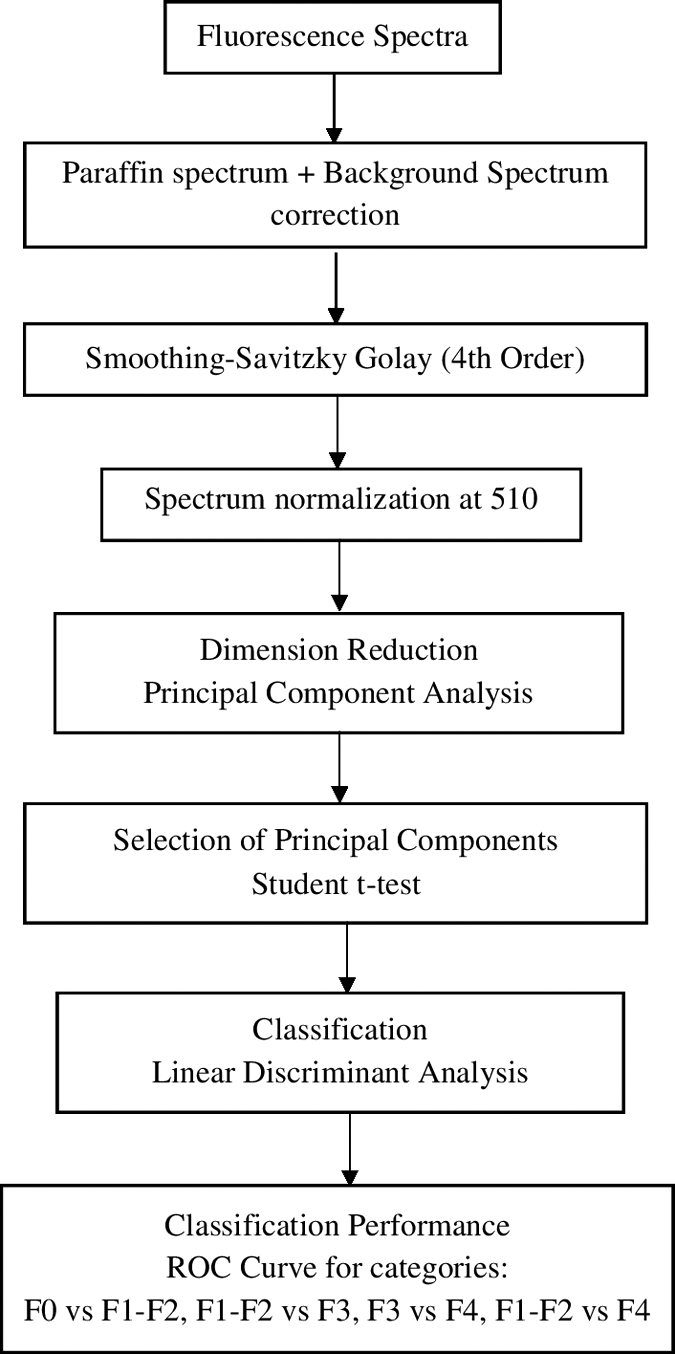
Flow chart showing the sequence of spectra processing used for classification.
Results
Histological evaluation
The nineteen paraffin-preserved biopsies included in our study were collected between 2011 and 2012. Four of these biopsies did not show any histological evidence of fibrosis and were classified as F0 (Fig. 3A). Four specimens showed an early development of fibrosis (F1–F2), characterized by scant formation of portal fibrous septa (Fig. 3B). Five hepatic tissue samples showed an advanced degree of fibrosis, denoted by the presence of numerous fibrous septa but the absence of regenerative nodule formation (Fig. 3C), and were classified as F3. Six specimens showed severe stage of liver fibrosis, characterized by the presence of multiple fibrous septa around regenerative nodules, an exclusive histological attribute of cirrhosis (F4) (Fig. 3D).
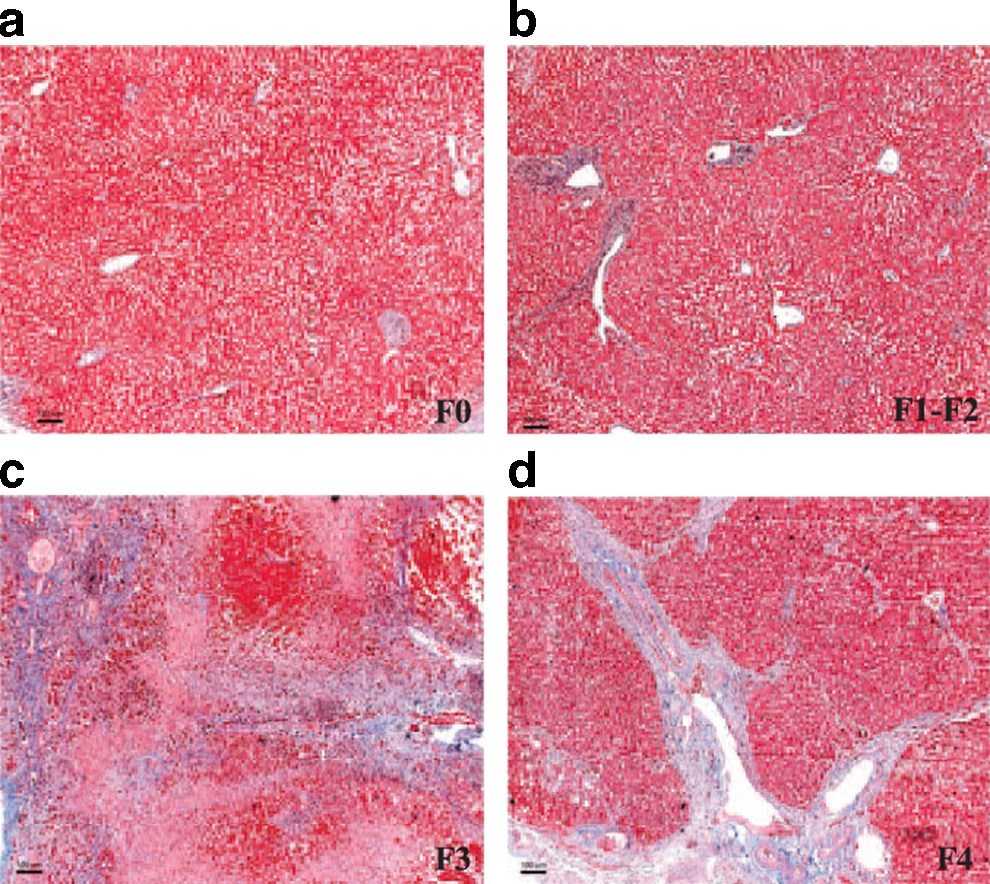
Histological grading of liver fibrosis. Two experienced pathologists assessed the stage of liver fibrosis in a single-blind test, according to a semiquantitative score derived from the Metavir score. The micrographs correspond to:
As it is shown in Table 1 most of the cases examined are related to harmful consumption of alcohol, hepatitis C virus, or nonalcoholic fatty liver disease.
Data are expressed as mean ± standard deviation.
ALD, alcoholic liver disease; F0, no fibrosis; F1–F2, initial fibrosis; F3, advanced fibrosis; F4, cirrhosis; HCV, hepatitis C virus; M, men; NAFLD, nonalcoholic fatty liver disease; W, women.
In terms of collagen-positive area, the F0 group showed a 4.86% ± 1.85% of collagen-positive area, the F1–F2 group showed a 7.64% ± 2.63% (Fig. 3). Nevertheless, in the F3 and F4 groups the percentage of collagen-positive area increased by approximately fivefold compared to F0 hepatic samples: 31.79% ± 8.74% and 29.84% ± 12.58%, respectively (Fig. 3). It is worth mentioning that in terms of percentage of collagen-positive area, no significant differences are observed between F0 and F1–F2 or between F3 and F4 groups (Fig. 3).
Spectral characteristics
The acquired fluorescence spectra using excitation wavelengths of 330, 365, and 405 nm, averaged for all the specimens in each group, are shown in Fig. 4A–C, respectively. It can be noticed that the shape of the spectra is different for each degree of liver fibrosis. As it can be seen in Fig. 4A, under excitation wavelength of 330 nm, fluorescence spectra were recorded in the range from 400 to 900 nm. Fluorescence spectra in F0 samples show a main emission band around 510 nm, whereas in F1–F2 livers, two broad peaks are observed around 510 and 690 nm, as well as a weak shoulder peak about 610 nm. For F3 liver samples, three peaks of fluorescence around 490, 620, and 680 nm are observed. In F4 livers, the fluorescence spectra show a broad band peak around 525 nm, as well as two weak peaks at ∼680 and 750 nm.
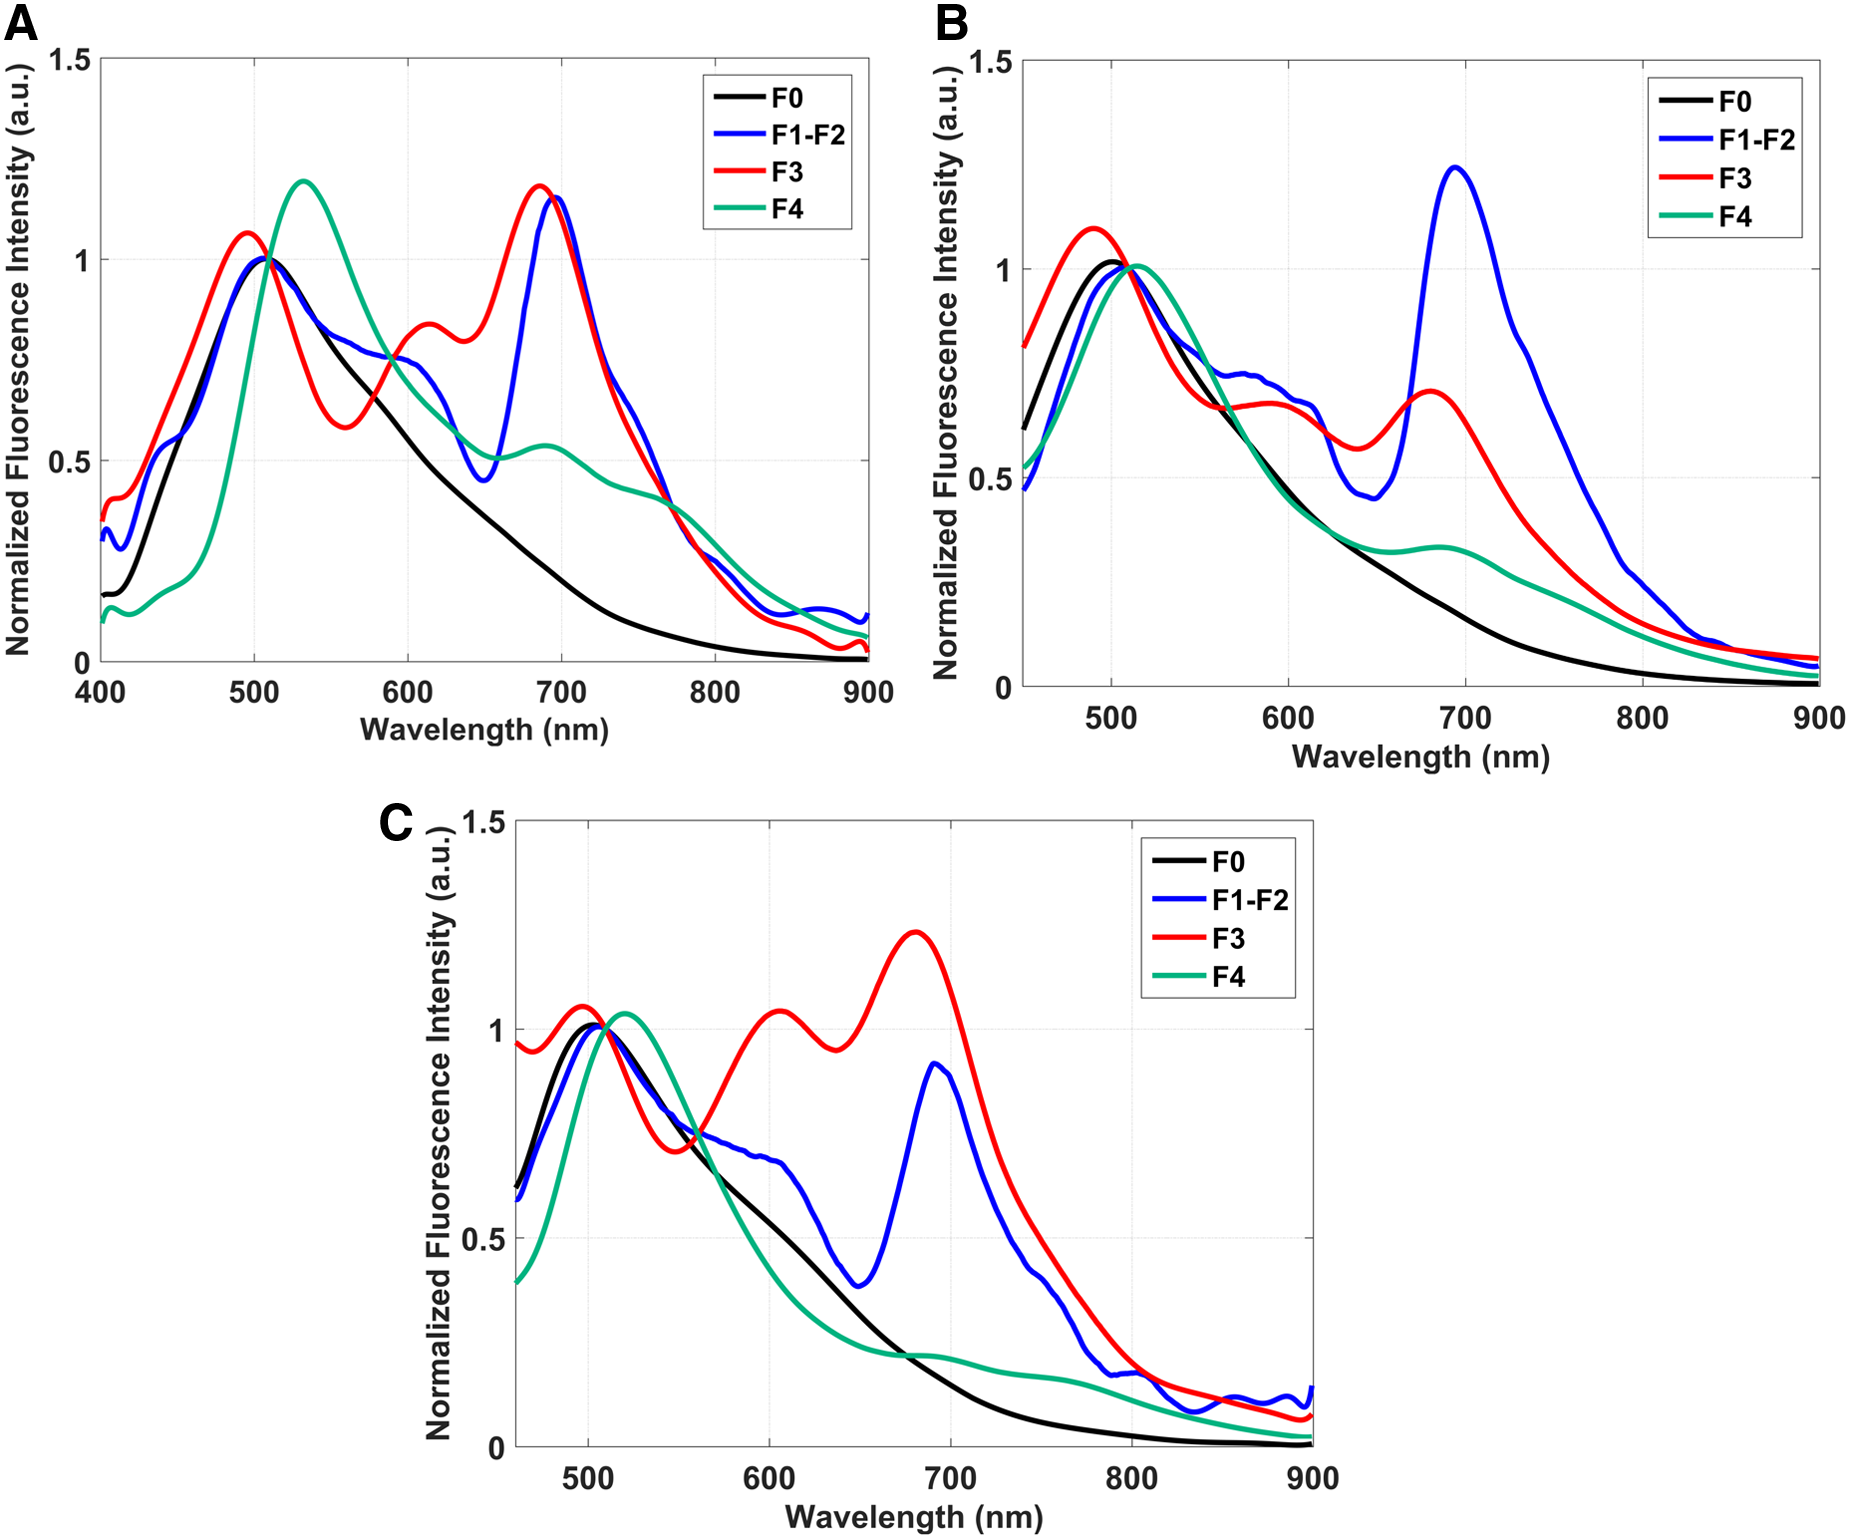
Average fluorescence emission spectra acquired at
Using 365 nm as excitation wavelength, fluorescence spectra were recorded in the range of 450–900 nm (Fig. 4B). F0 livers show only one peak around 510 nm, whereas F1–F2 livers display two strong fluorescence peaks at 510 and 680 nm, as well as a weak shoulder about 600 nm. In F3 liver tissues, three fluorescence peaks are observed: two prominent ones around 490 and 680 nm, as well as a small peak at 590 nm. Fluorescence in F4 liver tissue shows a main emission band with a maximum at about 525 nm and a weak fluorescence peak around 680 nm. Using 405 nm as excitation wavelength (Fig. 4C), F0 liver tissues show a clear fluorescence with a principal peak around 510 nm.
Fluorescence spectra in F1–F2 livers show two principal peaks around 510 and 680 nm and a shoulder at 620 nm. In the case of F3 livers, fluorescence spectra have three prominent peaks at 490, 620, and 680 nm, respectively. On their part, F4 livers show fluorescence with a maximum around 525 nm; and two very weak peaks are observed at 680 and 750 nm.
Principal component analysis–linear discriminant analysis
Figure 5 shows the scatter plots of discriminant scores together with the ROC curves when the following paired cases were tested: F0 and F1–F2, F1–F2 and F3, F3 and F4, as well as F1–F2 and F4. In the left-hand column of the figure, the horizontal dashed lines indicate the optimal threshold for discrimination between principal component groups. When excitation wavelength of 330 nm was used, five principal components which accounted for 99% of the total information (variance) of the original spectra were obtained. In this case, PC1 gave 70% of variance, PC2 gave 21%, PC3 5%, PC4 2%, and PC5 yielded 1%). Only three principal components (PC1, PC2, and PC3) showed statistical differences (p < 0.05) and hence were considered for linear discriminant analysis (Fig. 5A).
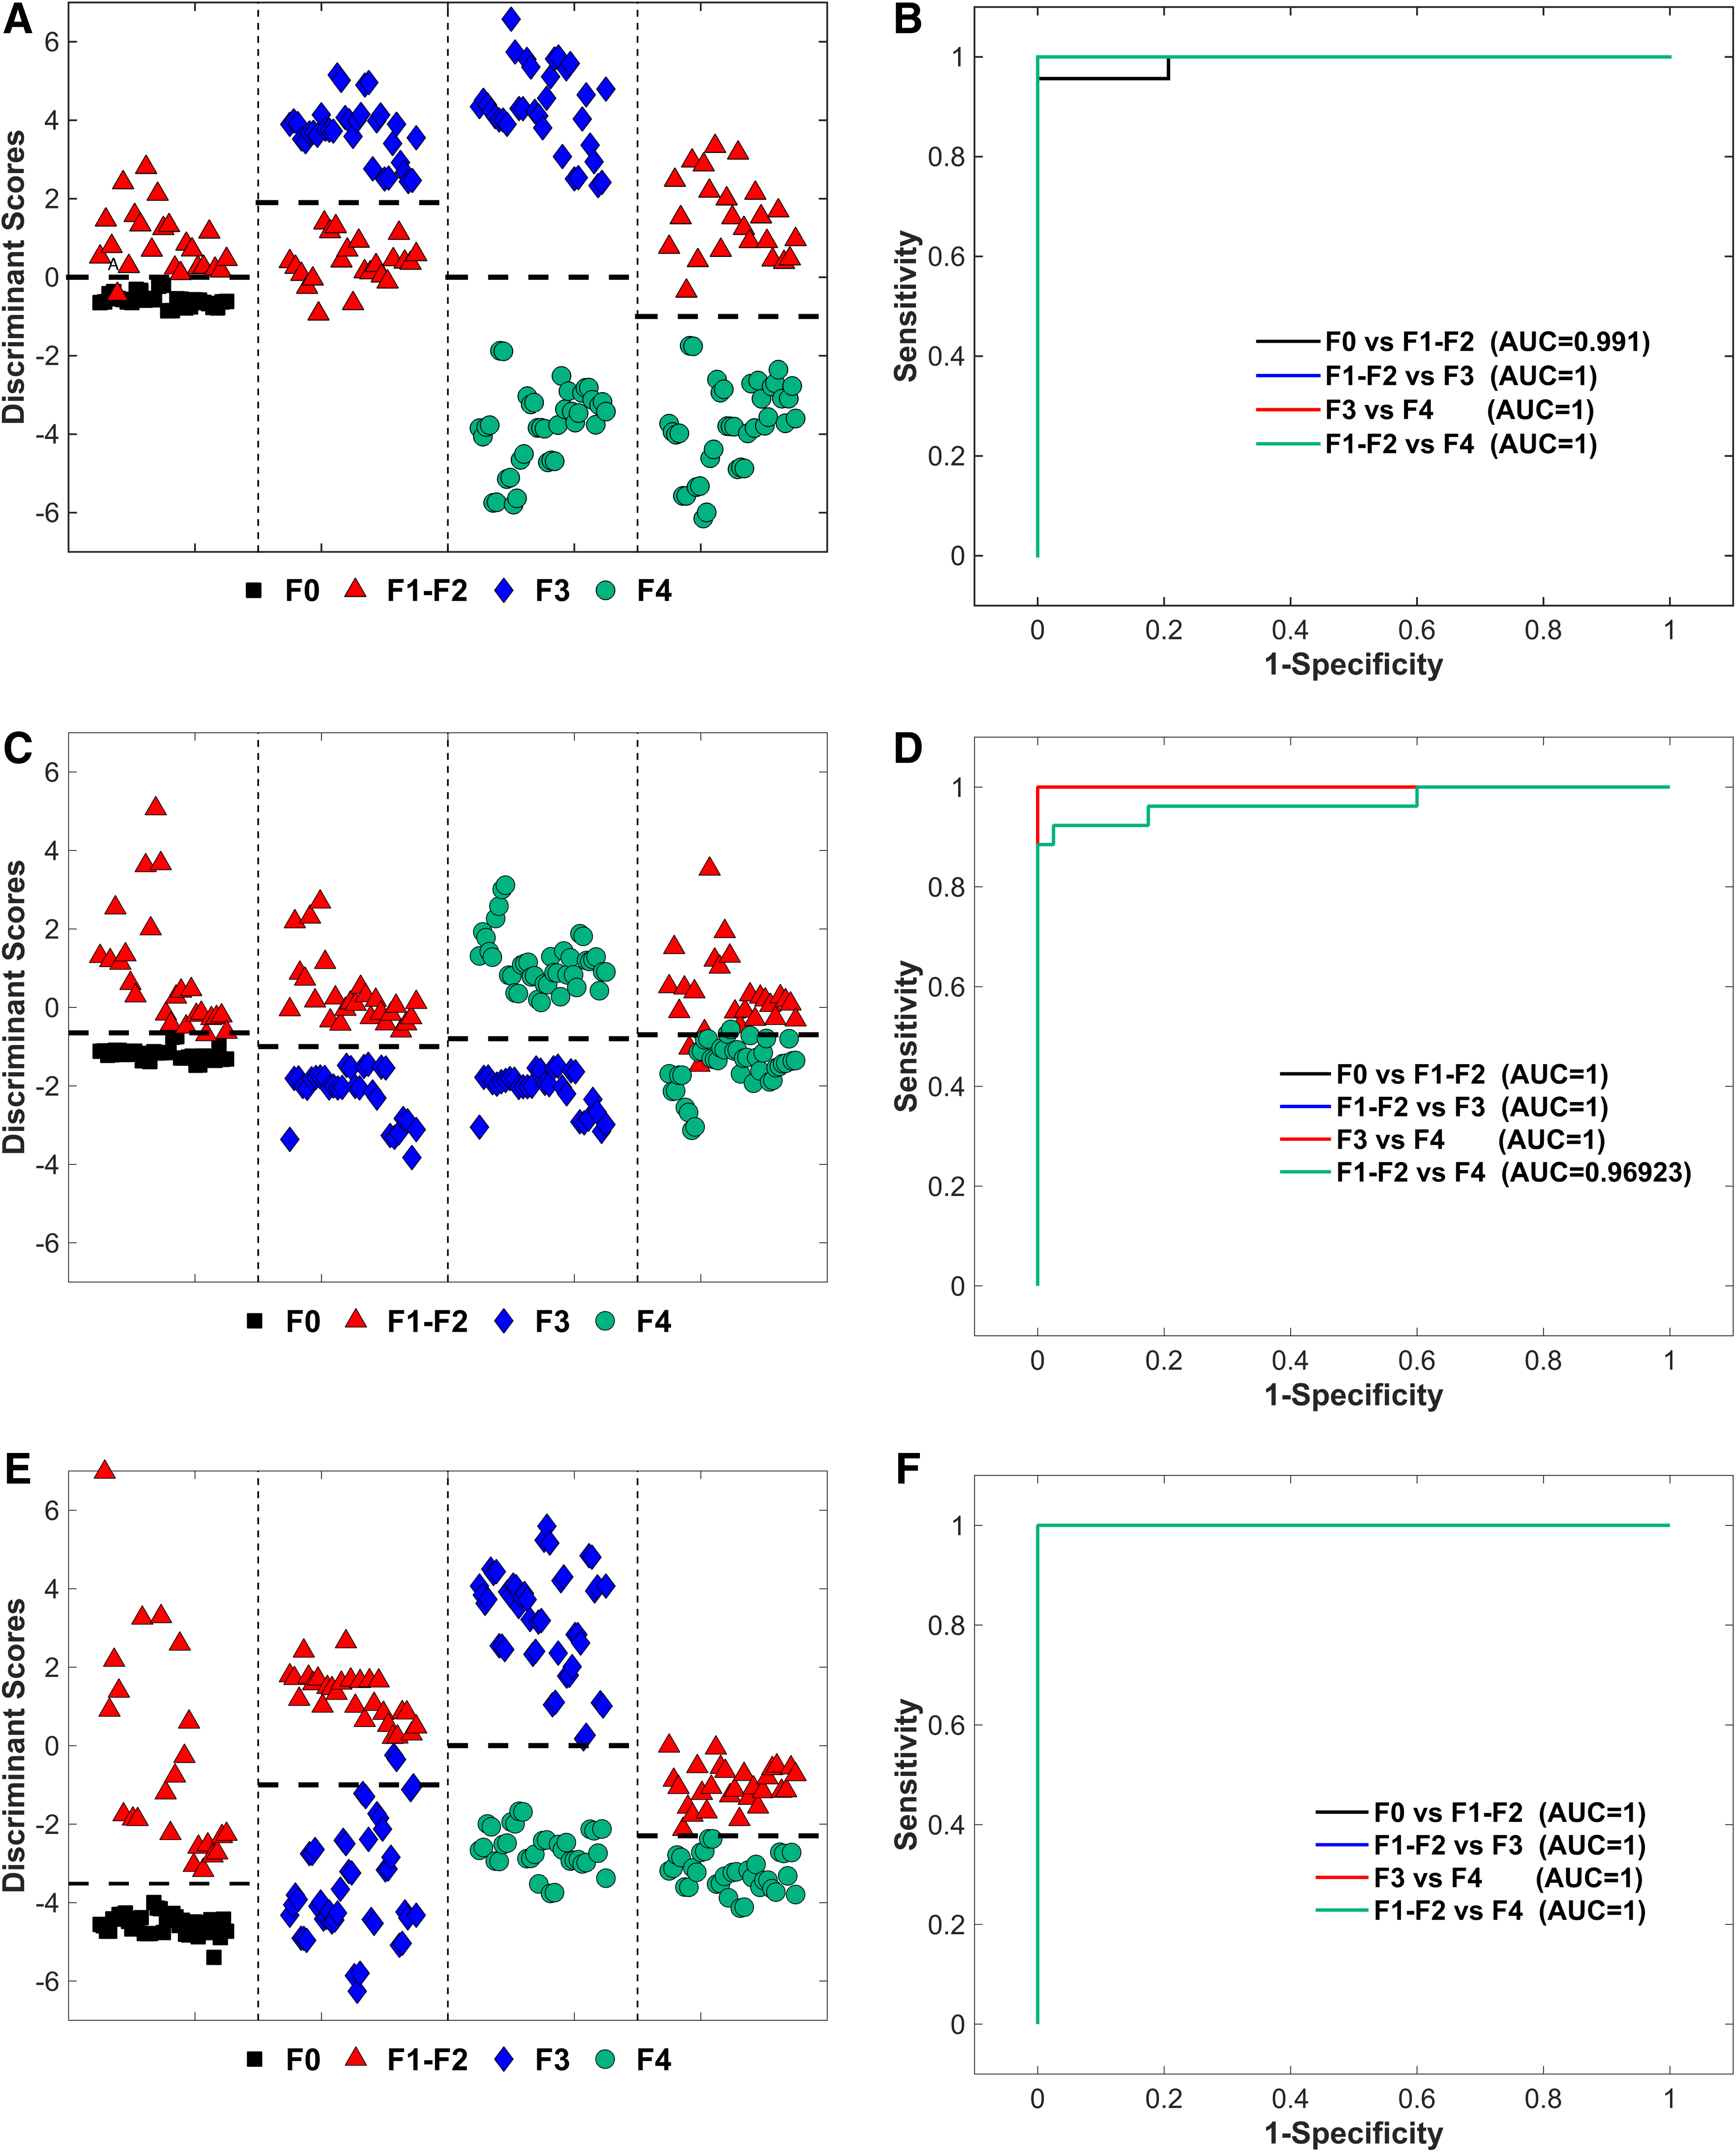
Discriminant function scatter plots obtained after applying principal component analysis and linear discrimination analysis to fluorescence spectra data sets. Excitation wavelengths:
As it is shown, F0 and F1–F2 were clearly differentiated when the threshold line was fixed at 0, obtaining a sensitivity and a specificity of 95% and 96%, respectively. The AUC was equal to 0.991, as seen in Fig. 5B. In the pairs F1–F2 versus F3, F3 versus F4, and F1–F2 versus F4, a sensitivity and specificity of 100% were obtained when threshold lines were fixed to 3.6, 0, and −1 (AUC equals 1, Fig. 5B).
Using 365 nm as excitation wavelength, four PCs that accounted for 99% of the total information (variance) of the original spectra were obtained (PC1 gave 90% of variance, PC2 6%, PC3 2%, and PC4 1%). In this case, only two principal components (PC1 and PC2) showed statistical difference (p < 0.05) and were considered for linear discriminant analysis.
Figure 5C shows the scatter plots of discriminant scores for all the tested cases. As it is shown in this figure, for F0 and F1–F2, F1–F2 and F3, as well as F3 and F4, all the groups were clearly differentiated when threshold discrimination lines were fixed to −0.65, −1, and −0.8, respectively, obtaining sensitivity and specificity values of 100% with an AUC of 1 (Fig. 5D). However, in the case of F1–F2 versus F4, the obtained values of sensitivity and specificity were equal to 92% and 97.5%, respectively, when the threshold line was fixed to −0.7 (AUC equals 0.92, Fig. 5D).
The analysis carried out on fluorescence spectra acquired at 405 nm excitation wavelength showed that only four PCs accounted for 99% of the total information. In this case, PC1 provides 88% of variance, PC2 8%, PC3 2%, and PC4 1%. Statistical differences (p < 0.05) were obtained only for principal components PC1, PC2, and PC3, which were included in the LDA. With 405 nm excitation wavelength, all cases tested showed a sensitivity and specificity of 100% when the discrimination thresholds lines were fixed at −0.65, −1, 0, and −2.3 for F0 and F1–F2, F1–F2 and F3, F3 and F4, F1–F2 and F4, respectively (Fig. 5E). In all cases, the AUC was equal to 1 (Fig. 5F).
Discussion
In this article, the results of the application of fluorescence spectroscopy in the assessment of paraffin preserved biopsy tissue from human liver exhibiting several degrees of liver fibrosis are presented. In the study, a multi-variate analysis is used as the main tool for the analysis of data and to develop discrimination algorithms.
To make sure that all biopsies were correctly classified, all samples were independently evaluated by means of histological assessment performed by two highly experienced pathologists with a broad experience in the field, who independently determined the degree of fibrosis of the biopsy specimens. In this way, the samples were grouped in four classes: absence of liver fibrosis (F0), early stage of the disease (F1–F2), advanced fibrosis (F3), and cirrhosis (F4). It is worth mentioning that interobserver agreement between the two pathologists was quite high (kappa index = 0.87, data not shown), but significantly decreased when a less experienced pathologist evaluated the same liver specimens (kappa index = 0.52, data not shown).
Given that the experience level of a pathologist produces such variability in scoring liver fibrosis, 19 the importance of developing tools that might help the specialist making accurate liver biopsy diagnosis becomes evident. Concerning this point, our results show that the progressive increase in hepatic deposition of fibrillar proteins is consistent with important changes in the liver tissue fluorescence spectral, a feature that could help to develop a tool for the accurate grading of liver fibrosis.
Spectroscopic studies of liver tissue with different fibrosis stages have been reported during the past few years. Nazeer et al., in an animal model study, reported specificities and sensitivities higher than 90% and 85%, respectively, in the differentiation between normal, fibrotic, and cirrhotic liver tissue when using excitation light of 380 nm and applying multi-variate analysis techniques to the gathered data. 20 Sauvage et al. demonstrated that fluorescence induced at 375 and 405 nm could be used for differentiation between healthy tissue and tissue showing steatosis and steatohepatitis with high sensitivities and specificities. 21
Recently, studies carried out by Westerkamp et al. in an animal model 22 and Evers et al. in patients, 23 both with hepatic steatosis, show that there is a strong correlation between diffuse reflectance spectra and histological analysis, demonstrating that diffuse reflectance spectroscopy can be used as a tool to quantify hepatic steatosis. Nilsson et al. 24 show that liver parenchyma can be distinguished from liver tumor with high certainty using diffuse reflectance spectroscopy.
However, a few studies have been carried out on the analysis of the different stages of liver fibrosis by means of optical spectroscopy. Zhan et al. 25 conducted a study in an animal model in which the serum fluorescence, excited at 337 nm, was analyzed to find a correlation between the degree of liver fibrosis and the fluorescence features. Although these authors achieved good results in differentiating advanced stages of fibrosis, tissue with initial fibrosis is not correctly differentiated from healthy liver tissue from the control animals.
In previous studies, our research group has shown that the combined use of fluorescence and diffuse reflectance spectroscopies can render an adequate tool for the differentiation of fibrotic liver from normal liver tissue in an animal model, obtaining sensitivities and specificities greater than 80%. 26
In the present investigation, we applied fluorescence spectroscopy using excitation wavelengths of 365, 385, and 405 nm to find clear differences in the spectra from specimens with different stages of liver fibrosis. In all cases, several fluorescence peaks were observed, which can be linked to the presence of several fluorophores in the studied samples. This is in agreement with Croce et al., who have extensively documented the fluorescence properties of liver tissue. 11,27 The F0 livers show, for all excitation wavelengths, only one peak near the wavelength interval from 490 to 510 nm. This peak is produced by proteins and coenzymes such as collagen, NAD(P)H, elastin, as well as vitamin A. However, in F1–F2 and in F3 liver spectra, additional to the 490–510 nm peak, the contribution of porphyrins was found around 600–620 nm and 680–700 nm.
Such contribution was larger in the case of F3 liver specimens than in the F1–F2 ones. In contrast with F0, F1–F2, and F3, the F4 liver spectra showed a green shift in the main 490–510 nm peak, which could be observed around 525 nm (Fig. 4). It is well known that during the liver fibrosis process a deposition of extracellular matrix proteins, principally collagen, occurs. 28 This fibrous protein is characterized by a fluorescence emission in the range of 400–410 nm. 11 However, in our measurements no information of this fibrous protein could be clearly detected, this effect could be attributed to the presence of other fluorophores that have emissions in the same region, which could be hiding the collagen contribution.
Although it is not obvious the correlation between the contribution of each fluorophore according to the stage of the liver fibrosis, the characteristics of the spectra were sufficient to differentiate the specimens with different degrees of fibrosis. However, it would be necessary to perform another study to analyze the changes that take place in the specimen fluorescence spectra from the moment when the biopsy is taken and during the procedure until the tissue is fixed in the paraffin.
The results reached with multi-variate statistical analysis based on PCA followed by LDA, which incorporate the complete fluorescence data set, produce a robust and organic method for differentiation between the different stages of liver fibrosis, with specificities and sensitivities higher than 90% and 95%, respectively. As it has been reported in several studies, the application of multi-variate techniques on the complete fluorescence data enhances the sensibility and specificities in contrast with the case when these techniques are applied to only some points of the spectra. 29,30
The use of paraffin-preserved tissues could significantly reduce sampling error during spectroscopic assessment of the liver and other soft tissues, which in general are sensible to probe pressure; also, it can facilitate the use of fluorescence spectroscopy-based methods in clinical practice.
Conclusions
The application of fluorescence spectroscopy for the analysis of human liver tissue with several stages of fibrosis was tested with successful results when using multi-variate statistical analysis. To our knowledge, this is the first study describing distinct fluorescence spectra for each stage of liver fibrosis in humans (F0, F1–F2, F3, and F4). Fluorescence spectroscopy is characterized by its low cost, portable instrumentation, and minimal invasiveness, which can be used as a complementary tool for the analysis of paraffin-preserved hepatic tissue. Moreover, the application of fluorescence spectroscopy could be extended for studies in vivo in patients.
Footnotes
Acknowledgments
The authors are grateful for the financial support provided by grant no. FOSISS 261569 from CONACYT-Mexico to J.M.d.l.R.V. The comments of the reviewers are greatly appreciated.
Author Disclosure Statement
No competing financial interests exist.