
Abstract
Introduction
M
In recent years, a wide range of lasers has been introduced into endodontic treatment for its bactericidal effect, such as the Er:YAG laser, 5 Er,Cr:YSGG laser, 6,7 Nd:YAG laser, 8 diode laser, 9 and aPDT. 10 It has been documented that they can directly or indirectly kill bacteria, but little is known about the comparative evaluation of these lasers for their antibacterial efficacy in dentinal tubules. Moreover, most such studies have used cultural methods to make Enterococcus faecalis invade the dentinal tubules, but using cultural methods could not obtain a comparable heavy presence of E. faecalis biofilms in all dentin samples. 11 Although the samples were cultured for a prolonged time, the invasion of the bacteria could be seen in a few dentinal tubules. After using laser treatment, most studies have adopted histological sections, 12 –14 scanning electron microscopy (SEM) 15 and fluorescence microscopy 16,17 to visualize, detect, and identify E. faecalis in vitro, but none of the above methods could intuitively identify the live and dead bacteria. 18 Nevertheless, using a confocal laser scanning microscopy (CLSM) method could achieve the aforementioned aim. 19 Almost no studies have indirectly used a CLSM method to assess the bactericidal effect after laser treatment.
Therefore, the goal of the present study was to quantitatively evaluate the effectiveness of several laser irradiation systems on E. faecalis biofilms in dentinal tubules using CLSM.
Materials and Methods
Dentin sample preparation
Seventy single-rooted teeth free of dental caries that had been extracted for orthodontic reasons were collected under a protocol approved by the local Ethics Committee of the university (IRB-REV-2016051). A cylindrical root dentin block was horizontally sectioned from each tooth at 1 mm below the cementoenamel junction using a 0.2-mm-thick precision diamond saw (Struers, Ballerup, Denmark) at 900 rpm with water cooling to obtain a uniform length of 4 mm. The blocks were prepared to an external diameter of 4 mm using high-speed diamond burs (Brasseler, Savannah, GA). 20 The root canals inside the blocks were enlarged to 1.5 mm in diameter with a Gates Glidden drill #6 (Tulsa Dentsply, Tulsa, OK) at 350 rpm with water cooling. A thin groove was made in the middle of the cylindrical specimen with high-speed diamond burs (Brasseler), and each dentin block was fractured with a blade and a hammer into two semicylindrical halves. Then, we obtained 140 total 4 × 4 × 2 mm (4 mm high, with a diameter of 4 mm and a thickness of 2 mm) uniform specimens.
The samples were rinsed with 5.25% NaOCl (Sigma-Aldrich) and 17% ethylene diamine tetraacetic acid (EDTA) for 4 min in an ultrasonic bath (Sankei Giken Industry Co Ltd., MIE, Tokyo, Japan) to remove the smear layer and were then immersed in sterile water for 10 min to remove the remnants. All specimens were sterilized by autoclaving (121°C, 15 min) in deionized water, and five randomly selected samples were subjected to SEM to confirm the removal of smear layer on the surface. Then, another five samples were randomly selected and incubated in brain heart infusion (BHI) at 37°C for 24 h to ensure that there was no bacterial contamination. Subsequently, the remaining prepared dentin specimens were fixed on the bottom of 5 mL microtubes (Eppendorf, Hamburg, Germany) with the internal surface sides up with a flowable composite resin (Kerr Corporation, Orange, CA), and the specimens were light cured for 20 sec.
Dentin contamination
After thawing, E. faecalis (ATCC 29212) was streaked onto a BHI (Difco, Detroit, MI) agar plate and incubated anaerobically at 37°C for 24 h. Single colonies were inoculated on BHI broth and standardized spectrophotometrically to reach the turbidity of the McFarland 0.5 scale [3 × 10 8 colony-forming units (CFU)/mL]. Then, they were diluted 10-fold to 3 × 10 7 CFU/mL. Following a protocol described in detail by Ma et al., 19 500 μL of E. faecalis suspension in BHI broth was added to each tube that contained a dentin specimen. The tubes were centrifuged twice each for 5 min in sequence at 1400, 2000, 3600, and 5600 g. The upper solution was discarded. Five hundred microliters of a fresh solution of bacteria was added between every centrifugation. After centrifugation, the upper solution was discarded, and all specimens were incubated with 4 mL of new E. faecalis suspension (∼107 CFU/mL) in the original microtubes at 37°C under anaerobic conditions for 3 weeks. The BHI medium (4 mL), which contained 1% sucrose, was refreshed every 2 days. Then, four samples were randomly selected and examined by SEM to ensure the presence of E. faecalis, and another five samples were stained using a LIVE/DEAD® bacterial viability stain and examined by CLSM.
Grouping and treatments
Before irradiation, the specimens were mounted parallel to the tooth on the long axis, and the external surface was fixed in the wall of the 1.5 mL sterile microtubes with a flowable composite resin (Gradia, GC). The top end of the samples was in line with the 1 mL scale line (Fig. 1). The remaining specimens were divided randomly into 6 groups (n = 20, each group includes 2 processing time and each time includes 10 specimens) as follows: (A) The positive control: 5.25% NaOCl, 20 specimens were immersed in 1 mL of 5.25% NaOCl and left for 1 and 3 min, respectively. (B) Nd:YAG laser, the laser emitted a wavelength of 1064 nm and was activated at 100 mJ, 15 Hz, and 1.5 W. The 200 μm endodontic fiber tip was placed in noncontact mode (the distance at between the optical fiber and the irradiated surface was 1 mm) and at 10° to the dentinal surface 21 to simulate a clinical situation of spiral movement with the laser activated for 4 sec. This procedure was repeated 15 times with a 15-sec interval, and the same method was used to achieve a cumulative time of 3 min (C) diode laser (Sirona), it emitted a wavelength of 980 nm, and it worked at 100 mJ, 15 Hz, and 1.5 W. The laser was activated by blue occluding paper; the protocol (the operating mode and time) was identical to that of the second group. (D) Nd:YAP laser, the Nd:YAP laser (LOKKI, Dt2, France) emitted a wavelength of 1340 nm, and it was activated at 300 mJ, 10 Hz, 3 W, and a pulse duration of 150 μs. The 200-μm-diameter fiber tip was pulled out parallel to the dentin canal and placed back into the microtubes (Eppendorf, Hamburg, Germany) at a speed of 1 mm/sec, for 15 cycles in total, with a 15-sec interval. The cumulative time was 1 or 3 min. (E) Er,Cr:YSGG + NaOCl: 10 samples were treated with 5.25% NaOCl (5 mL) for 1 min by activation with the Er,Cr:YSGG laser (Waterlase; Biolase, San Clemente, CA). It emitted a wavelength of 2780 nm and was activated at 37.5 mJ, 20 Hz, 0.75 W, and 5% air, with a pulse duration of 60 μs and with the water spray of the laser closed. The RFT3 (diameter = 415 μm, 17 mm in length), which had a conical fiber tip, was used. The fiber tip was pulled out parallel to the root canal wall and returned to the orifice at a speed of 1 mm/sec, for 15 cycles in total, with a 15-sec interval. In the 3-min group, the cumulative time was 3 min. (F) Er:YAG + NaOCl: 10 specimens were individually treated with 5.25% NaOCl (5 mL) activated for 1 min by the Er:YAG laser (Fotona M021-3AF/3, Ljubljana, SLOVENIA). The Er:YAG laser emitted a wavelength of 2940 nm, and it was activated at 20 mJ, 15 Hz, 0.3 W, and the super-short pulse mode with 50 μs. A photon-induced photoacoustic streaming tip (9 mm in length, Fotona) with a diameter of 600 μm was used, and the fiber tip was immersed 1 mm below the irrigation and activated for 20 sec with a 15-sec interval. The cumulative time was 1 and 3 min. For groups E and F, 1 mL of 5.25% NaOCl was previously added to the sterile microtubes. And the groups are detailed in Table 1.
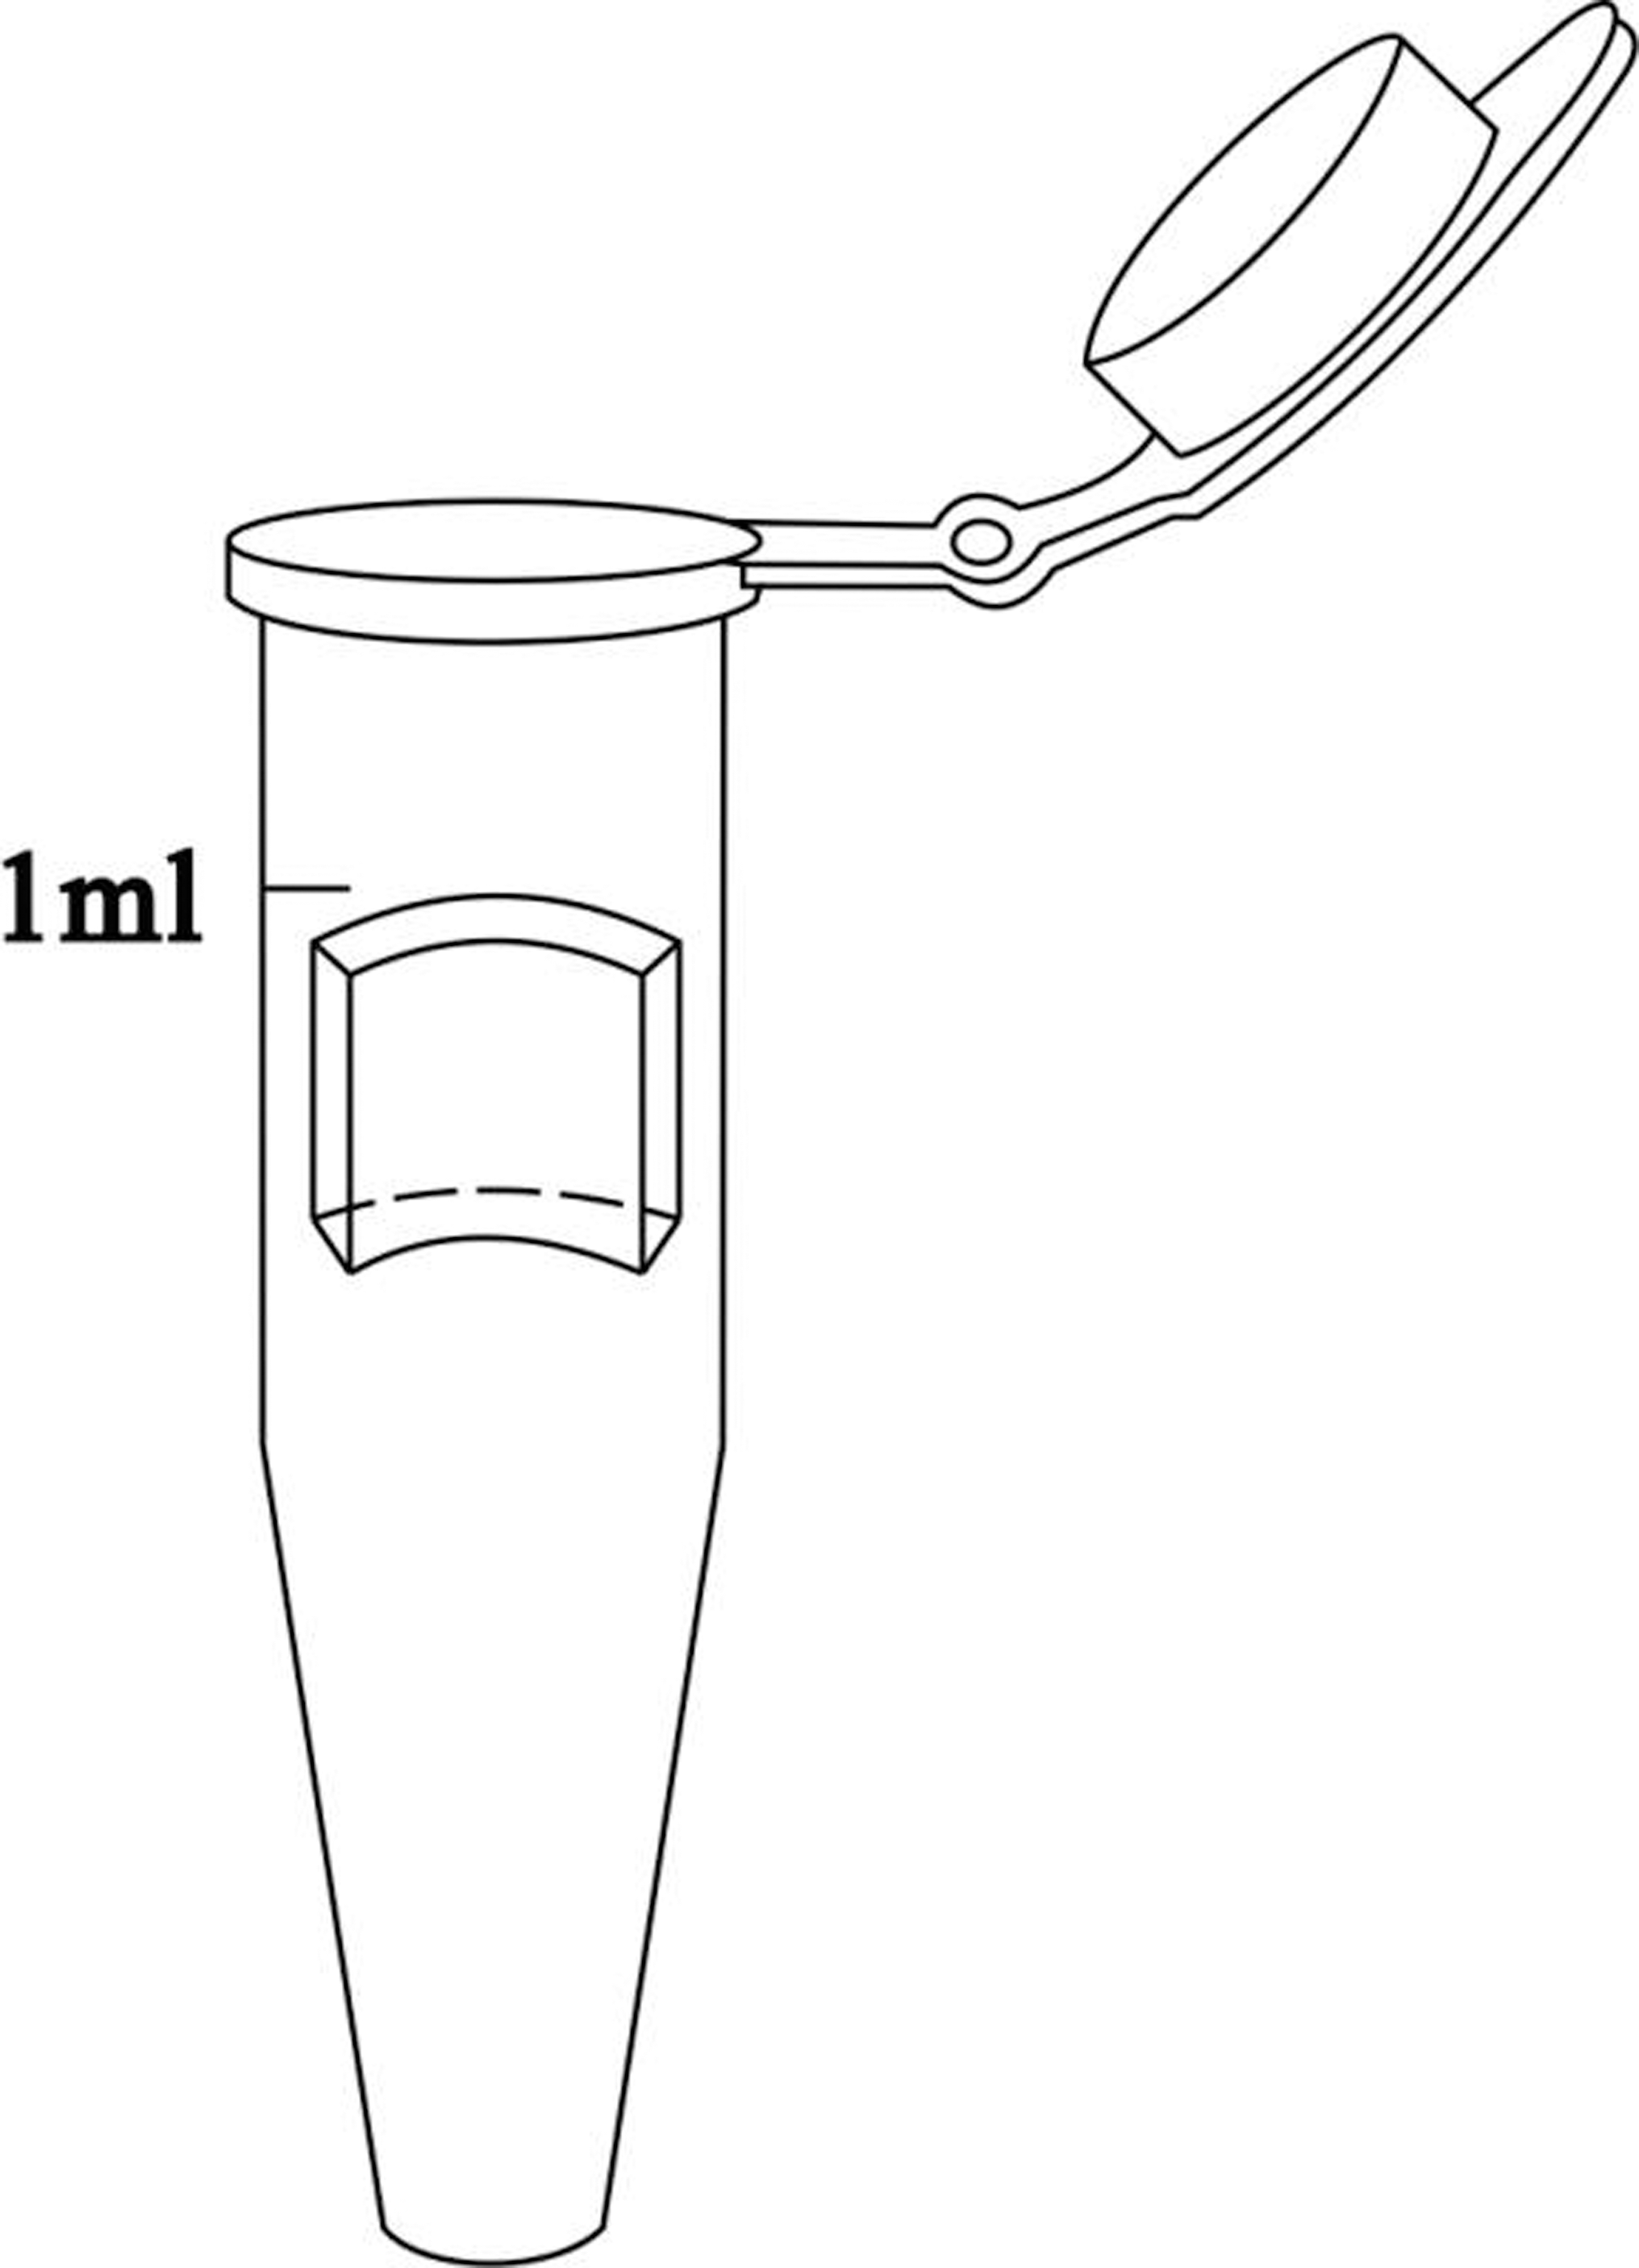
Schematic drawings of sample preparation.
H, pulse mode; PF, pulse frequency mode; PIPS, photon-induced photoacoustic streaming; RFT, radial fining tip; SSP, super-short pulse.
SEM examination
Four randomly selected specimens were prepared to observe the dentin canals in both the cross-sectioned and longitudinally sectioned specimens. Then, they were washed three times with phosphate-buffered saline and stored in 2.5% glutaraldehyde overnight. Subsequently, they were dehydrated with ascending concentrations of ethyl alcohol (30%, 50%, 70%, 80%, 90%, and 100% twice for 10 min each) and dried in a desiccator for 24 h. Finally, all specimens were sputter-coated with platinum and observed by SEM (S-4800, Hitachi, Japan). The presence of bacteria in the dentinal tubules was observed at a magnification of 5000 × , 10,000 × , and 50,000 × . One microscopic field was selected every 0.5 mm, starting from one side of the specimen (n = 2, 4 mm length), making 16 fields in the cross section and 16 fields in the longitudinal section.
CLSM examination
Each of the remaining specimens was split using clamps into two semi cylindrical halves. Then, they were rinsed with phosphate-buffered saline three times and stained with a LIVE/DEAD BacLight™ Bacterial Viability Kit (L-13152, Molecular Probes; Invitrogen, Inc., Carlsbad, CA) for 15 min, following the manufacturer's instruction. The kit includes SYTO 9 green-fluorescent nucleic acid stain and propidium iodide (PI) red-fluorescent stain. Bacteria with intact cell membranes are stained with fluorescent green, whereas bacteria with damaged membranes are stained with fluorescent red. The excitation/emission maximum for the dyes are ∼480/500 nm for SYTO 9 and 490/635 nm for PI. Ten additional semicylindrical-infected specimens were stained using the same protocol and used as negative control.
A total of 130 dentin specimens were rinsed with distilled water for 1 min and observed with a CLSM (FluoView 1000, OLYMPUS, Japan). A stack of 20 slices (0.3-μm step size) were scanned over 6 areas (630 × 630 μm for each area) on each sample. The CLSM images were acquired at a resolution of 1024 × 1024 pixels. The thresholds of the red and green fluorescence signals were manually set according to the initial intensity of the confocal files. The fluorescence images were integrated, and the FV10-ASW 3.1 Viewer software was used to calculate the dead cell volume, according to a previously published protocol. 19 In brief, the volume ratio of red fluorescence to green and red fluorescence indicated the proportion of killed cells. Also, the depth of penetration of the dead E. faecalis into the dentinal tubules was depicted by the red fluorescence, which was traced from the dentin surface until the maximum depth. The measurements were recorded by using the digital measuring ruler, a feature present in the CLSM image recorder software. The data were averaged to obtain a single value for each figure.
Statistical analysis
The proportions of the dead cell volume were subjected to a univariate analysis of variance using SPSS 17.0 (SPSS, Inc., Chicago, IL). Post hoc multiple comparisons were used to isolate and compare the results at a significance level of p < 0.05.
Results
SEM examination
Before incubation, the smear layer was completely removed and the root canal wall was smooth and flat. The dentinal tubules were completely open, the intertubular dentin and intratubular dentin were clear, and there were no microorganisms (Fig. 2A1–A3). In addition, the longitudinally sectioned dentinal tubules were clean and unimpeded (Fig. 2B1–B3).

Root canals after treatment with 5.25% NaOCl and 17% ethylene diamine tetraacetic acid (EDTA). The smear layers were completely removed, the intertubular dentin and intratubular dentin were clear, and there were no residual microorganisms
After a 3-week bacterial incubation, a heavy and dense population of E. faecalis invaded the dentin and occluded the dentinal tubule openings. E. faecalis biofilms formed and bacterial cells displayed a smooth, uniform, and bright surface (Fig. 3A1, A2). The magnification images showed that E. faecalis were round or oval and that they arranged in pairs and adhered to each other (Fig. 3A3, B3). Bacteria were seen inside the dentinal tubules on the longitudinally sectioned root canals (Fig. 3B1, B2).
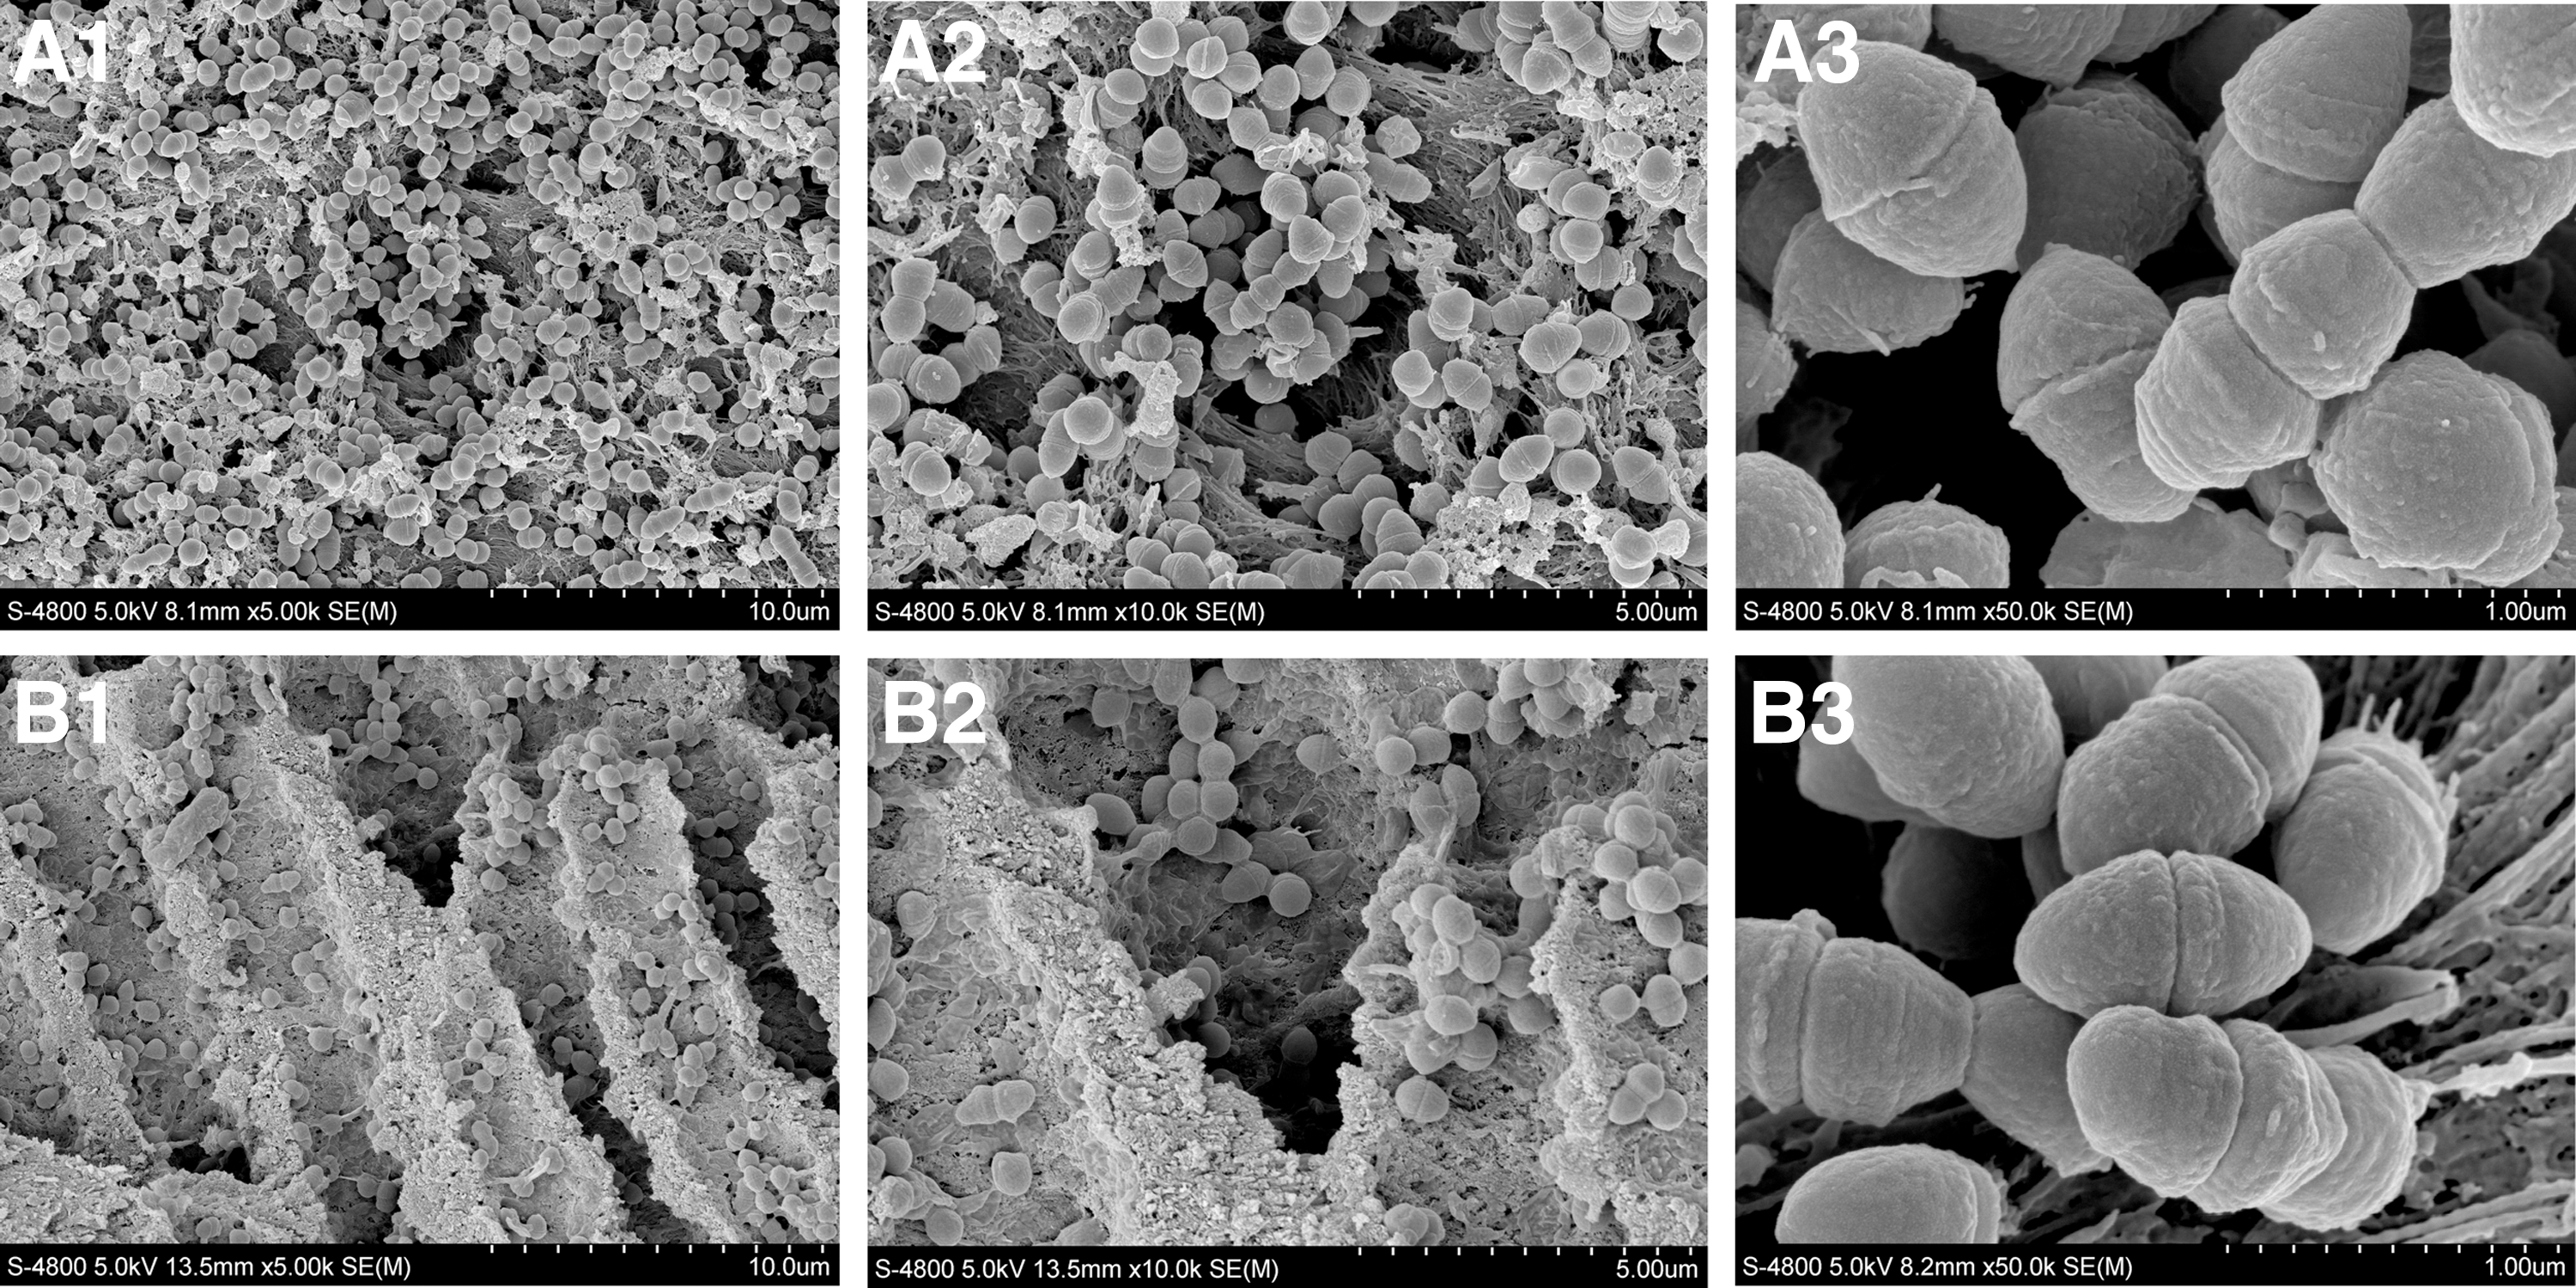
SEM micrograph of the dentin surface after centrifugation of Enterococcus faecalis.
CLSM examination
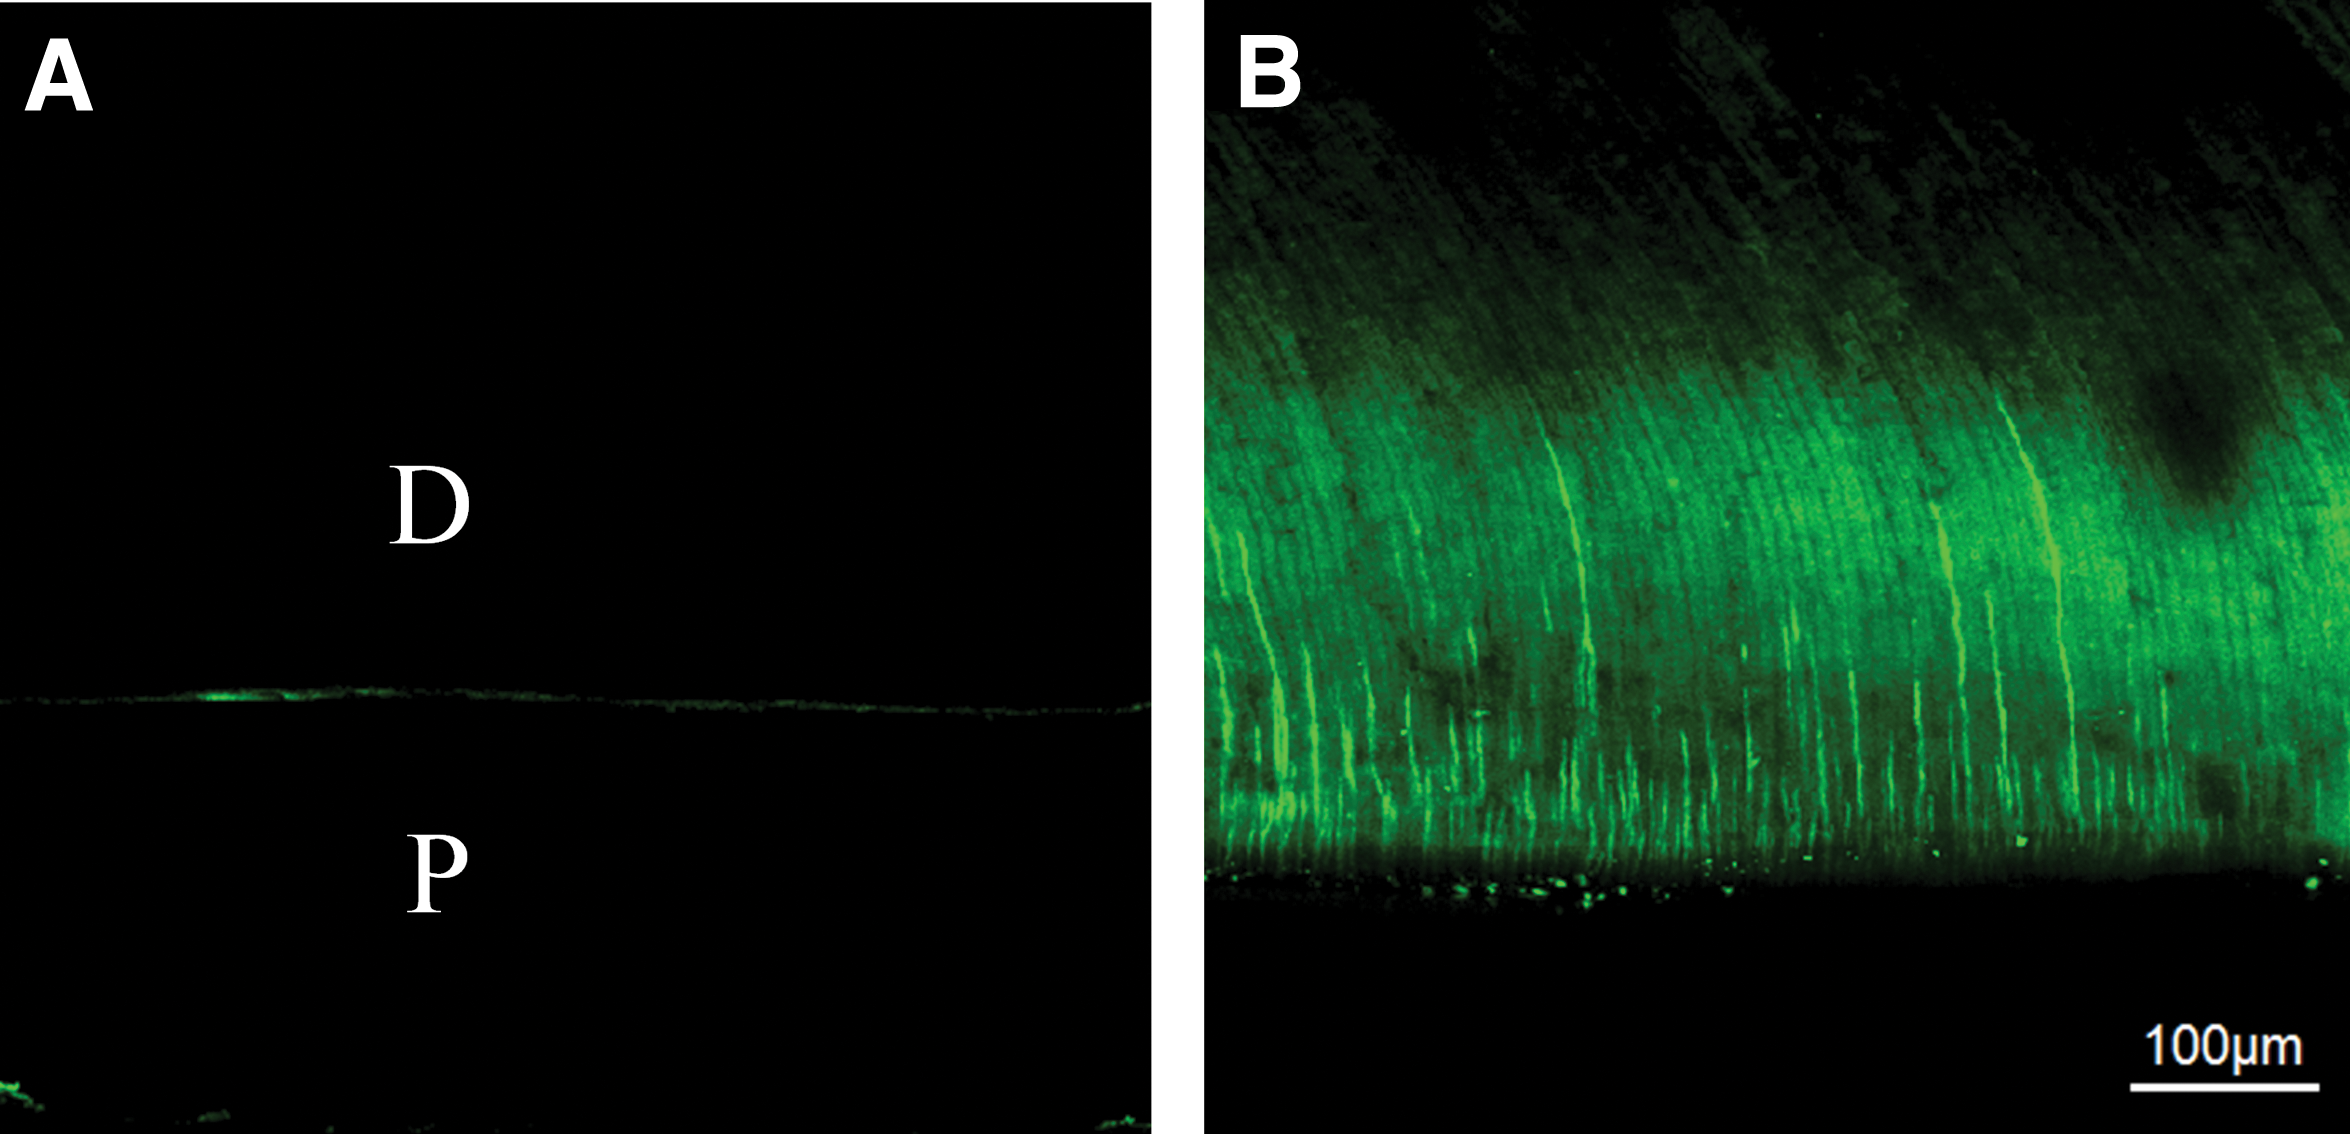
Fluorescent staining of the uninfected dentin specimen showed only a weak green fluorescence of the dentin (Fig. 4A). After a 3-week bacterial incubation, the uniform green fluorescence was observed in the dentinal tubules, which indicated that E. faecalis had successfully invaded the dentinal tubules (Fig. 4B). The invasion depth reached approximately 400 μm (Table 2). After treatments, the green fluorescence intensity decreased, and the red fluorescence intensity increased (Fig. 5A1–F2).
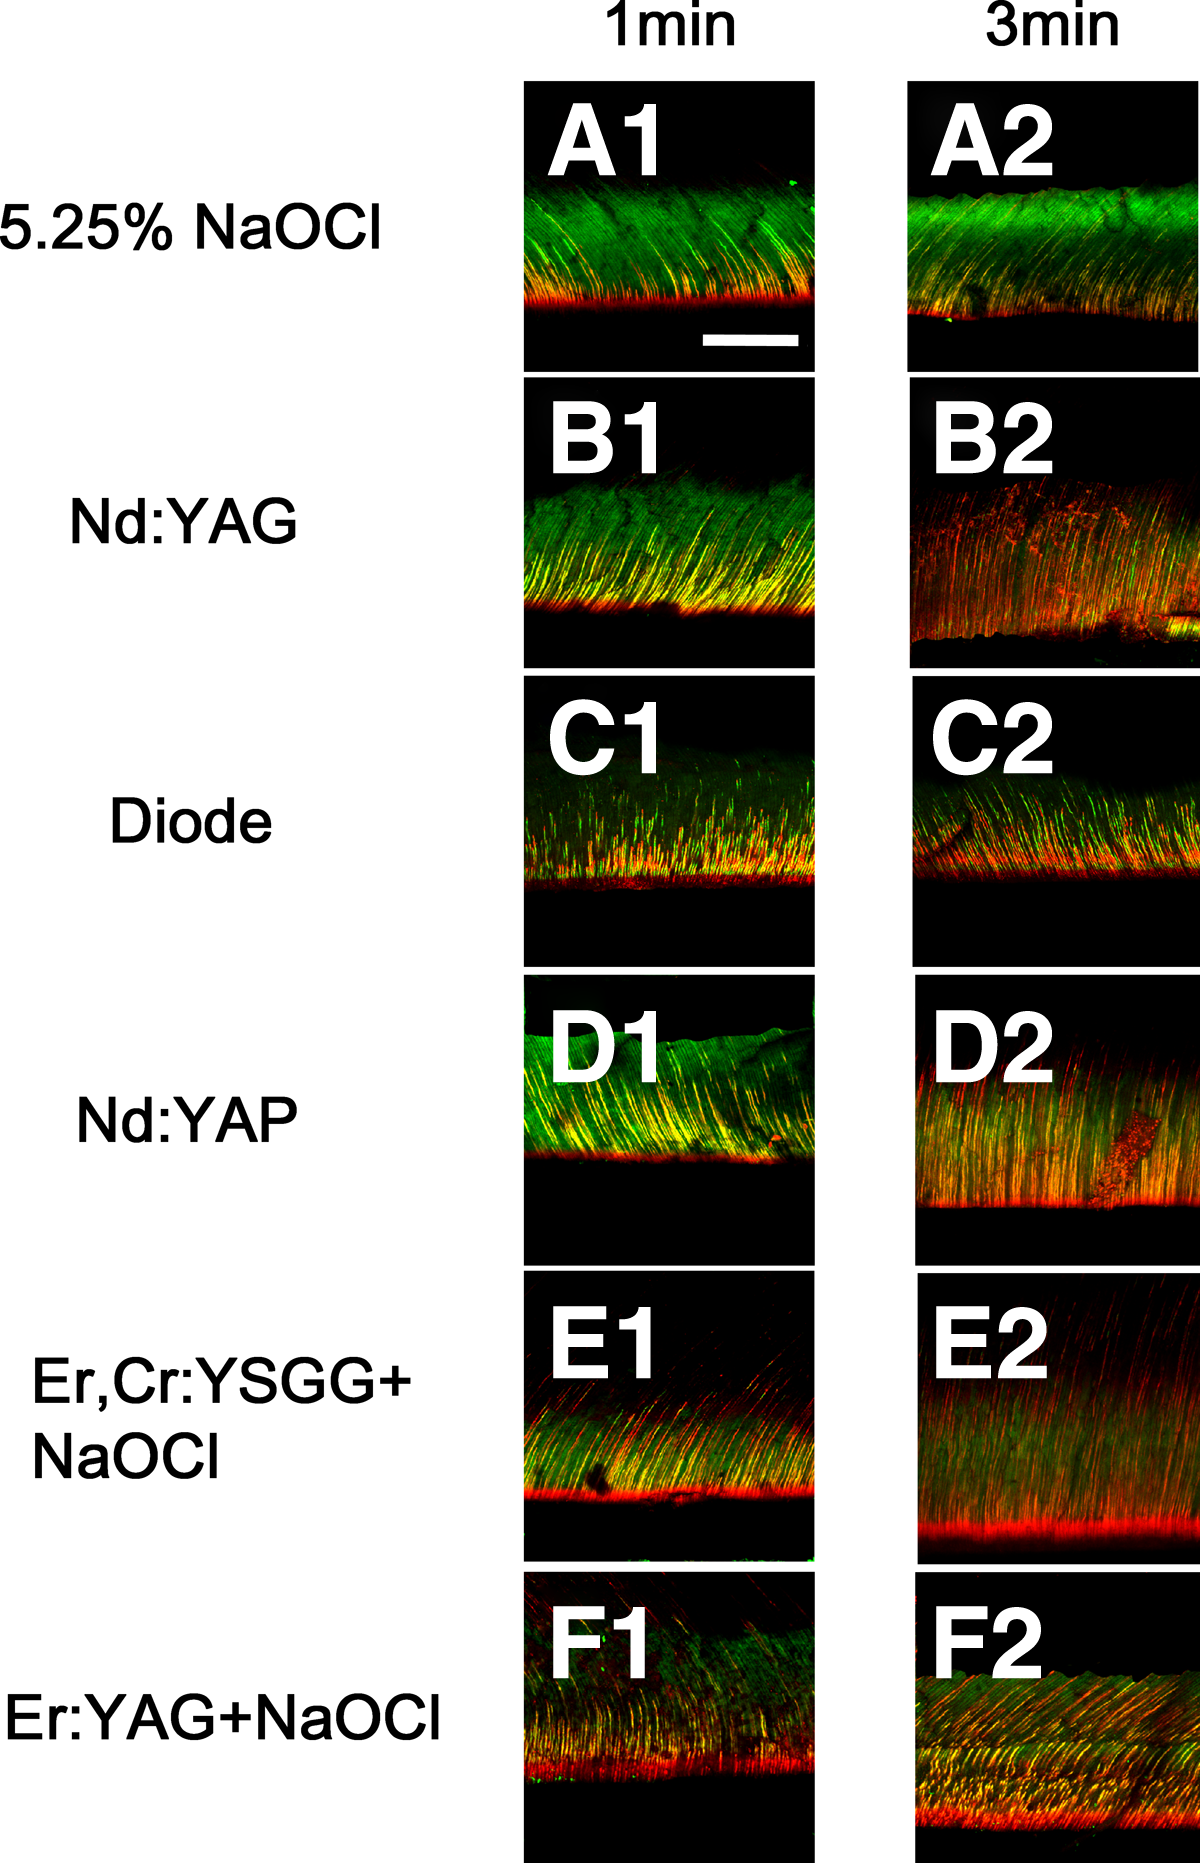
CLSM images of 3-week-old E. faecalis biofilms in infected dentin canals after exposure to various laser systems for disinfecting and viability staining.
Different superscript letters indicate statistically significant differences between groups (p < 0.05).
The proportion of dead cells varied from 36% to 89% in the disinfected groups, whereas only 2–5% of the cells were dead in the negative control group (Table 3). The mean and standard deviations of dead E. faecalis penetration depth are presented in Table 2. The depth and proportion of the dead E. faecalis cell volume depended on the exposure time. Significantly more bacteria in the infected dentinal tubules were dead in each experimental group after 3 min than after 1 min (p < 0.05). The bactericidal effects of laser-activated irrigations were more effective than those of the laser irradiation groups (p < 0.05). No difference was detected between the Nd:YAG laser (60–76%) and the diode laser (57–72%) (p > 0.05). The Nd:YAP laser (65–79%) showed significantly higher levels of bactericidal activity than did the Nd:YAG laser and the diode laser groups and lower levels than did the Er,Cr:YSGG and Er:YAG laser-activated NaOCl groups (p < 0.05). The Er,Cr:YSGG + NaOCl (73–85%) and Er:YAG + NaOCl (76–89%) lasers were the most effective antibacterial protocol at both exposure times (p < 0.05), and no significant difference was found between the groups (p > 0.05).
Different superscript letters indicate statistically significant differences between groups (p < 0.05).
Discussion
Our study used the coronal parts of the root to prepare the specimens because it has a lower possibility of containing sclerotic dentin than does the apical root. 19 The wider and larger dentinal tubule openings in the coronal parts of the root allowed bacteria to easily find the opening during centrifugation and invade deep into the dentin tubules. In addition, we introduced E. faecalis into the dentinal tubules by centrifugation, which allowed the bacteria to uniformly contaminate the dentinal tubules. 19 According to previous studies, a 3-week bacterial incubation allowed the bacteria to uniformly invade the dentinal tubules up to 300–400 μm. 20 The average depth of E. faecalis invasion reached up to ∼400 μm, which was in accordance with the study done by Cheng et al., 15 who concluded that most of the E. faecalis were located within 400 μm inside the dentinal tubules after a 4-week bacterial incubation.
The results of the present study showed that the antibacterial effect of different disinfection protocols increased as the treatment time increased. In our study, the bacterial reduction in the NaOCl group was 36–51%, which agreed with the results in Wang's study, who concluded that the proportion of 6% NaOCl in killing 3-week-old E. faecalis is ∼35–54%. 22 This may be due to the limited penetration capacity of NaOCl, which could penetrate to a depth of ∼130 μm into dentinal tubules but not further. Moreover, it requires direct contact to produce its bactericidal effect. 23 In Cheng's study, 24 they observed that there was a 99.99% reduction in E. faecalis viability on the surface of the root canal walls after irrigation with 5 mL of 5.25% NaOCl for 60 sec. Perhaps the reasons for this were the different infectious models and assessment methods used. They also only took their samples to a depth of no more than 130 μm. In our study, we assessed the sterilizing rate at depth (400 μm), not just at a specific depth, which is more significant and closer to what is done in clinical practice.
In the present study, bacterial reduction in the Nd:YAG and diode laser groups was 57–76%, which was greater than the NaOCl. The bacteria that are located deep inside the dentinal tubules are most likely not to be affected by NaOCl, whereas the Nd:YAG and diode laser group had a greater penetration depth in the dentine and had more potential to reach these areas. The possible mechanisms regarding the antibacterial effect of both the Nd:YAG laser and diode laser involve their thermal and photo disruptive effects. The thermal effects heated the environment above the lethal values. Immediate cell death might not occur during laser irradiation, but sublethal damage inhibits cell growth after exposure to laser irradiation. 25 Sublethal damage includes the destruction of cell wall integrity and possibly the accumulation of denatured protein. Meanwhile, the diode laser could be considered equal to the Nd:YAG laser in endodontic treatment, similar to the results described by Moritz 26 and Gerek. 27 This is possible because of their similar wavelength and permeability, which allow greater laser light penetration through the dentin with little interaction with the dentin, thus making it possible to act on the microorganisms present in the dentinal tubules.
In our study, we combined the Er:YAG or Er,Cr:YSGG lasers with NaOCl, and they both achieved the maximal bactericidal effect. This result might be attributed to the Er:YAG laser and the Er,Cr:YSGG laser, which has a very high absorption in water that increases its disinfection potential, as water is the main constituent of most microorganisms. 28,29 Another physical mechanism of laser activated irrigation (LAI) is the cavitation effect. 30 The strong absorption of Erbium laser energy in NaOCl causes vaporization and the formation of large elliptical vapor bubbles. The vapor bubbles cause a volume expansion of up to 1600 times the original volume of an irrigant, with a high intracanal sheer pressure that drives the fluid into the deep dentinal tubules and kills bacteria. Consequently, the Er:YAG and Er,Cr:YSGG lasers can enhance the bactericidal effect of NaOCl. 30
Our study also suggested that the bactericidal effects of laser-activated irrigation groups are better than those of laser irrigation groups, perhaps because in addition to thermal and photo disruptive effects, laser-activated irrigation groups includes photoacoustic activation. 30 This activation originates from the absorption of laser energy; the formation of vapor bubbles; the collapse of the bubbles; acoustic streaming; and, finally, cavitation. In addition, during irradiation, because the beams of the Nd:YAG laser, the diode laser and the Nd:YAP laser equipped with plain tips are straight in nature, some areas are inaccessible, which may lead to some bacteria remaining alive. As the Er:YAG laser and Er,Cr:YSGG laser were equipped with conically shaped, radially firing tips, they emitted radial light and could irradiate the three-dimensional root canal to kill more bacteria. 31,32 As a result, the bactericidal coefficient of the laser-activated irrigation groups is higher.
However, the bacterial reduction is lower in our study than that found in previous studies. 24,27 In the previous studies, the researchers used the viable cell counting method to calculate the proportion of dead bacteria. In our study, we used CLSM analysis. Culturing powdered dentin on plates for colony counting is not a sensitive method, because some bacteria are viable but nonculturable, 33 which causes higher bacterial reduction.
Viability staining is based on the principle that SYTO 9 can stain both living and dead bacterial cells with intact membranes, whereas PI can only stain bacterial cells with damaged membranes, such as dead bacteria. 34 Therefore, this method resulted in an observed bacterial reduction that was smaller than it actually was. 24 Despite its shortcomings, the viability staining methodology allows the relative proportion of killed bacteria in each specimen to be measured and can obtain representative data from randomly selected areas. 19 Furthermore, it is convenient for detecting differences among groups.
According to the results, no significant difference was observed between the Er:YAG and Er,Cr:YSGG lasers when used in combination with NaOCl. During the LAI, however, the fiber tip of the Er:YAG laser was dipped in the fluid rather than close to the dentin, which indicates that the Er:YAG laser may be applicable for canals of various shapes in clinical application and need to be explored in future investigations.
In our study, we used a single-species biofilm model to determine the most effective endodontic disinfection protocol. The efficacy of the techniques should be further determined on a multispecies biofilm. In addition, we used coronal parts of the root to establish the study model, which aims to make more bacteria penetrate into the dentinal tubulars. Further research should study the apical parts of the root.
Conclusions
With the confines of this study, treatments of Er:YAG + NaOCl and Er,Cr:YSGG + NaOCl presented the strongest bactericidal effect among the tested protocols and are potential protocols for disinfecting the root canal system.
Highlights
The bactericidal effect was Er:YAG + NaOCl, Er,Cr:YSGG + NaOCl > Nd:YAP > Nd:YAG, diode > NaOCl.
The Er:YAG and Er,Cr:YSGG lasers significantly enhanced the bactericidal effect of NaOCl.
Er:YAG and Er,Cr:YSGG laser combined with NaOCl are potential protocols for root canal disinfection.
Footnotes
Acknowledgments
This research was supported by National Natural Science Foundation of China (Grant No. 81771060 and 81470733) and Natural Science Basic Research Plan in Shaanxi Province of China (Program No. 2015JZ022).
Author Disclosure Statement
No competing financial interests exist.