
Abstract
Background:
An oxygen-enriched photosensitizer solution was created by the addition of red blood cells (RBCs) as an investigative tool for photosensitization reactions (PRs). Although the oxygen levels and reaction progress can be monitored using the optical characteristics of hemoglobin, previously this has only been done using intermittent measurements. An increase in methemoglobin concentration with irradiation time was reported.
Objective:
We constructed a continuous optical measurement system to study the dynamics of the PR in a photosensitizer solution containing RBCs. We also measured the relationship between hemolysis and methemoglobin production in the solution.
Materials and methods:
A 664 nm wavelength continuous laser beam at 60 mW/cm2 was used to drive the PR, and a broadband (475–650 nm) light beam was used to monitor the absorption spectra during the PR. The light sources were arranged perpendicularly to cross at a 1 × 10 mm cuvette. The sample in this cuvette was prepared from a low-hematocrit rabbit RBC suspension medium containing 30 μg/mL talaporfin sodium, a chlorine photosensitizer. The concentrations of oxygenated hemoglobin, deoxygenated hemoglobin, and methemoglobin were obtained using a multiple regression analysis of the measured spectra.
Results:
The oxygen saturation decreased continuously during the PR. The relationship between the degree of hemolysis and produced methemoglobin concentration was confirmed.
Conclusions:
We determined the dynamics of the oxidation and oxygen desorption of hemoglobin, as well as RBC hemolysis, during the PR. Our measurement system, which uses the properties of hemoglobin contained in RBCs, might be useful for continuous monitoring of PR dynamics.
Introduction
Photodynamic therapy is widely used in various cancer treatments, including for early stage lung cancer, brain malignancy, and recurrent esophageal cancer. 1 –4 The therapeutic principle behind this method is the oxidative action of singlet oxygen produced by a photosensitization reaction (PR), which involves a photosensitizer, excitation light, and oxygen. 1 –4 The basic experiments for novel treatments should be investigated in vitro first to limit the number of sacrificed animals and required clinical subjects. Since novel photosensitizers and other treatments using photodynamic therapy are currently under development, in vitro experiments to discuss PRs in vivo are becoming increasingly important. 5 –7
The reaction efficacy has been greatly increased by second-generation photosensitizers, 4,8 which lead to an increase in oxygen consumption during irradiation, and oxygen depletion often occurs in vitro during irradiation. 9,10 The oxygen content of the reaction volume is important because it directly relates to the reaction efficacy. 9,10 Oxygen supply is usually rich with in vivo environments, but is hard to simulate in vitro. Electrodes are widely used to measure the oxygen pressure, but because the excitation light for the PR might disturb the electrode measurements, it is difficult to monitor the precise oxygen pressure. 11,12
To solve those issues, we previously reported on a method that involved adding red blood cells (RBCs) to the cell cultivation medium. In this way, the dissolved oxygen content can be raised, and by measuring the absorption spectra, these levels can be intermittently monitored. 13 Although the oxygen levels and reaction progression could be obtained using this optical system based on the optical characteristics of hemoglobin, there were three limitations in our previous study. The first limitation is that the oxygen supply from the surrounding atmosphere influenced the oxygen levels of the reacted sample. Since the absorption spectra are measured ∼3 min after the reaction finished in the previous intermittent measurement study, the sample appears to obtain oxygen from the atmosphere during this time, which leads to an overestimation of the oxygen level in the reacted sample. The second limitation is the mismatch of the measurement area and excitation irradiation area. Since the measurement area was not completely included in the irradiation area, the dynamics of the reaction were not correctly measured. The last limitation is that the intermitted measurement interval of the irradiation time in the previous study, longer than 20 sec, was too long to measure the exact responses of the fast reactions.
In this study, we constructed a continuous optical monitoring system to determine the real-time concentration dynamics of oxygenated hemoglobin, deoxygenated hemoglobin, and methemoglobin using transmission absorption spectra to better understand the detailed dynamics of the oxygen levels in an oxygen-enriched photosensitizer solution with added RBCs. Because the absorption spectra were measured simultaneously and continuously, and the measurement area was completely covered by the excitation area, the oxygen level dynamics of the sample during the reaction might be able to be determined more accurately by this system.
Methemoglobin concentration was found to increase with irradiation time in the previous study, but the reason was not investigated. 13 We hypothesized that changes in the methemoglobin concentration might indicate hemolysis due to the PR. This is because free hemoglobin released from RBCs after membrane rupture can become subject to the oxidative action of the reaction and become converted to methemoglobin. We also investigated the relationship between hemolysis progression and methemoglobin production in this study.
Materials and Methods
Sample preparation
Rabbit defibrinated blood (Nippon Bio-Test Laboratories, Inc., Tokyo, Japan) was centrifuged at 1900 g for 10 min at 4°C (Model 2800; Kubota Co., Ltd., Tokyo, Japan). The RBCs were obtained by removing the supernatant from the blood plasma obtained during this centrifugation. Saline was gently injected to wash the RBCs, which were centrifuged again in the same manner. This procedure was repeated twice to obtain pure RBCs. A saline solution containing talaporfin sodium (Laserphyrin®; molecular weight: 799.69; Meiji Seika Pharma Co., Ltd., Tokyo, Japan) 14 and the pure RBCs were mixed to make the optical sample solution, at a concentration of 30 μg/mL talaporfin sodium, and a hematocrit (HCT) level of 0.625%. Talaporfin sodium is a chorine-ring photosensitizer with aspartic acid, also called LS11 or NPe6. 3,4,8 It has a high efficiency of singlet oxygen production and a high exhaustion rate. It has been approved in Japan for the treatment of early stage lung cancer, brain malignancy, and recurrent esophageal cancer. 4,8,14 A 10 mm wide borosilicate glass cuvette cell with a 1 mm optical path length (YG-1; Tech-jam Co., Ltd., Osaka, Japan) was used. A 150 μL aliquot of the solution was injected into the cuvette as the optical sample.
Optical setup for continuous absorption spectrum measurements during the reaction
To obtain the absorption spectra during the reaction, the excitation laser axis and measurement light axis were arranged perpendicularly, as shown in Fig. 1. The optical sample was placed at the point the two optical axes crossed. A 664 nm wavelength diode continuous laser (Rouge-LD; Cyber Laser Co., Ltd., Tokyo, Japan), which corresponded with a Q-band absorption of talaporfin sodium, 15,16 was used as the excitation light with an irradiance of 60 mW/cm2 derived through a plastic optical fiber for a total radiant exposure of up to 20 J/cm2 (for an irradiation time of 333 sec). This laser beam was set to a diameter of 15 mm to completely cover the sample solution, as shown in Fig. 2. The optical path length for the laser beam in the cuvette was 10 mm. A xenon lamp system (RX-3300; MACHIDA Endoscope Co., Ltd., Chiba, Japan) was used as a light source for absorption spectrum measurements. We selected the wavelength range for the absorption spectrum measurements to be 470–650 nm to avoid the talaporfin sodium absorption band. 15 Light in this wavelength range was obtained by using a band-pass system with two filters (LVX470 and SVX650; ASAHI SPECTRA Co., Ltd., Tokyo, Japan), as shown in Fig. 1. This light beam had a diameter of 7 mm, and a black mask with a diameter of 4 mm aperture was located nearby, with its side edge in the excitation light beam direction, as shown in Fig. 2a and b. The measurement area of the absorption spectra was set to be close to the side of incidence of the excitation laser to cover the excitation area with 664 nm laser light (Fig. 2b). The optical path length of the xenon light was 1 mm. We selected a short optical path length to obtain sufficient transmission photon counts for the absorption spectrum measurements because the RBC suspension medium exhibited significant scattering and absorption of visible light. 17 The transmission photon counts were obtained every second using a multi-channel spectrum analyzer (C10027-02; HAMAMATSU Co., Ltd., Shizuoka, Japan) with an integrating sphere to collect the scattered photons. The absorbance of the optical sample was calculated using a saline solution as a reference. Two control experiments were performed. One measured the absorption spectra of the optical sample without the photosensitizer during the irradiation to investigate the laser influence on RBCs. Another measured the absorption spectra of the optical samples with changing the contact time of the RBCs to the photosensitizer medium for 5–120 min to investigate the photosensitizer influence on RBCs.

Optical equipment for the continuous measurement of the absorption spectrum of an optical sample during a photosensitization reaction.
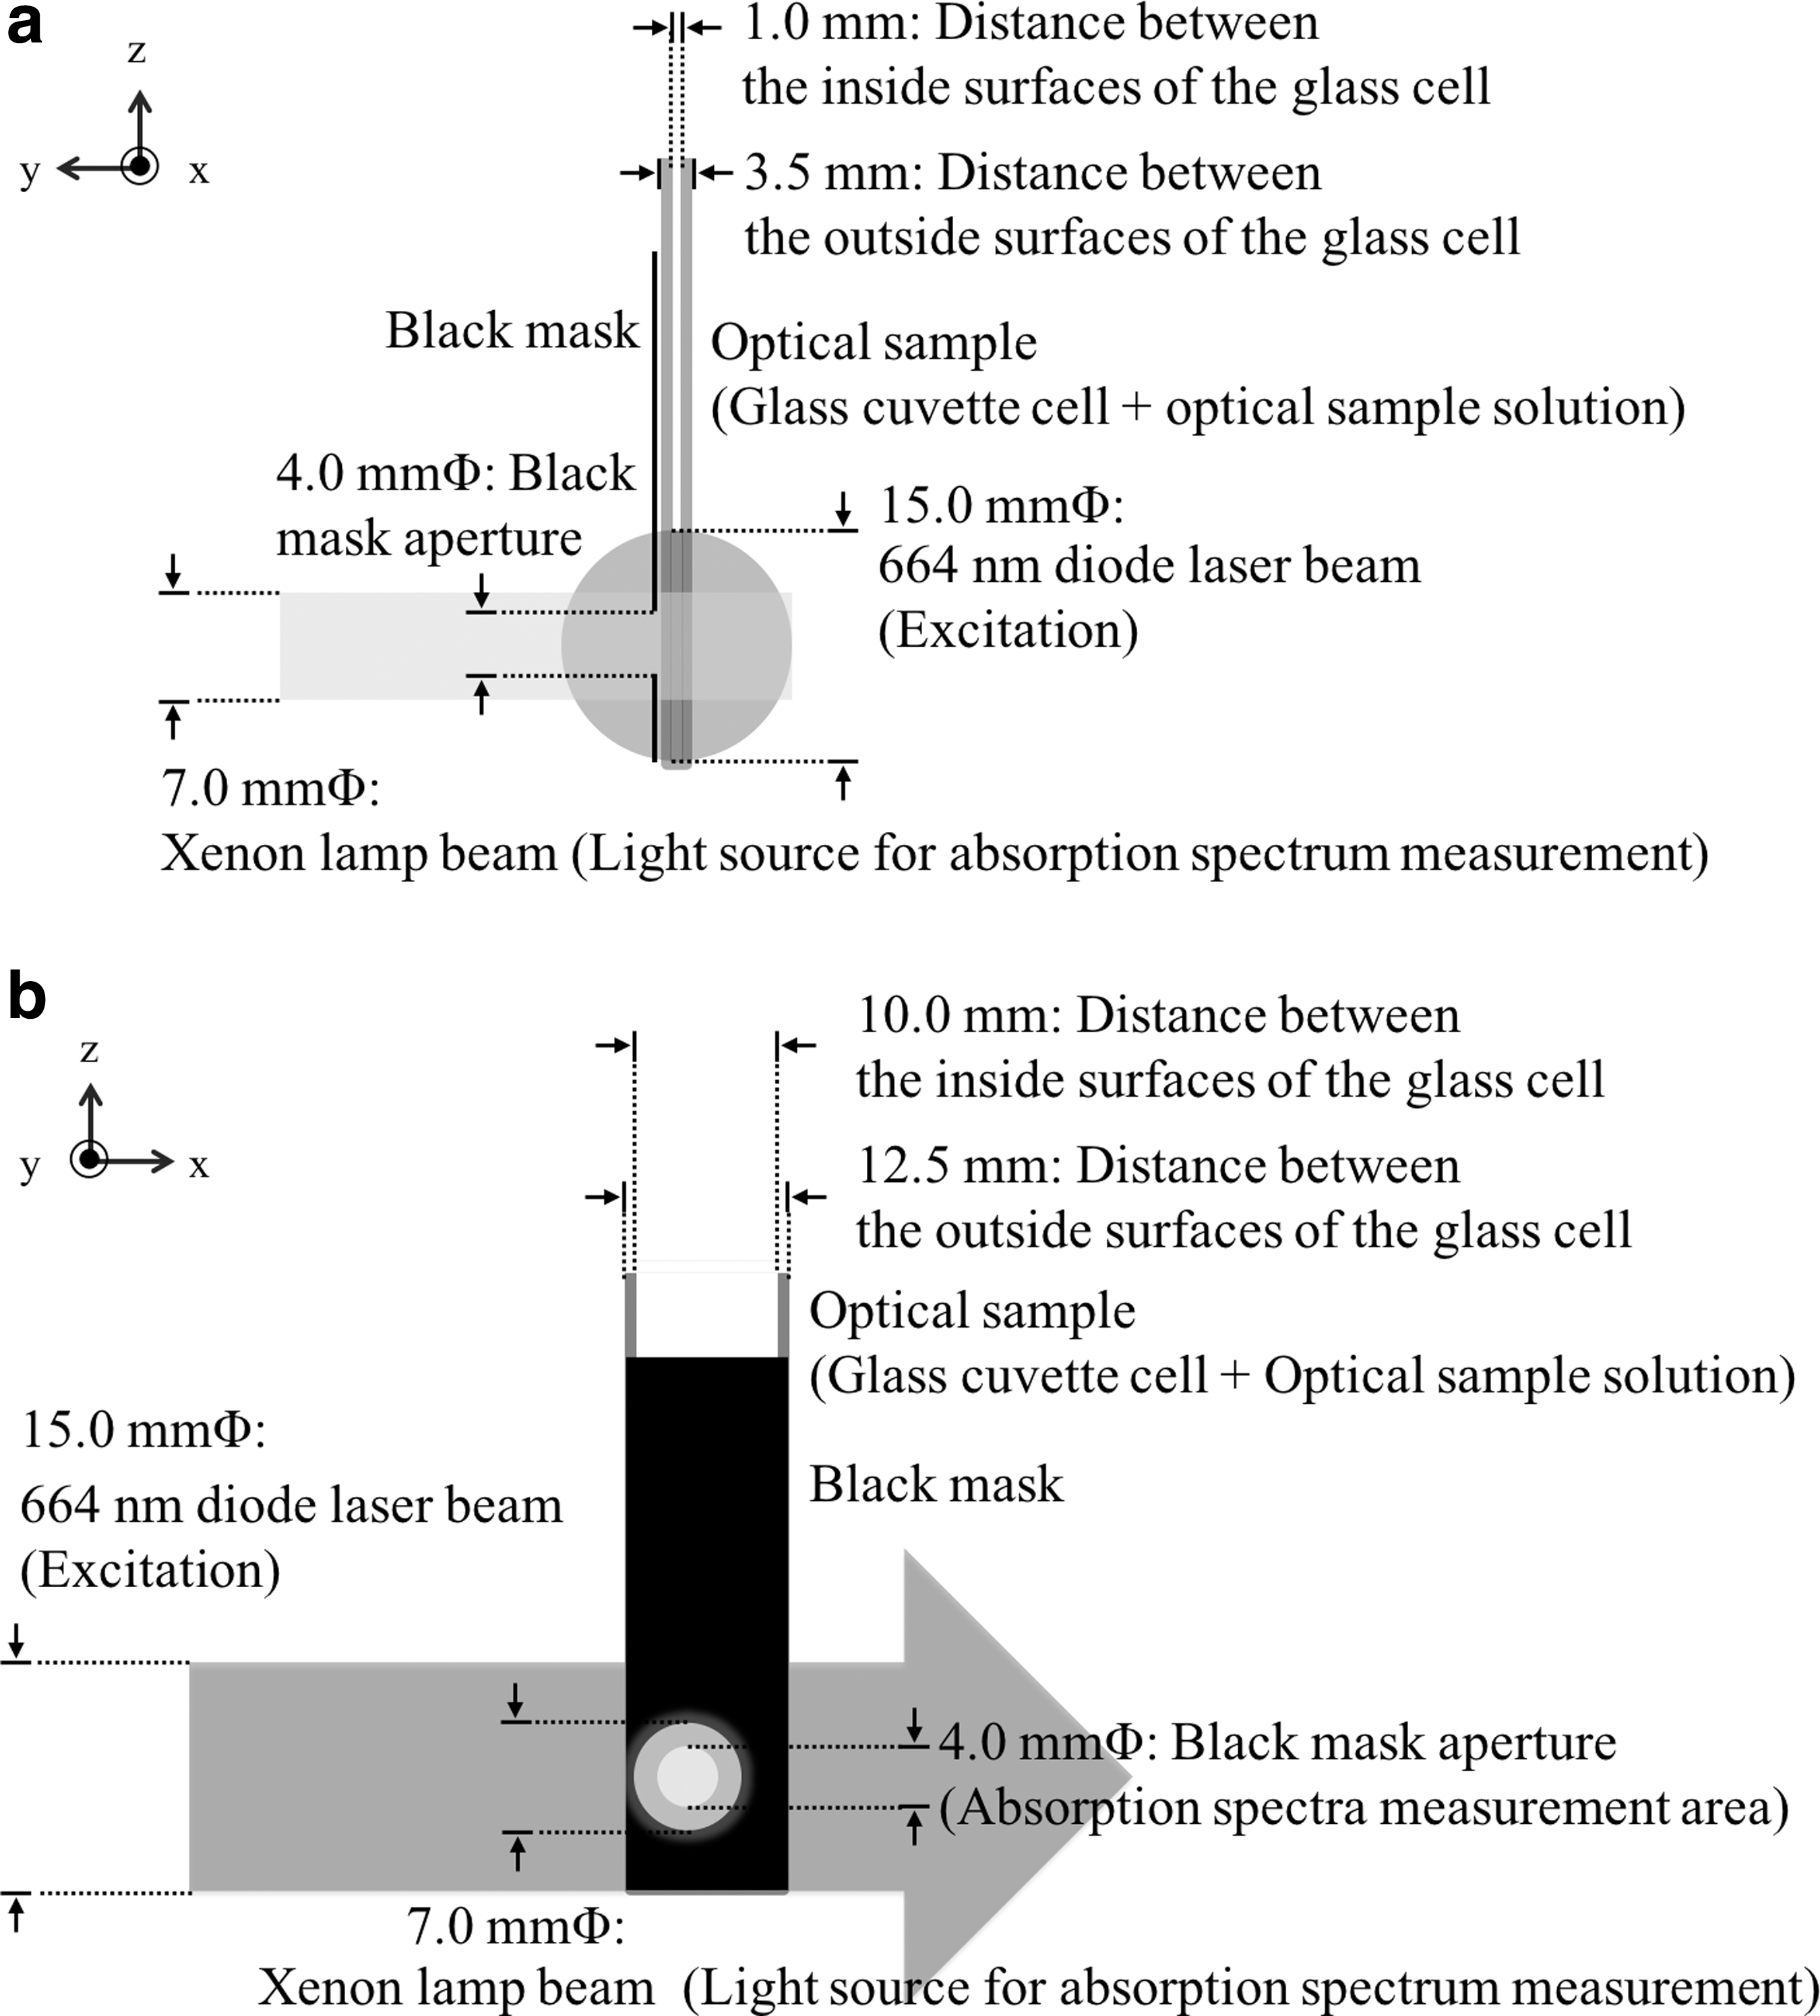
Optical arrangement of light beams and an optical sample. The optical sample was placed at the point the two optical axes crossed.
Analysis of the concentrations of the three hemoglobin states from the measured absorption spectra
The concentrations of the three kinds of hemoglobin were calculated from the measured absorption spectra while the excitation irradiation was applied using a multiple regression analysis, as described in our previous studies, using the following equation
13
:
A description of the valuables is listed in Table 1. The regression coefficients b
0–b
4 were chosen to minimize the residual sum of squares between the measured optical sample absorbance
Description of Variables in Equation (1)
The oxygen saturation was calculated using the oxygenated hemoglobin concentration and deoxygenated hemoglobin concentration was obtained from Equation (1).
Hemolysis monitored using supernatant absorbance
The supernatant absorbance was used as a conventional method for measuring the degree of hemolysis.
18
The optical samples were made using the same method already described and irradiated at 60 mW/cm2, for a total exposure of 1.25–20 J/cm2. The irradiated and nonirradiated samples were centrifuged at 923 g for 5 min at 4°C. The supernatant absorbance was measured using a spectrophotometer (UV-3600; SHIMADZU Co., Ltd., Kyoto, Japan) equipped with an integrating sphere at 522 nm, which is an isosbestic absorbance point of the three kinds of hemoglobin.
19
The degree of hemolysis was defined by the following equation
18
:
where a, b, and c are the average supernatant absorbances at 522 nm of the irradiated sample, nonirradiated sample, and a completely hemolyzed sample, respectively. The completely hemolyzed sample was prepared from a 40 J/cm2 sample that was sufficiently irradiated to cause complete hemolysis.
Results
Absorption changes during irradiation
Absorption changes in the optical samples containing 30 μg/mL talaporfin sodium after irradiation at 60 mW/cm2 are shown in Fig. 3. The oxygenated hemoglobin bimodal peaks located in the range of 500–600 nm gradually flattened to resemble those for methemoglobin with increasing irradiation time. The changes in the absorption spectra during irradiation shown in Fig. 3 did not appear in the corresponding control experiments. Since the control absorption spectra did not change, but rather maintained their preirradiation form, we believe the changes shown in Fig. 3 should be attributed to the progression of the PR, and not to the effects of the laser or photosensitizer alone.
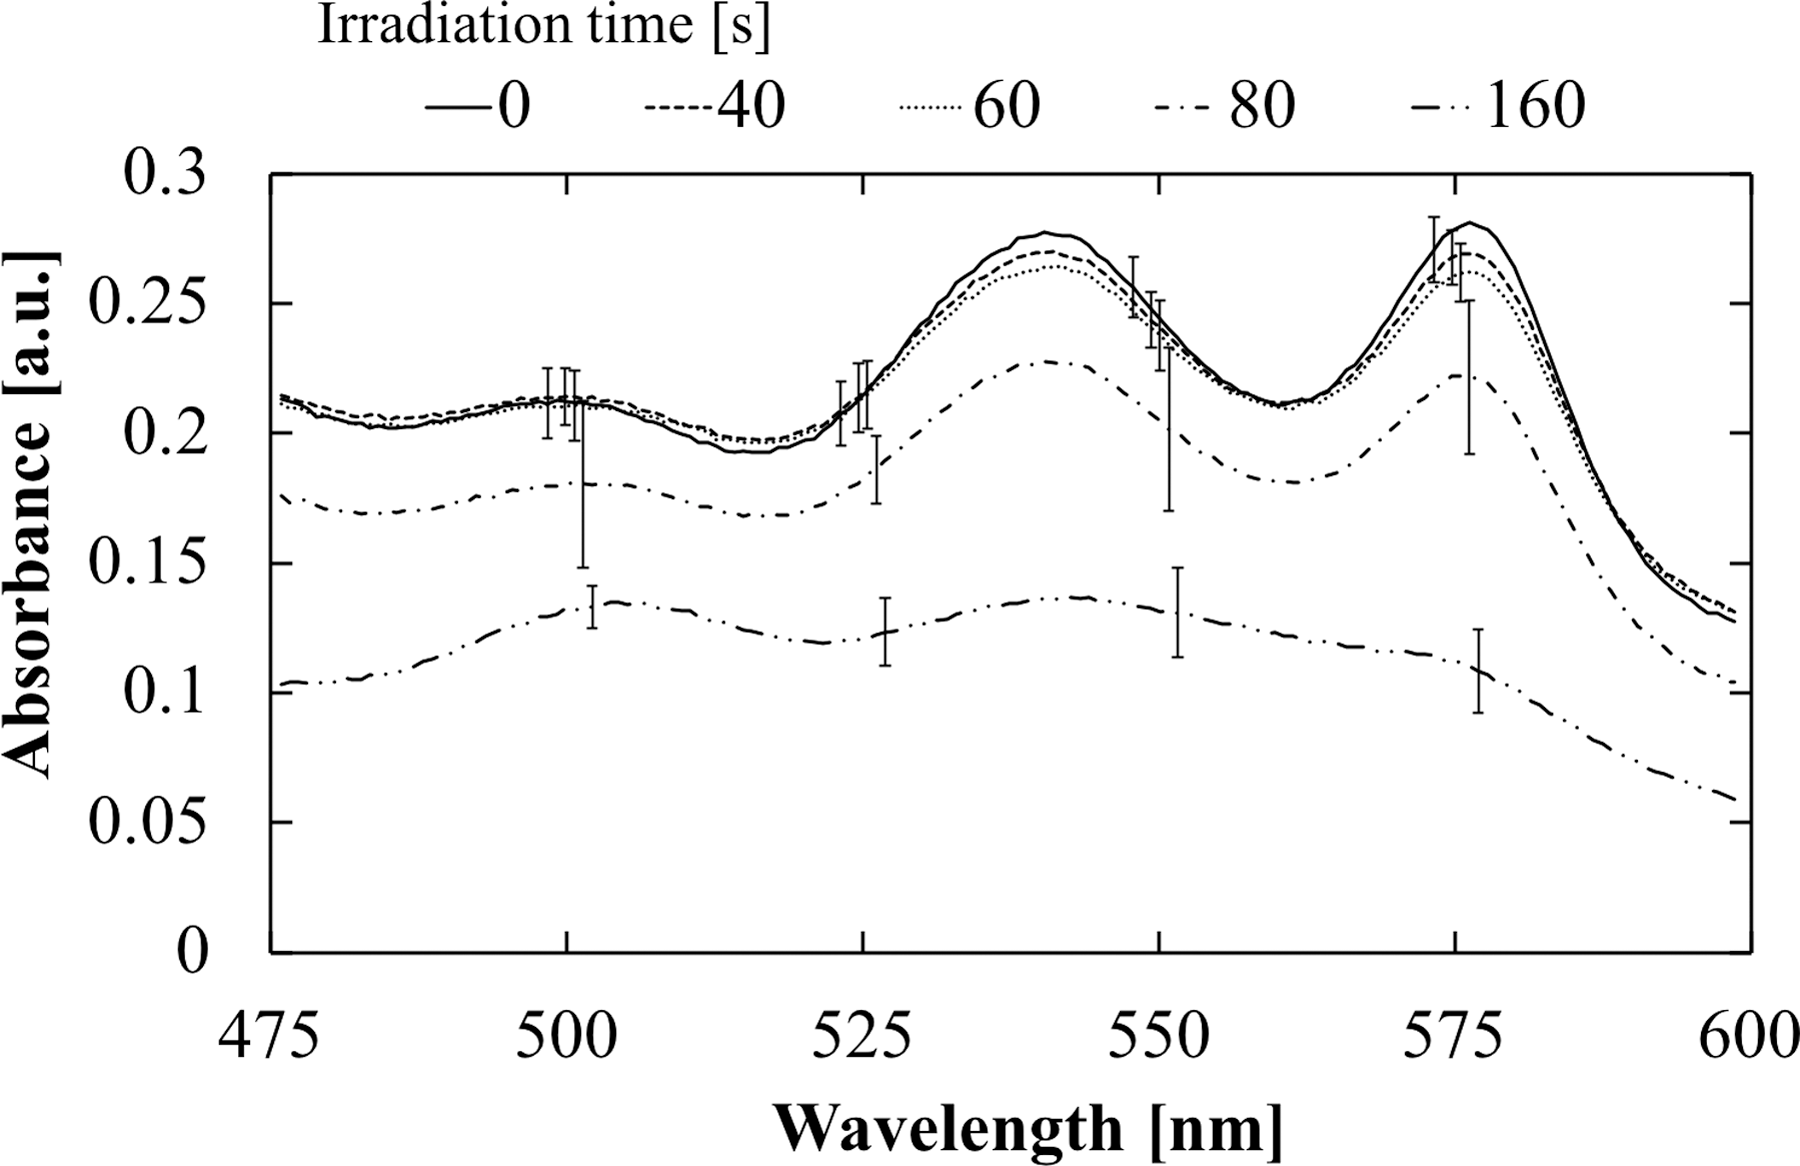
Spectral changes in the average absorbance of the optical samples between 475 and 600 nm measured by our optical setup during the irradiation time (N = 4–5). The standard deviations at certain wavelengths (500, 525, 550, and 575 nm) for the absorbance of each irradiation time are shown to indicate the approximate accuracy of this measurement. These standard deviations at the same wavelength of each irradiation time were indicated with sliding the wavelength every 0.75 nm to make it distinguishable. The absorbances data were obtained every 0.75 nm.
Hemoglobin concentrations obtained by a multiple regression analysis from the measured absorption spectra and oxygen saturation
Figure 4 shows the hemoglobin concentration changes during the irradiation time analyzed by a multiple regression of the measured absorption spectra and calculated oxygen saturations. The methemoglobin concentration increased with irradiation time and plateaued after about 160 sec. The oxygen saturation calculated from the obtained concentrations of oxygenated and deoxygenated hemoglobin decreased with the irradiation time, until it became zero after about 160 sec. The determined coefficients obtained from each matched synthetic spectrum using the results of the multiple regression analysis Equation (1) and measured spectrum, as shown in Fig. 3, were all >0.98. The total hemoglobin concentration calculated from the sum of the methemoglobin, oxygenated hemoglobin, and deoxygenated hemoglobin concentrations derived with the multiple regression analysis was 0.27 ± 0.02 g/dL.

Changes in concentrations of methemoglobin, oxygenated hemoglobin, and deoxygenated hemoglobin during the irradiation with calculated oxygen saturation change (N = 4–5). Each datum was obtained every second.
Relationship between methemoglobin concentration and degree of hemolysis
The relationship between the methemoglobin concentration obtained by our measurement system and the degree of hemolysis determined by the conventional method is shown in Fig. 5. The slope of a line shown at the lower right of Fig. 5 indicates the gradient of 504 [%/(g/dL)], the value of which was calculated in the Discussion section. A detailed explanation of this slope is given hereunder.
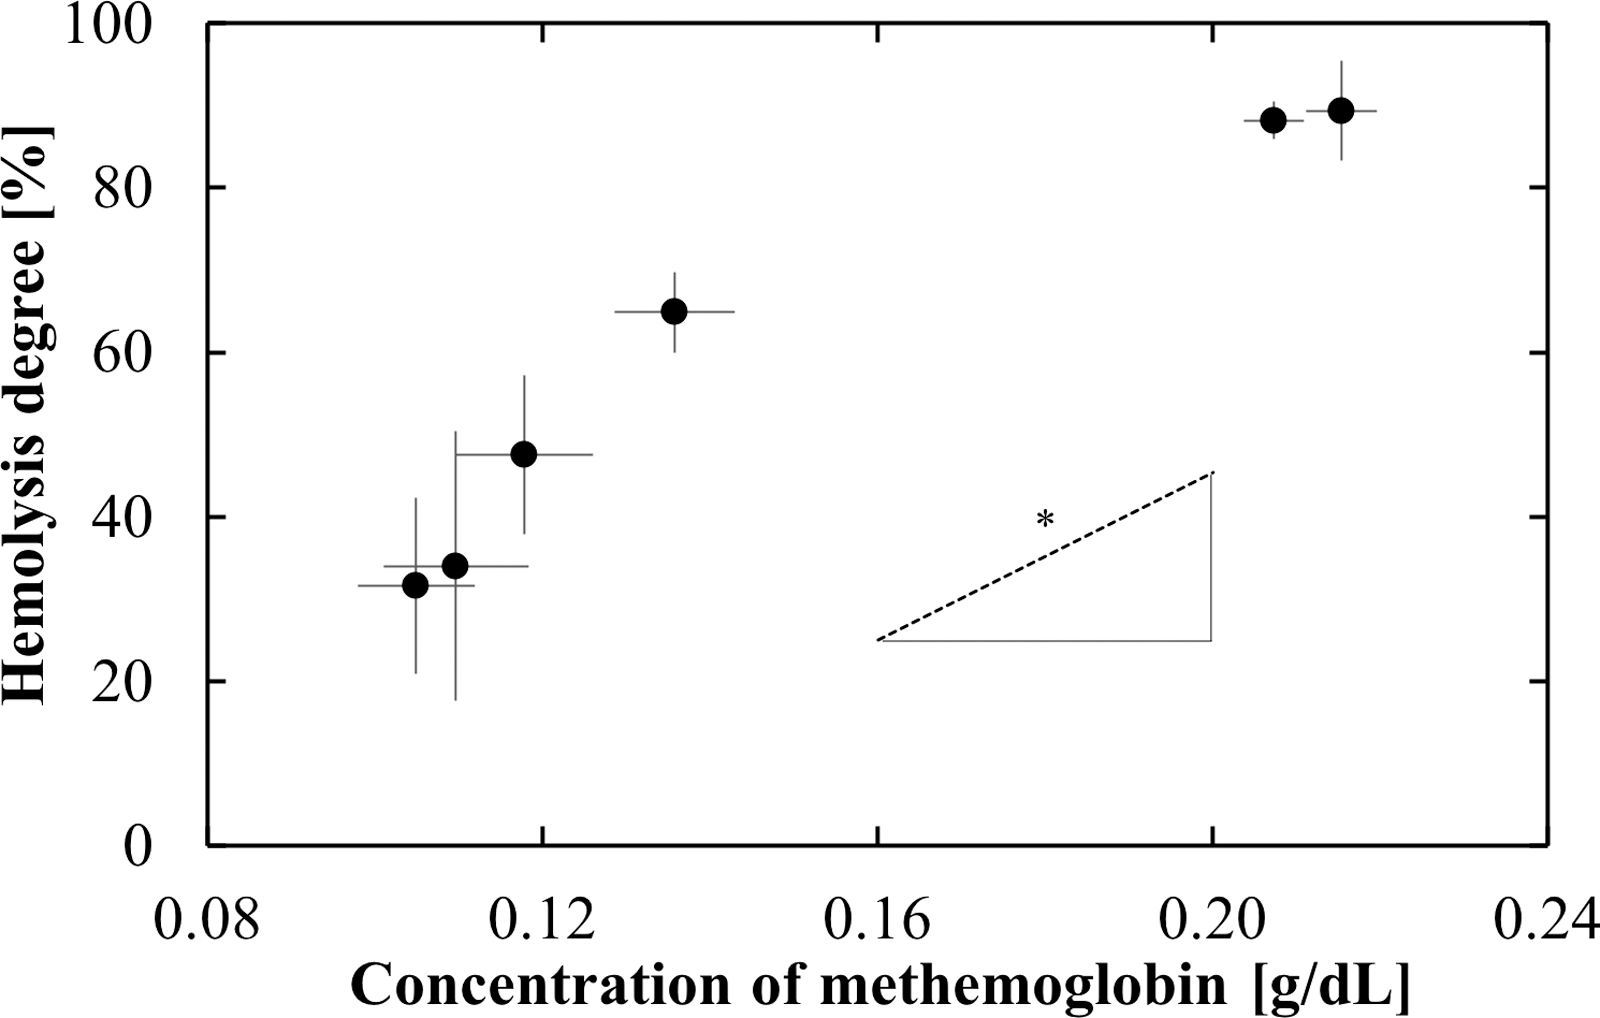
Relationship between methemoglobin concentration and degree of hemolysis (N = 4–5). *The slope of a line shown at the lower right indicates the gradient of 504 [%/(g/dL)]. A detailed explanation of the calculation and consideration about this slope are described in the Discussion section.
Discussion
Concentration dynamics of the three hemoglobin states during a PR
We successfully monitored the continuous concentration dynamics of the three kinds of hemoglobin during the reaction using our optical system, as shown in Fig. 4. These dynamics of the concentrations of the three kinds of hemoglobin appear reasonable for several reasons. The decrease in oxygenated hemoglobin and simultaneous increase in deoxygenated hemoglobin reflect the oxygen consumed by the PR. It is known that the oxygen level, which can be derived from the oxygen saturation as calculated based on the relative concentrations of oxygenated and deoxygenated hemoglobin, is strongly correlated with the efficacy of the PR. 9,10 Therefore, the decrease of the oxygen saturation to 0 at 160 sec appeared to cause the reaction rate to slow and then stop completely. At the same time, the methemoglobin concentration increased until it saturated around 160 sec. These dynamics indicate a connection between the reaction rate and oxidative action. Since we measured the absorption spectra simultaneously during irradiation every second using our system, the marked changes in behavior can be captured with high resolution. Moreover, the oxygen levels in each radiant exposure seem to be lower in this study than in our previous intermittent study. 13 We think this result indicates that in the previous study, there was influence from the oxygen coming from the surrounding atmosphere on the reacted optical samples, ∼3 min interruption before the absorption spectrum measurement.
The total hemoglobin concentration obtained by our system was 0.27 ± 0.02 g/dL. The implied value based on a HCT level of 0.625% is 0.21 ± 0.02 g/dL. 20 Considering the individual-level variations in the species of rabbit used in our study, these total hemoglobin concentration values are in good agreement with expectations.
Validity of the blood sample HCT value
We used samples with a low HCT value, 0.625%, to ensure sufficient light transmission for the absorption measurements with a 1 mm optical path length. Based on the optical properties of the blood samples measured by the spectrophotometer in a prestudy, the penetration depth of the 664 nm wavelength excitation laser light in the blood sample was calculated to be 5.5 mm, which covers the measurement area, of which the diameter was 4 mm, as shown in Fig. 2. Since it was reported that the absorption and scattering coefficients at 633 nm increase monotonically with increasing HCT value, especially <10%, the penetration depth of the excitation light would not be sufficient to reach the measurement area in our set up, as shown in Fig. 2, if we increased the HCT value. 17 In addition, employing blood with a HCT value of 0.625% allowed the hemoglobin to become sufficiently oxidized, because the molar ratio between the hemoglobin and 30 μg/mL talaporfin sodium was almost 1:1 based on the reported amount of hemoglobin in each rabbit RBC. 14,21
Relationship between methemoglobin concentration obtained by our measurement system and degree of hemolysis
We confirmed a positive correlation between the methemoglobin concentration obtained using our measurement system and the degree of hemolysis determined by the conventional method, as shown in Fig. 5. Based on the finding that the methemoglobin concentration was related to the PR, as already mentioned above, we believe that the hemolysis shown in Fig. 5 corresponds with the progression of the PR. To determine whether the hemoglobin from damaged RBCs became oxidized to methemoglobin immediately after cell rupture, we considered the ratio between the converted methemoglobin concentration and the total hemoglobin in the damaged RBCs. The degree of hemolysis on the vertical axis of Fig. 5 is, fundamentally, a measure of the total hemoglobin that was contained in the damaged RBCs. This is due to the measurement procedure for the vertical axis, including the centrifugation step.
Using the reported hematology values of HCT 43.1 ± 2.4 [%], RBC count 6.33 ± 0.41 [ × 10
6
/μL], and mean corpuscular hemoglobin 21.6 ± 1.3 [pg],
20
the slope of the hemolysis change (Δy) [%] and hemoglobin concentration change from the ruptured RBCs (Δx) [g/dL] could be calculated to be 504 ± 53 [%/(g/dL)] using the following equation:
The slope of the line at the lower right in Fig. 5 is 504 [%/(g/dL)]. The positive correlation between the methemoglobin concentration obtained using our measurement system and the degree of hemolysis obtained from a conventional method seems to be approximately similar to this slope. Therefore, we believe that it is reasonable to assume that almost all of the hemoglobin in the damaged RBCs became converted to methemoglobin immediately after the cells were ruptured. From these results, it appears that methemoglobin changes can indicate the progression of hemolysis resulting from the PR.
Application of this system
Based on the discussions, the usefulness of our measurement system as part of a novel assessment method for hemolysis resulting from a PR might be suggested. In photodynamic therapy, hemolysis can be an acute side effect, since the photosensitizer exists not only in the target tissue but also in the bloodstream. 22 As a result, healthy RBC membranes can become damaged by the oxidative action, leading to hemolysis. Our proposed measurement system seems to be useful for monitoring hemolysis during PRs because it can reveal, continuously and in real-time, the methemoglobin production, and the relationship with hemolysis has been indicated in our study, with oxygen saturation information. The hemolysis progression measured in our system using the methemoglobin concentration dynamics might allow us to study in vivo situations by correcting the reaction efficacy based on the oxygen saturation changes of the sample in the cuvette to the situation of sufficient oxygen supply in vivo. In this study, we investigated the interactions of a PR with RBCs in vitro under limited parameter ranges, including low HCT, a photosensitizer concentration of 30 μg/mL, and an irradiance of 60 mW/cm2. Although we do not consider specific in vivo treatment situations in this study, it might be possible to simulate in vivo situations by converting these experimental parameters. We used talaporfin sodium in this study, but this method should also work with other photosensitizers that participate in type-II reactions. A limitation of this application is that the accuracy in this study for hemolysis is around 10%, so it is not useful for sensitive hemolysis evaluations.
Moreover, since this system can reveal the oxidative progression of the hemoglobin protein by the PR simultaneously with information about the oxygen saturation, we believe that our system can be useful for comparative studies of photosensitizer efficacy.
Limitations
In this study, we only used rabbit RBCs, low-HCT samples without albumin, and just one photosensitizer. However, based on the similarity of RBCs between species, the high molar ratio of the photosensitizer versus RBCs, and the similarity of the photosensitizers that participate in type-II reactions, we believe that the principles of our method are widely applicable. The accuracy of the estimation of the hemoglobin concentrations obtained by our measurement system was not confirmed by any alternative methods.
Conclusions
We determined the dynamics of the oxidation and oxygen desorption of hemoglobin, as well as RBC hemolysis, during the PR. Our measurement system, which uses the properties of hemoglobin contained in RBCs, might be useful for the continuous monitoring of the reaction dynamics.
Footnotes
Acknowledgments
This work was supported, in part, by the Japanese Agency for Medical Research and Development (16im0210204h0002). We thank Louis R. Nemzer, PhD, from Edanz Group (
Author Disclosure Statement
No competing financial interests exist.