




Abstract
Objective and background:
Different surface treatments have been tested in composite repair studies. However, there is still no consensus on the most effective repair protocol. The aim of this study is to measure the roughness values of eight different surface treatments for the repair procedure, to examine the effect of each surface treatment and three different composites on the repair bond strength with and without silane, and to evaluate whether there is a correlation between bond strength and roughness.
Methods:
The blocks were prepared with Filtek Z550 (3M ESPE) for the roughness measurements and divided into eight groups according to surface treatments. The roughness values of the surface treatments were measured by a 3D scanning contact profilometer (Nanomap LS). For the shear test, further samples were prepared, aged, and divided into three subgroups for the repair procedure with Filtek Z550 (3M ESPE), Vertise Flow (Kerr, USA), and G-aenial Flo (GC, Japan) after the surface treatments. Then, the shear test was performed. The Kruskal–Wallis and Spearman's Correlation tests were used for statistical evaluation of the data.
Results:
Significant differences were found between surface treatments and composite resins in terms of bond strength (p < 0.05). There is no correlation between the roughness and bond strength values.
Conclusions:
In bond strength, surface topography is more important than the numerical value of roughness. In the repair of composite restorations, methods that are already in clinical practice and more practical can be used instead of methods that require additional costs and devices.
Introduction
Composite resins, which have been used as an alternative to amalgam for the last 40 years, have become more comparable with amalgam in terms of their longevity in the mouth by increasing success rate with the improvements in materials, techniques, and instruments over time. 1 Despite all these improvements, secondary decay, microleakage, abrasion, marginal cavitation, fracture, and coloration of composite resin restorations have not been fully eliminated yet. 2 Restoration defects due to these reasons are the most common clinical problems. Repetition of defect restorations constitutes half of the general dental practices. 3 Defect restorations especially made by another dentist are likely to be renewed. Bogacki et al., in their study on more than 300,000 patients, reported that amalgam and composite restorations stayed in the mouth for more than 5 years at a rate over 90%, but when the patients changed their dentists, this rate decreased to 60%. 4 In another study that covers 10,000 restorations of 197 dentists in the United States and Scandinavian countries, complete renewal was preferred to repair in more than 75% of the restorations with localized defects. 5
When the restoration is completely renewed, the healthy tooth tissue is removed together with the defect area and the remaining tooth structure weakens. This leads to a shortening of the lifetime of the restoration. Compared to the renewal, the repair of restoration has advantages such as preservation of tooth structure, the necessity of local anesthesia and reduction of adjacent tooth damage, short application time, and low cost. 6
The success of the repair procedure depends on the properties of the old material, the procedures to be applied to the surface, and the new restorative material. 7 Normally, the bonding between the two composite layers occurs with the nonpolymerized oxygen inhibition layer. 8 Aging and water absorption negatively affect bonding by removing the oxygen inhibition layer and reducing the unsaturated double carbon bonds. 9 Therefore, various surface treatments are applied to increase bonding between the old and the new composite. Mechanical and/or chemical surface treatments such as bur, air abrasion, sandblasting, laser, and the use of adhesives have been tested in composite repair studies. However, there is still no consensus on the most effective repair protocol. 10,11
During the surface treatments, roughness in different shapes and degrees depending on the method applied occurs on the surface of the old composite. There are very few studies that examine the relationship between this roughness and bond strength. In addition to the properties and surface treatments of the old restorative materials, a new restorative material to be applied is also important for the repair procedure. 12 The repair procedure with a different composite may affect bonding in the restoration-repair interface. 13,14 Further, it is often not possible to know the brand and content of the old composite resin.
The aim of this study is to examine the effect of surface treatments and the amount of roughness they form in the repair of an aged nanohybrid composite on the bond strength with the use of three different composites, one of which is the same as the old composite. Accordingly, our null hypotheses are as follows:
H01: The use of different surface treatments and repair composites does not affect repair bond strength.
H02: There is no correlation between roughness and repair bond strength.
Materials and Methods
The materials used in our experiments and their contents are presented in Table 1.
Materials Used in This Study
BisEMA, bisphenol A ethoxylate dimethacrylate; Bis-GMA, bisphenol-A-diglycidyl methacrylate; BisMEPP, 2,2-bis (4-methacryloxy ethoxy phenyl) propane; CQ, camphorquinone; GPDM, glycerol phosphate dimethacrylate; HEMA, 2-hydroxyethyl methacrylate; MDP, 10-methacryloyloxydecyl dihydrogen phosphate; TEGDMA, triethyleneglycol dimethacrylate; UDMA, urethane dimethacrylate.
Roughness test
Preparation of samples
Cylindrical Teflon molds with an inner diameter of 8 mm and a height of 4 mm were used for the preparation of composite blocks. Filtek Z550 (3M ESPE, St. Paul, MN) composite resin was placed into molds in 2 mm layers. Mylar strips were placed over the top and bottom surfaces of the uncured resin composite to prohibit the formation of an oxygen inhibition layer, and the excess material was extruded by condensing the mold in between two glass plates and polymerized with a halogen light source (Hilux Ultra Plus; Benlioğlu Dental, Ankara, Turkey) for 20 sec at a light intensity of 500 mW/cm2. After removing the mylar strips, the samples were irradiated for another 20 sec on their lower and upper surfaces. In this way, 32 samples were obtained. For polishing, the micromotor (Being Foshan, Guangdong, China) was set to 10,000 rpm. On both sides of the prepared samples, polishing was performed under water cooling with yellow rubbers (Reddish Stone, La Loggia, Italy) for 15 sec. Then, they were kept in 37°C distilled water for 24 h and prepared for thermal cycling.
Heat cycling was applied 5000 times to the prepared samples in the thermal cycling device (Gökçeler Makine, Sivas, Turkey). Thermal cycling was performed on the samples in the baths at 5°C and 55°C (±2°C), respectively, with a transfer time of 5 sec and a waiting time of 30 sec.
Application of surface treatments
After thermal cycling, the samples were randomly divided into eight groups according to surface treatments (n = 8). Both the top and bottom surfaces were also used for the roughness test.
Group 1 (Control): no procedures were performed on the samples in this group.
Group 2 (Bur): each surface was abraded five times using a 2-mm-diameter diamond fissure bur (837314111534012C; M&A Diatech, Heerbrugg, Switzerland) under water cooling. After every four samples, the bur was replaced with a new one in case of grain abrasion.
Group 3 (Bur+silane): bur application was performed as in the previous group. After roughening with the bur, a thin layer of silane (BIS-Silane; BISCO, Inc., Schaumburg, IL) was applied to each sample, and they were kept for 30 sec according to the manufacturer's instructions. The samples were dried with air spray for 5 sec.
Group 4 (Al2O3): the samples were roughened with an air abrasion device (Kavo Rondoflex 360; KaVo Dental GmbH, Biberach, Germany) using 2.5 bar air pressure and Al2O3 powder with 50 μm particle size (Kavo; KaVo Dental GmbH) under water cooling. The spray head was held at a right angle to the samples at a distance of 5 mm. The roughening time was limited to 5 sec.
Group 5 (Al2O3+silane): the Al2O3 application was performed as in the previous group. Silane application was started immediately after the roughening of each sample. After a thin layer of silane was applied according to the manufacturer's instructions, the samples were kept for 30 sec and dried for 5 sec with air spay.
Group 6 (Cojet): by using silica coating (Cojet; 3M ESPE AG ESPE Platz Seefeld, Germany), powder with 30 μm particle size (Cojet Sand; 3M ESPE AG ESPE Platz) produced by the same company specifically for the device was sprayed with 2.5 bar air pressure. The spray head was held at a right angle to the surface of samples at a distance of 5 mm. The roughening time was limited to 5 sec. Silane was applied to each sample immediately after roughening. As in the other groups, silane was applied as a thin layer, kept for 30 sec, and dried for 5 sec with air spray.
Group 7 (Laser): in Er:YAG laser application (Smart 2940D Plus; Deka Laser, Florence, Italy), the parameters were determined as 150 mJ energy level, 10 Hz frequency, and 700 ms long shot. It was applied for 10 sec at the distance of 10 mm.
Group 8 (Laser+silane): samples were roughened with the Er:YAG laser as described above. Silane was then applied as a thin layer, kept for 30 sec, and dried for 5 sec with air spray.
Roughness measurements
The roughness measurements of the samples were made by a 3D scanning contact profilometer (Nanomap LS; Aep Technology). Measurements were taken from three separate points of each surface. The average was calculated as the roughness value.
Shear bond strength test
Preparation of samples
Cylindrical Teflon molds with a diameter of 6 mm and a height of 8 mm were used to prepare composite samples to be aged and repaired. Filtek Z550 was placed into the molds as four layers of 2 mm in thickness. After polymerization and polishing were carried out as described above, the samples were kept in 37°C distilled water for 24 h. They were then subjected to 5000 thermal cycles.
Application of surface treatments
For bond strength test, 192 aged samples were prepared. Samples were divided into eight groups according to the surface treatments. Then each group was divided into three subgroups to be repaired with three different composites (n = 8).
Repair of composites
Each group was divided into three subgroups (n = 8) and repaired with three different composites (Filtek Z550, G-aenial Flo, and Vertise Flow) (Fig. 1). While another adhesive system was not used for the self-adhesive composite resin, Vertise Flow, the adhesive resin SE Bond (Kuraray, Japan), was applied to the repair surface before the placement of Filtek Z550 and G-aenial Flo. For this purpose, the primer was first applied to the surface, kept for 20 sec, and then dried. Then, the adhesive resin was applied and polymerized for 10 sec.
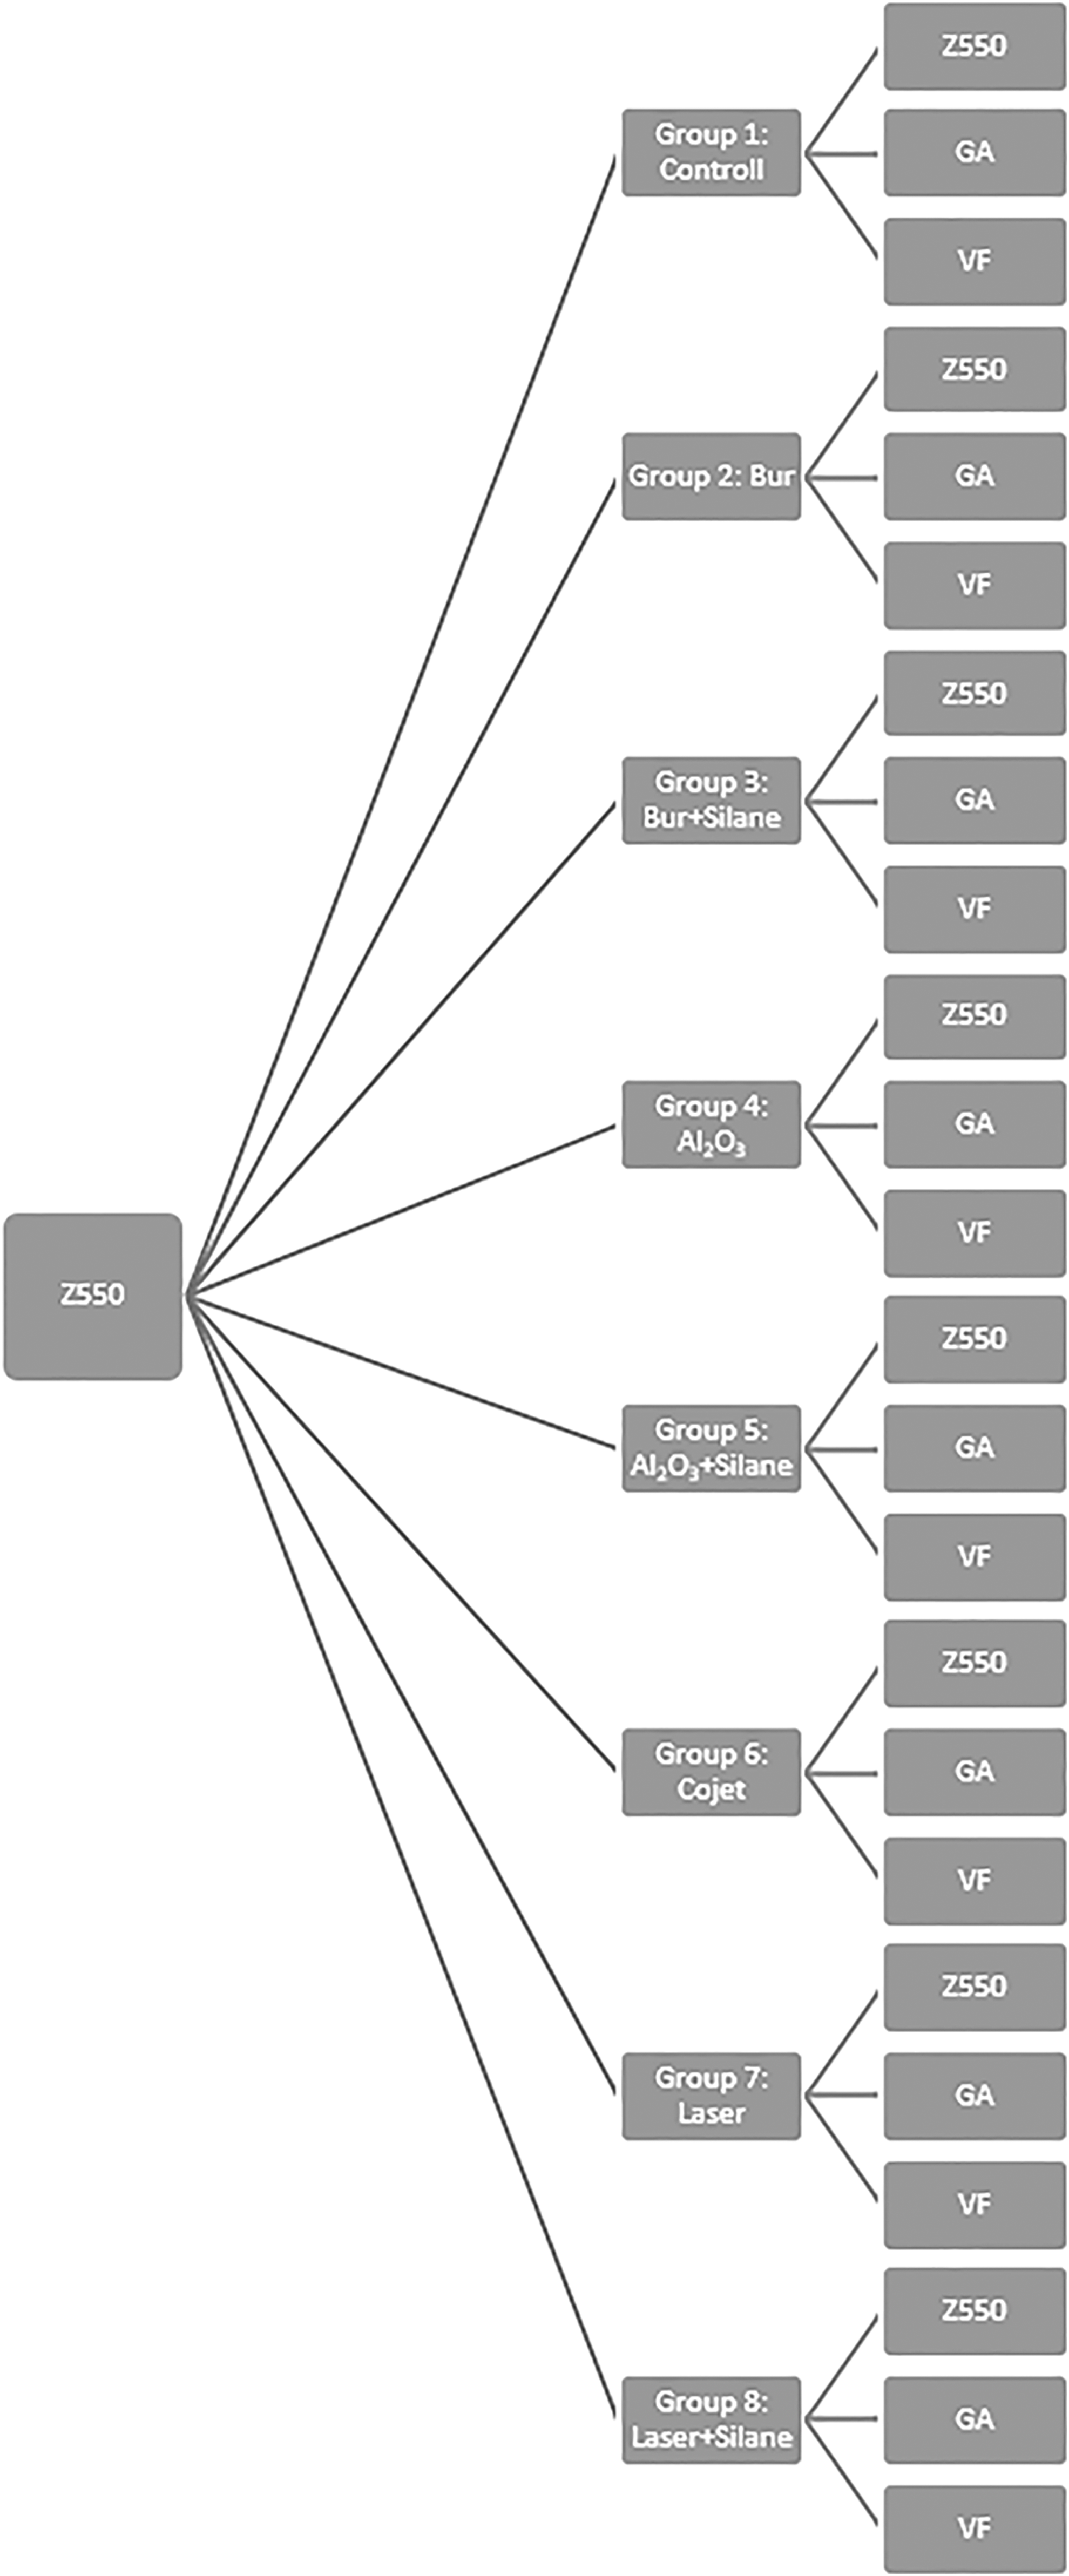
Schematic study groups. Z550, Filtek Z550; GA, G-aenial Universal Flo; VF, Vertise Flow.
After the application of adhesive, repair composites were applied to the middle of the surface prepared for the repair procedure with the help of cylindrical transparent polyethylene molds with an inner diameter of 3 mm and a height of 2 mm (Fig. 2). The composite materials were then polymerized for 20 sec. Following polymerization, the transparent matrix was carefully cut out by means of a scalpel. Composite samples were kept in distilled water at 37°C for 24 h before the shear bond strength test.
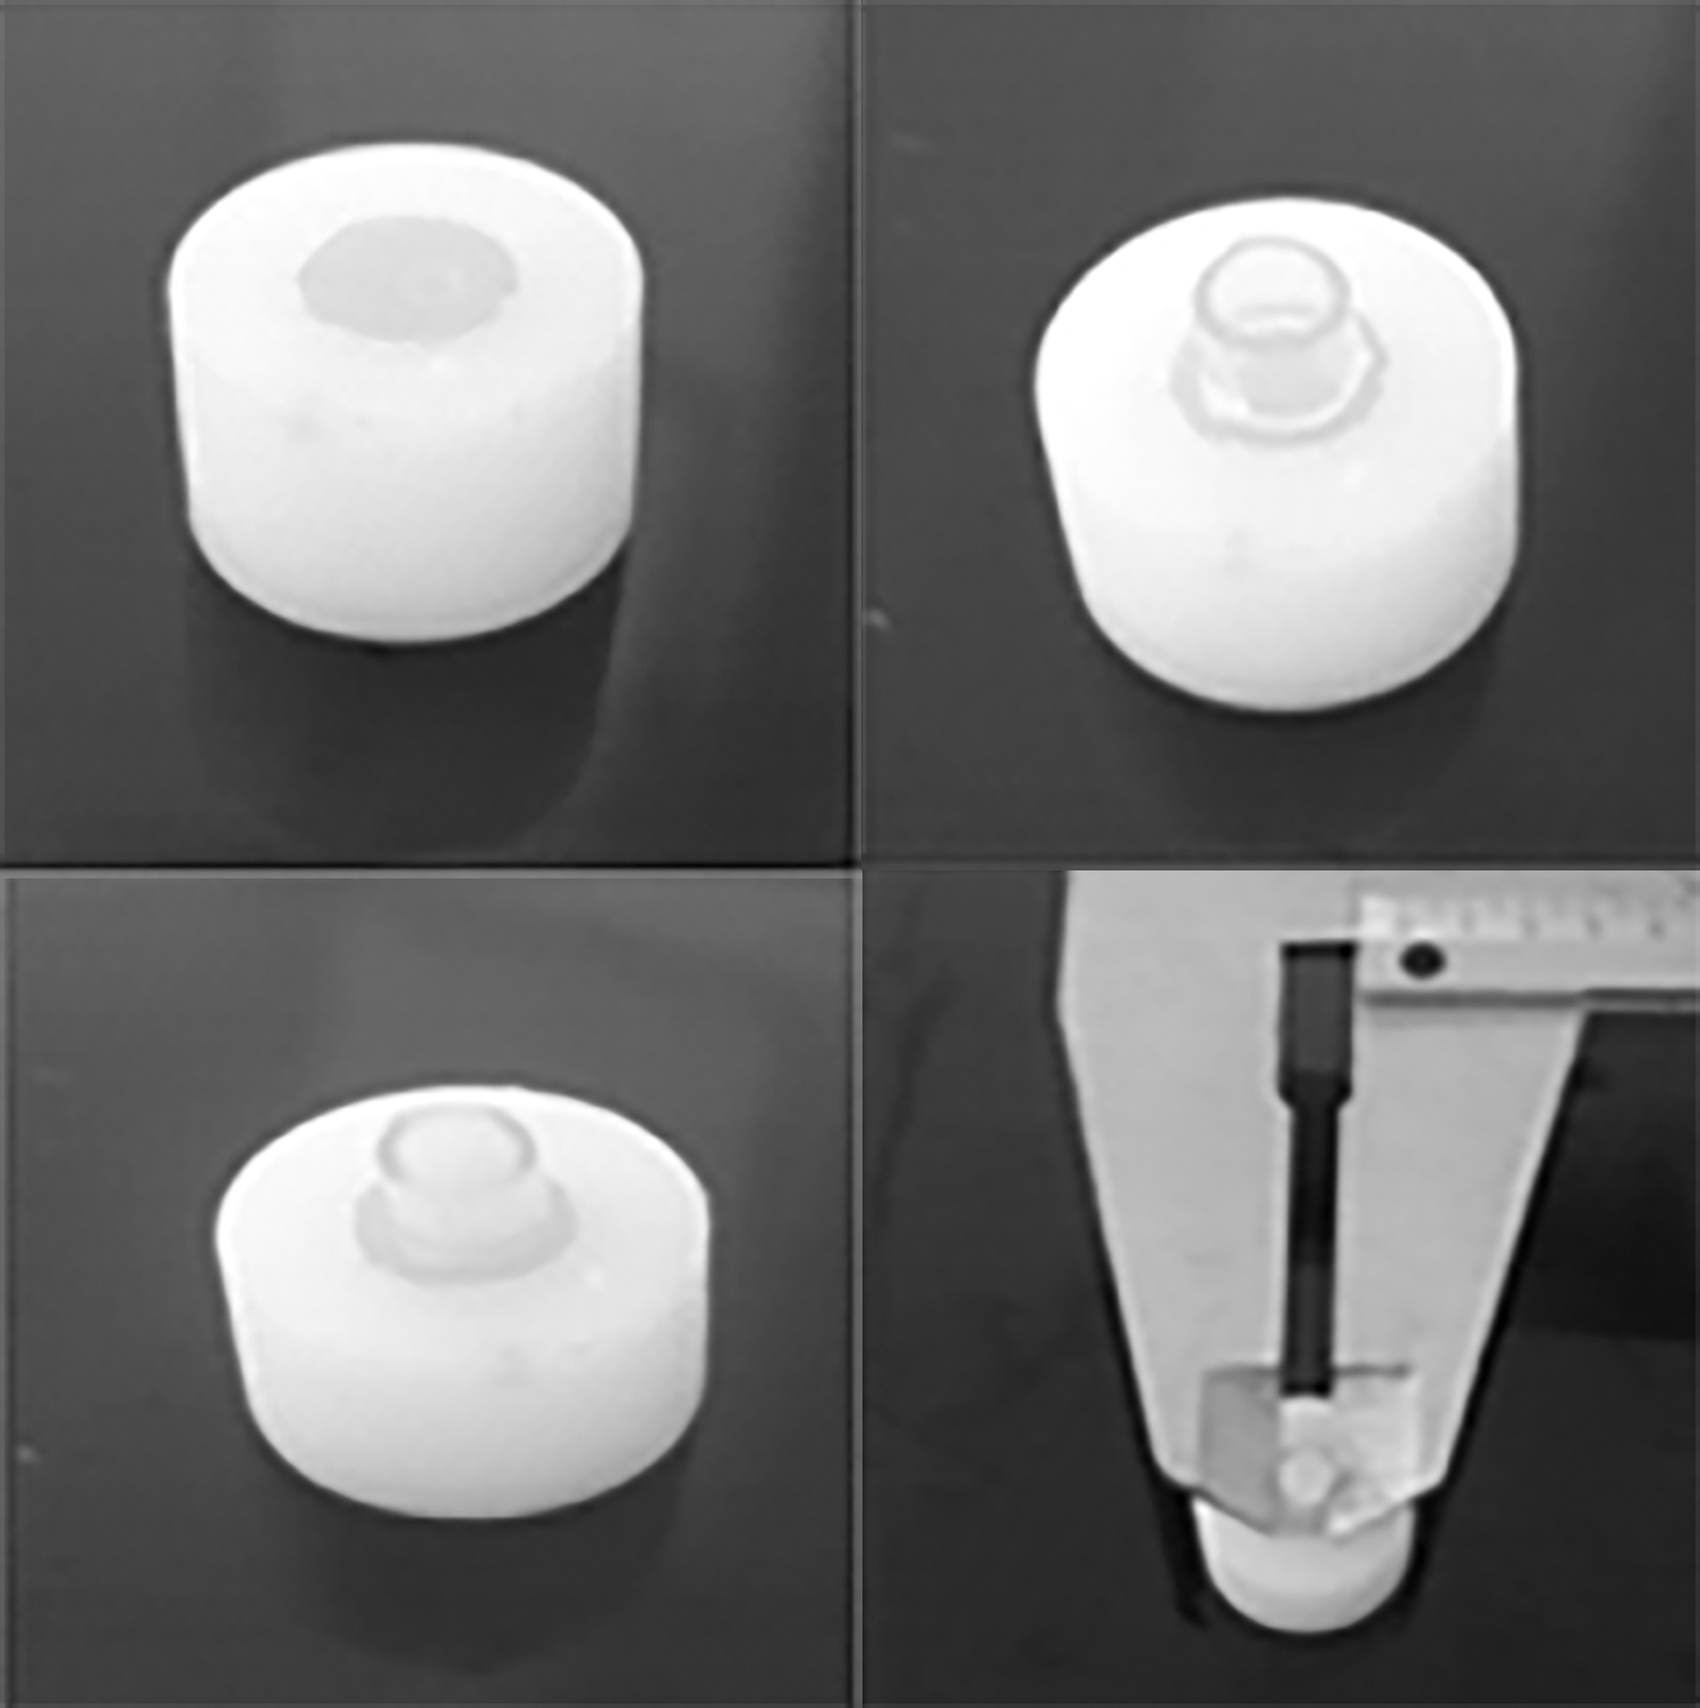
Images of shear test samples.
Shear bond strength test
The shear bond strength test was performed using the Universal Test device (LF Plus, LLOYD Instrument; Ametek, Inc., England). A portable breaking apparatus to be used in the test was prepared in the lathe as 1 mm thick and blunt, as specified in ISO TR 11405 specifications. The breaking apparatus was placed on the bonding line of the old and new composite. Samples were subjected to the shear bond strength test at a head speed of 1 mm/min. The forces in the breaking process were measured in Newton (N), and the load per unit area was converted from Newton (N) to Megapascal (MPa) by using the following formula:
Examination of breaking surfaces
After the shear bond strength test, the breaking surfaces of all composite samples were examined at 40 × magnification under a self-illuminated stereo microscope (SMZ 800; Nikon, Tokyo, Japan). Breaking types are as follows:
Adhesive breaking: complete separation of the repair composite from the composite substructure and the bonding surface
Cohesive breaking in restoration: complete breaking of the restoration composite from the inside
Cohesive breaking in repair composite: complete breaking of the repair composite from the inside
Mixed-type breaking: both types of breaking observed together (adhesive + cohesive).
Statistical analysis
Data were analyzed using the SPSS for Windows 11.5 packaged software. The conformity of the distribution of continuous variables with the normal distribution was examined by the Kolmogorov–Smirnov test, and the homogeneity of variance was examined by Levene's test. Descriptive statistics were presented as median (interquartile range).
The significance of the difference between the groups was examined by the Kruskal–Wallis test. When the results of the Kruskal–Wallis test statistics were found to be significant, Conover's nonparametric multiple comparison test was used to determine the situation(s) causing the difference. Whether there was a statistically significant relationship between roughness and shear bond strength was examined using Spearman's correlation test.
Unless otherwise specified, results were considered statistically significant for p < 0.05. However, in all possible multiple comparisons, the Bonferroni correction was performed to check the type I error.
Results
Results of the roughness test
The difference between surface treatments was statistically significant. Group 3 (bur+silane) showed the highest roughness value, while Group 1 (control) showed the lowest roughness value. There is a statistically significant difference between Group 1 (control), Group 4 (Al2O3), Group 5 (Al2O3+silane), and Group 6 (Cojet), as well as between Group 2 (bur), Group 3 (bur+silane), Group 7 (laser), and Group 8 (laser+silane) (p < 0.05) (Table 2). In other words, the difference between 1, 4, 5, 6, and 2, 3, 7, 8 is significant. Macroscopic and 3D scanning contact profilometer images of surface treatments are presented in Fig. 3.
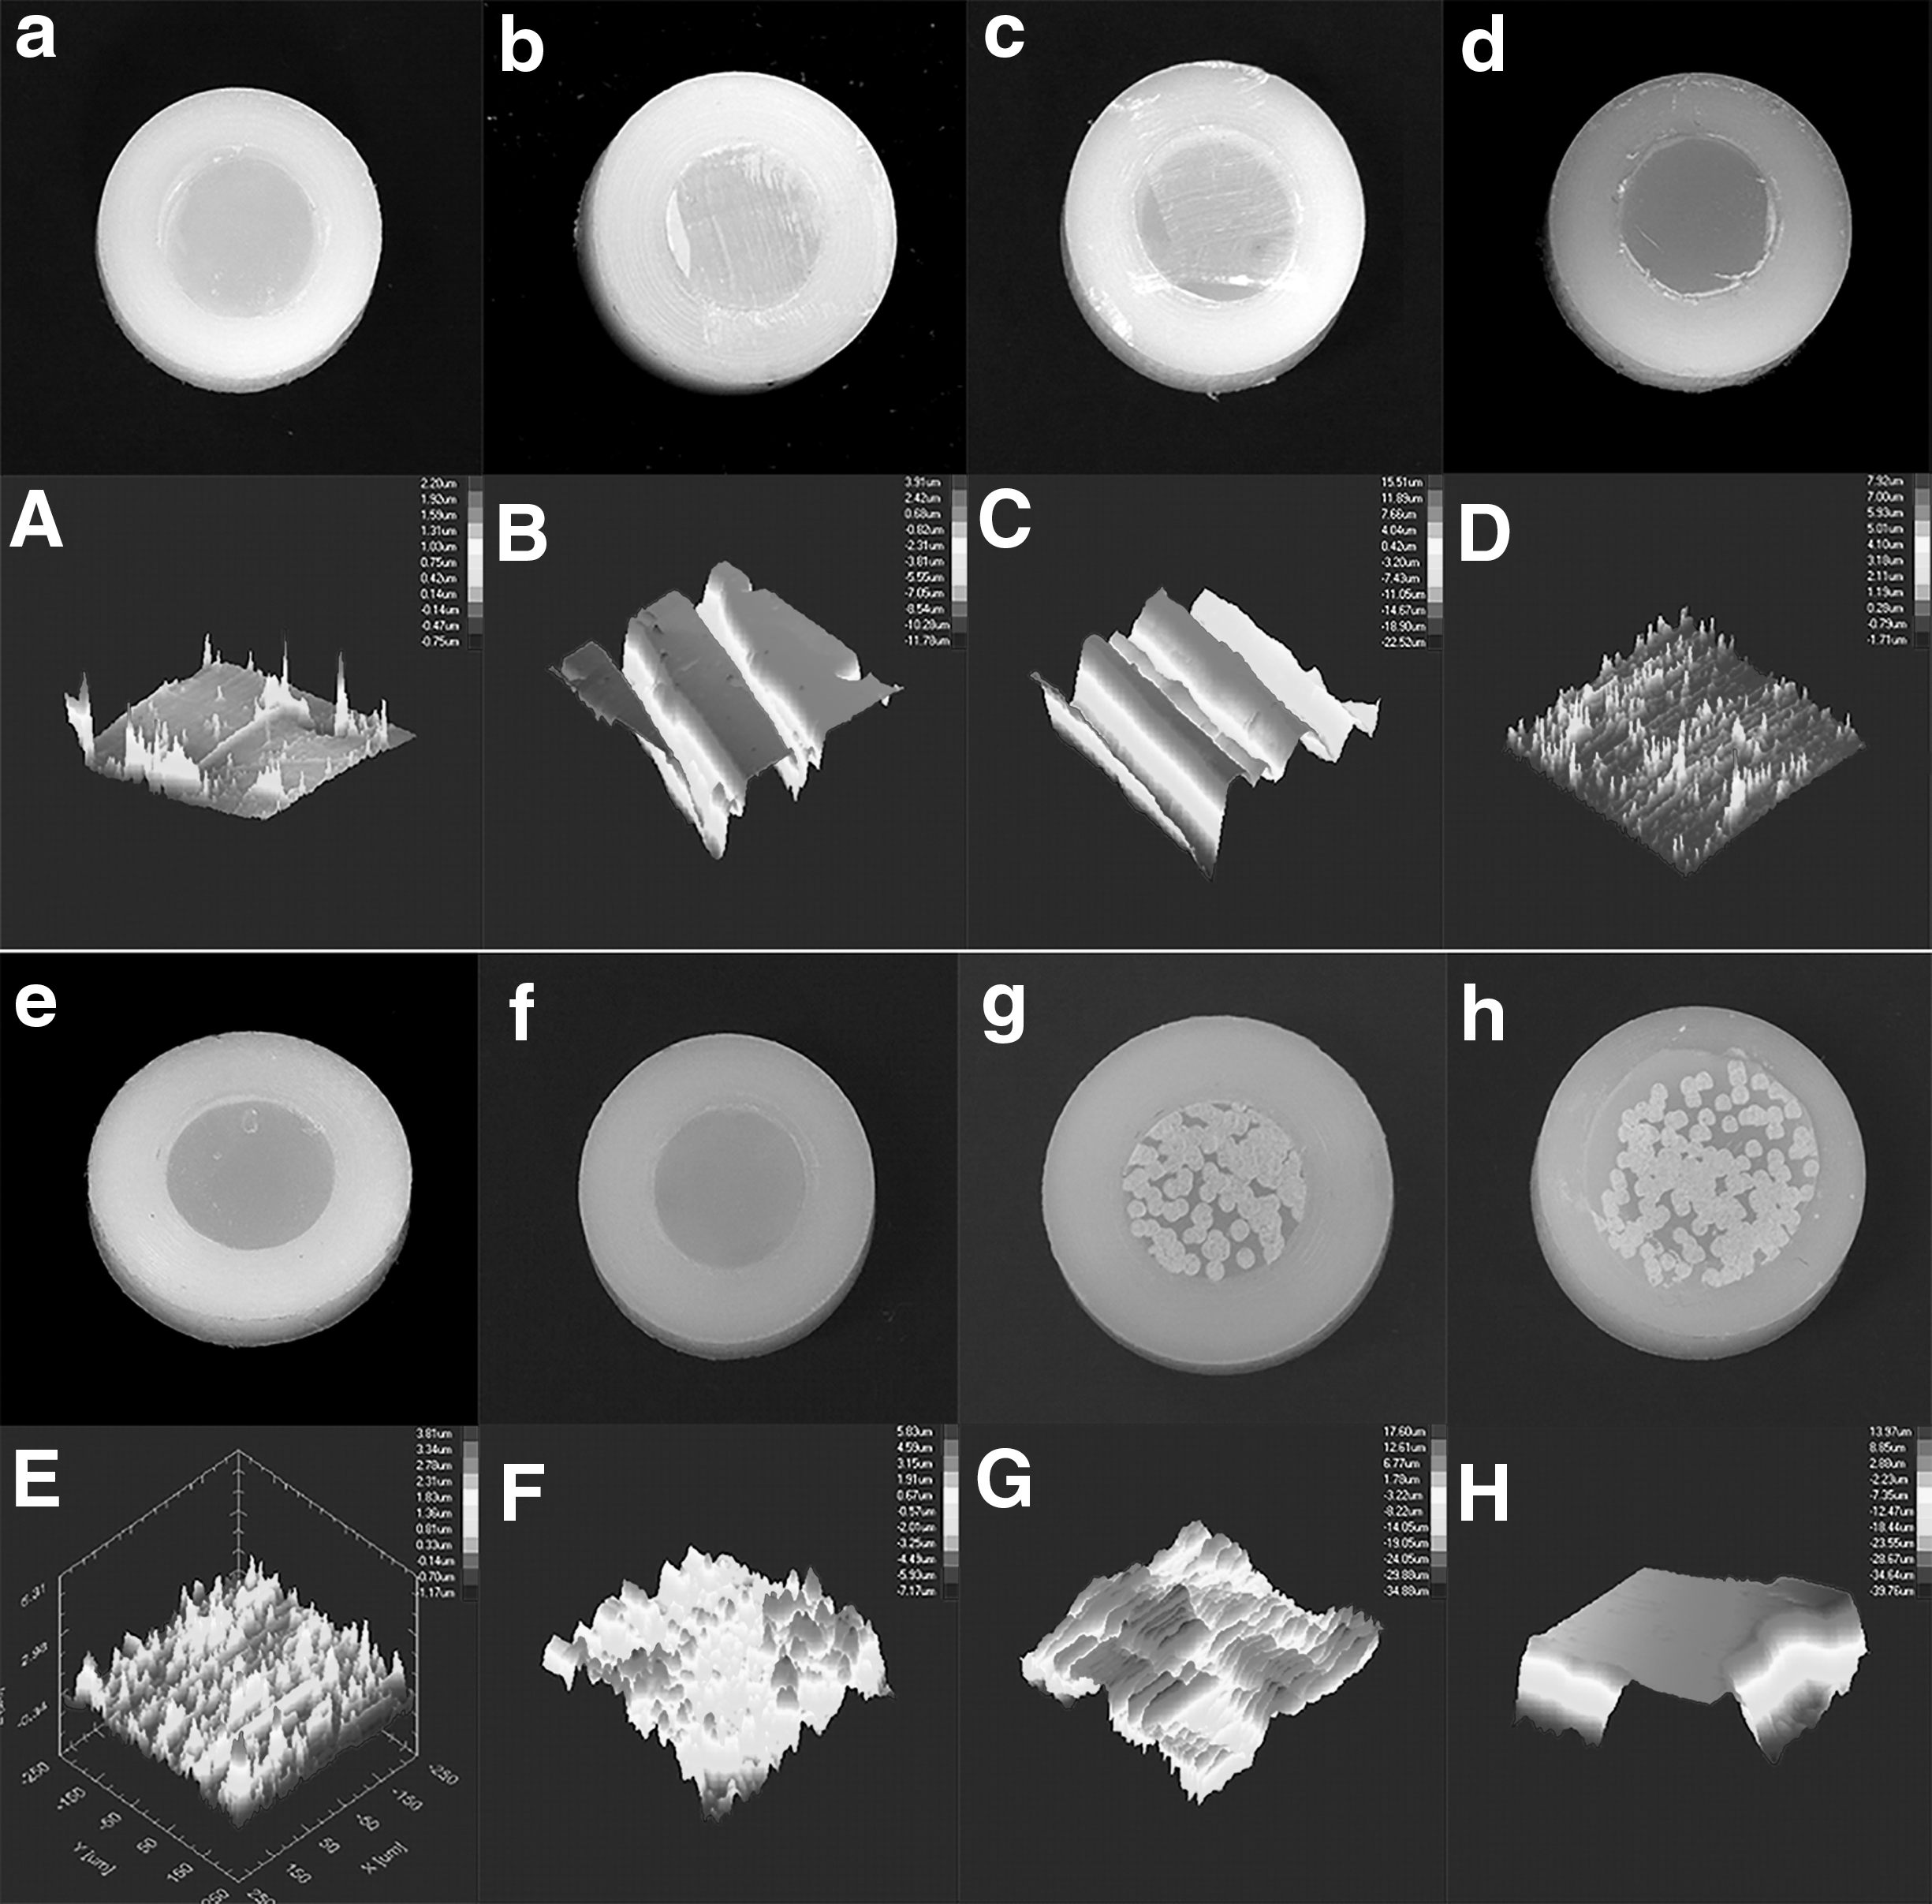
Images of samples after surface treatment (lower cases), 3D images of surfaces (upper cases). Aa, control; Bb, bur; Cc, bur+silane; Dd, Al2O3; Ee, Al2O3+silane; Ff, Cojet; Gg, laser; Hh, laser+silane.
Surface Roughness Mean and Standard Deviation (Ra)
Different capital letters in columns indicate statistically significant difference (p < 0.05).
Results of the shear bond strength test
The data of the groups and the statistical evaluations are presented in Table 3. When composite materials were compared between each other for each surface treatment, differences in group 1 and group 8 were found to be significant (p < 0.05). The highest bond strength in group 1 was shown by Z550+GA and the lowest bond strength was shown by Z550+VF, whereas the highest bond strength in group 8 was shown by Z550+Z550 and the lowest bond strength was shown by Z550+VF.
Shear Bond Strengths (MPa, Mean ± Standard Deviation) of the Repair Composites on Old Composite Depending on the Different Surface Treatments
For each surface treatment. The results were statistically significant for p < 0.00625 according to the Kruskal–Wallis test and the Bonferroni correction. In the comparison of surface treatments for each composite material, results were considered statistically significant for p < 0.017 according to the Kruskal–Wallis test and the Bonferroni correction. The difference between surface treatments indicated in different capital letters in the same column was considered statistically significant (p < 0.017), while the difference between the materials indicated in different lowercase letters in the same line was considered statistically insignificant (p < 0.00625).
GA, G-aenial Universal Flo; VF, Vertise Flow.
The difference between the Z550+GA and Z550+VF groups is statistically significant when the surface treatments for each composite resin are compared between each other (p < 0.05). The highest value between the groups belongs to the Z550+Z550 subgroup in group 6, and the lowest value belongs to the Z550+VF subgroup in group 8.
Correlation analyses
There was no statistically significant correlation between surface roughness and bond strength (Table 4) (r = 0.089 and p = 0.236).
Correlation Analysis Results
Failure mode results
When the failure modes of the test samples were examined under the light with a stereo microscope (Nikon), adhesive breaking, cohesive breaking in the restoration material, cohesive breaking in the repair material, and the mixed-type breaking were determined. The failure mode distribution is presented in Fig. 4.
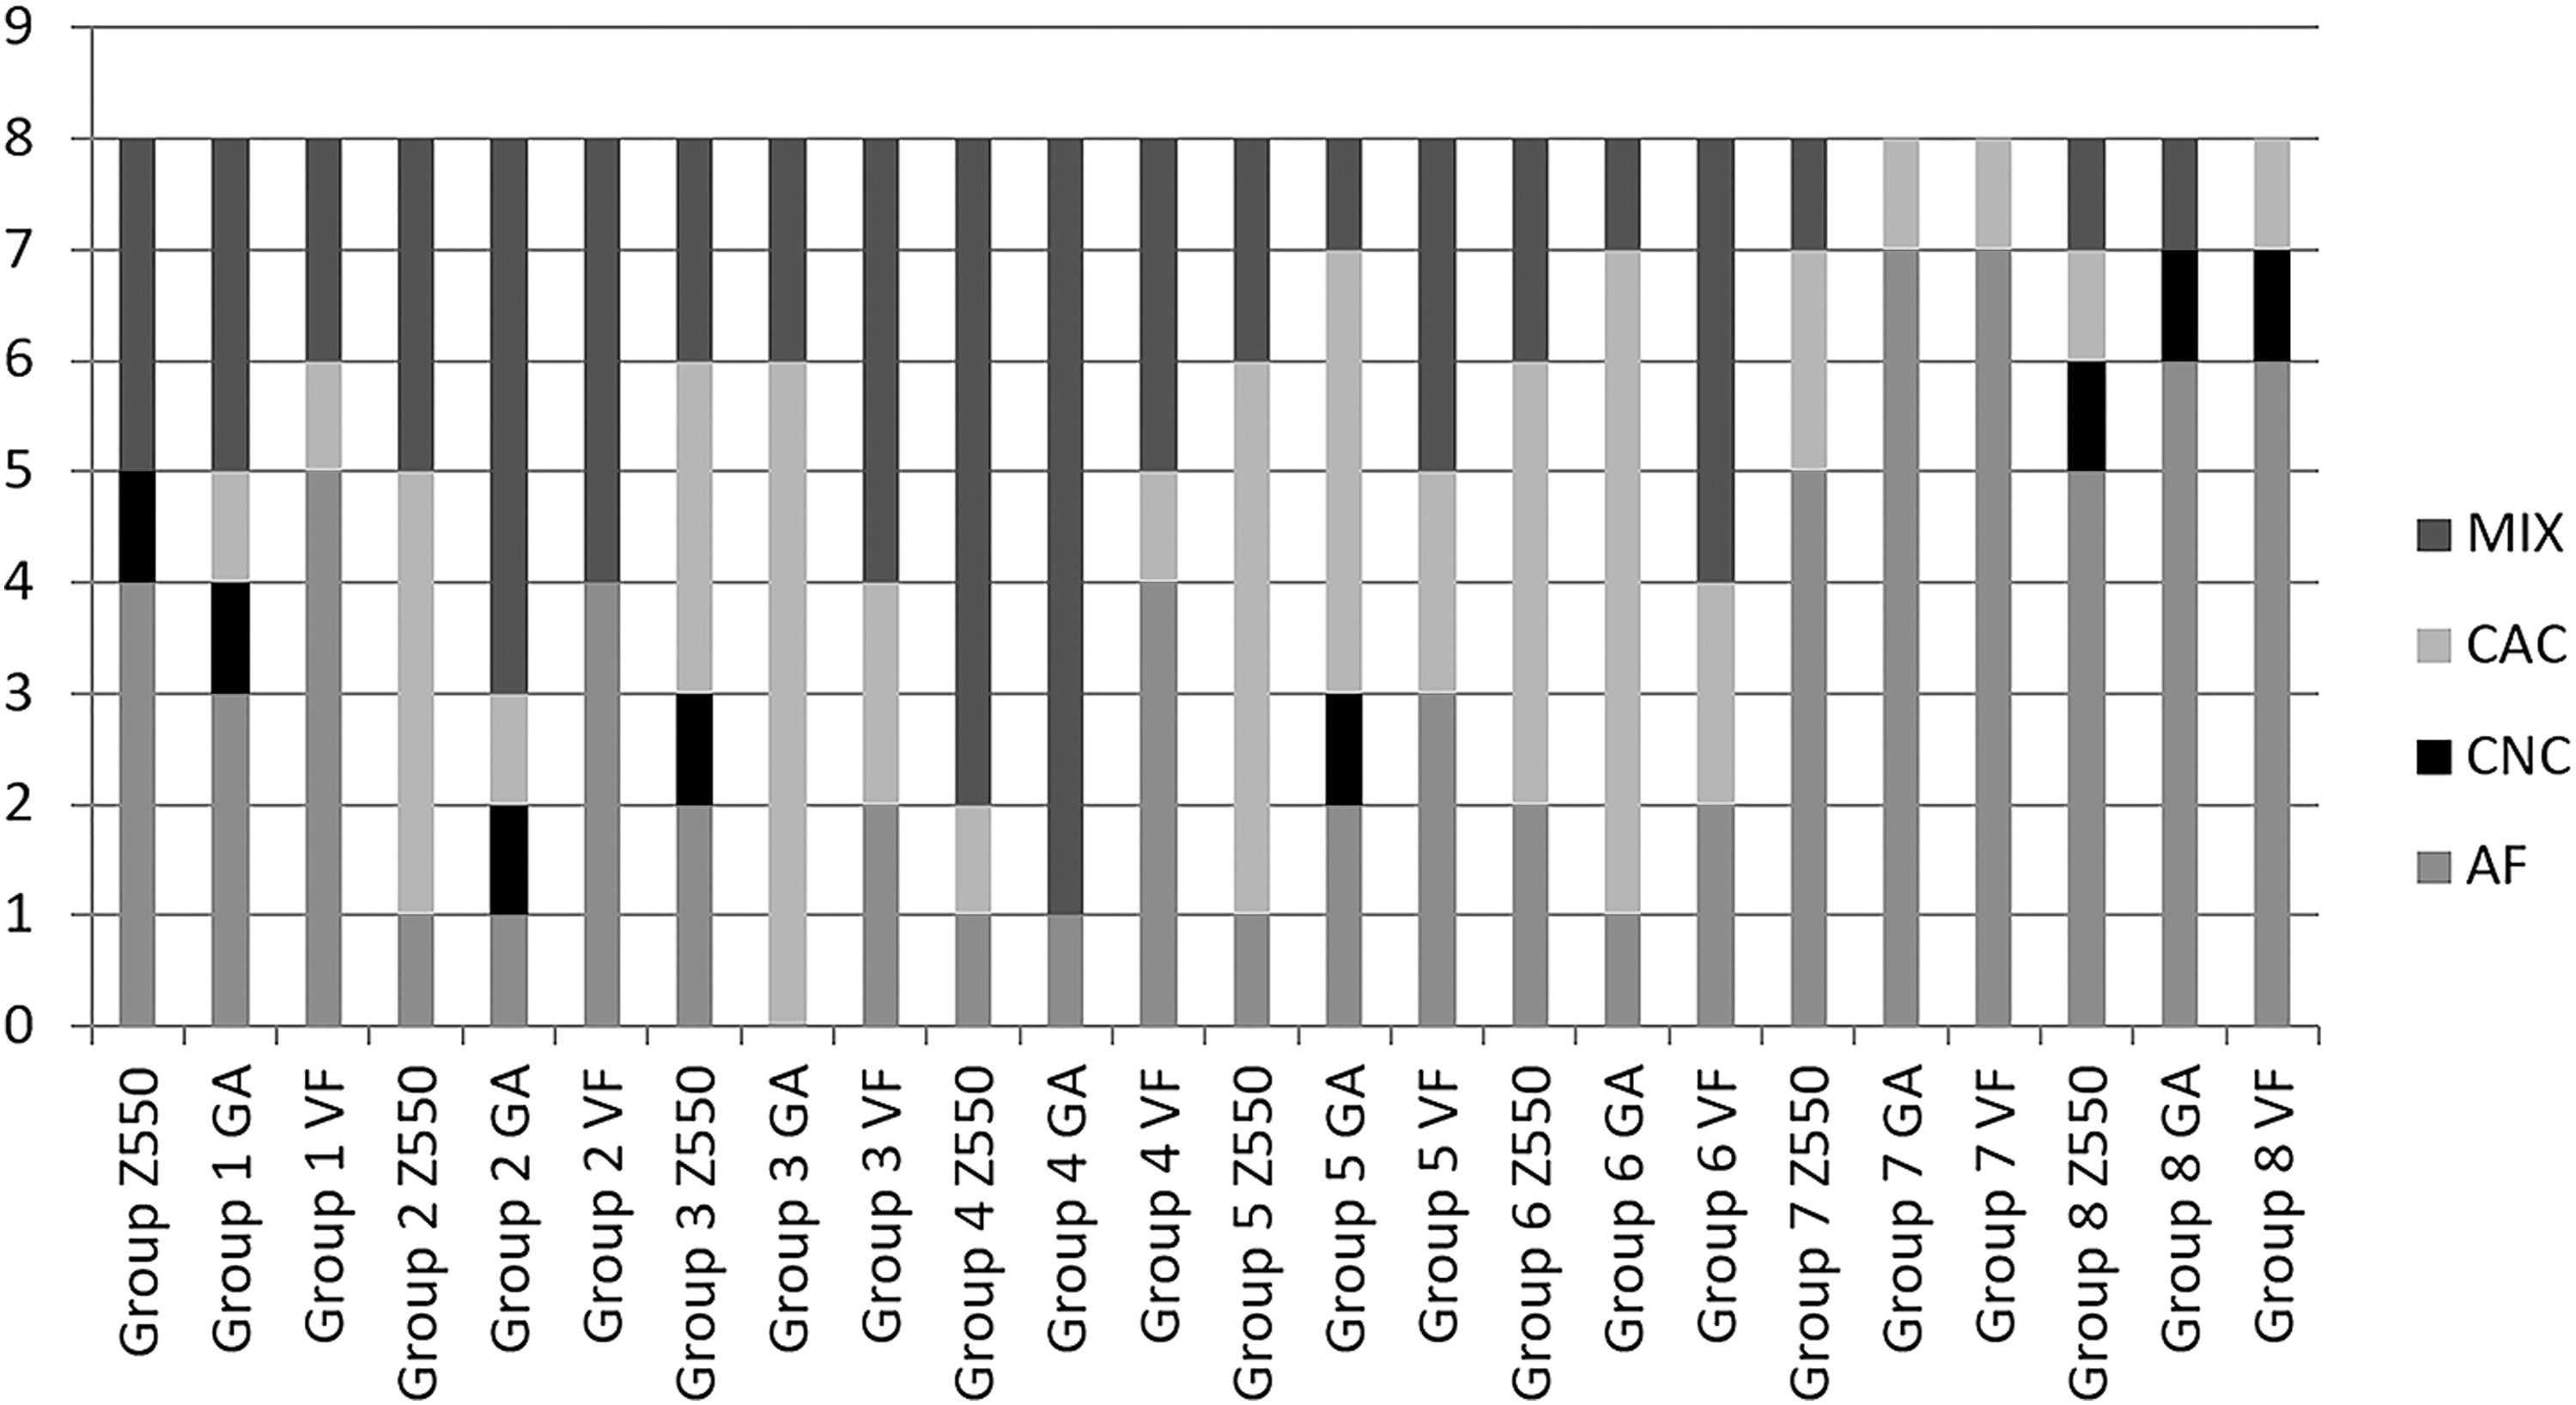
Failure modes of the groups. AF, adhesive failure; CAC, cohesive failure in aged composite resin; CNC, cohesive failure in new composite resin; MIX, mixed failure.
Discussion
According to our results, there was a difference in terms of roughness between surface treatments. While Group 2 (bur), Group 3 (bur+silane), Group 7 (laser), and Group 8 (laser+silane) showed relatively higher roughness values, Group 1 (control), Group 4 (air abrasion with Al2O3), Group 5 (air abrasion with Al2O3+silane), and Group 6 (Cojet) showed relatively lower roughness values. The difference between the groups with high and low results was statistically significant.
In a study examining the effect of surface treatments on the roughness and bond strength, surface roughness values were sorted in a decreasing order as follows: Er:YAG laser, diamond bur, silica coating, and air abrasion with Al2O3, respectively. 15 In addition, on four different surface treatments with adhesive and/or silane combination, Rodrigues et al. concluded that air abrasion with Al2O3 and silica coating groups showed similar roughness values. 16 Likewise, the roughness values of the two groups mentioned in our study and their combinations with silane were similar. The relatively lower values of the air abrasion with Al2O3 and silica coating groups can be explained by the fact that abrasive powders are of the micro sizes.
When the effect of surface treatment and repair composites on the shear bond strength is evaluated, there is a difference between the groups. In this case, our first null hypothesis, which was “The use of different surface treatments and repair composites does not affect the shear bond strength.,” was rejected.
The difference between repair composites in the control group is statistically significant. This difference is significant in that repair composites showed the bonding effects because no surface treatment was applied to the samples. The lowest value belongs to Vertise Flow and the highest value belongs to G-aenial Flo.
According to literature, there are very few studies that examine the bond strength of Vertise Flow to different composite resins; 17,18 however, there are a large number of studies that examine the bond strength of this material to dentin. Vertise Flow was found to be more unsuccessful than other materials in most of these studies. 19,20
The bonding mechanism of Vertise Flow takes place in two ways. The first one is the chemical bond formed by the phosphate group in the GPDM (glycerol phosphate dimethacrylate) adhesive monomer through binding to the calcium ions in the tooth. The second one is the micromechanical bond formed by polymerized monomers, which can diffuse into the collagen network by the etching effect of phosphate groups that it contains. 21 Since Vertise Flow is applied to the resin in our study, these bonding mechanisms may not have occurred. The hydrophilicity of the GPDM in its content is a monomer with a high-power etching effect. Hydrophilic monomers of self-adhesive materials are more prone to water absorption than conventional composites. This causes the matrix to swell and the polymer chain to break, 22 which undermine the mechanical properties of self-adhesive composites. Thus, after aging methods such as thermal cycling, composite-to-composite bond strengths may be reduced. 23
Another composite we chose for the repair procedure is G-aenial flo, which is a high-filler fluid composite and can be easily used in the posterior section. 24 It showed a higher bond strength than Filtek Z550 in the control group. We think that the fluidity of G-aenial Flo provides surface wetting 25 as well as the ease of manipulation, reduces the formation of air bubbles, and thus increases the bond strength.
In groups 2–7 (bur, bur+silane, Al2O3, Al2O3+silane, Cojet, and laser), no difference in repair composites (Filtek Z550, G-aenial Flo, Vertise Flow) did affect the bond strength. This demonstrates the importance of surface treatment in repair bond strength. In group 8 (laser+silane), the difference in repair composite significantly affected the bond strength. The use of silane decreased the roughness value in the laser group, although it was not statistically significant. El Askary et al. also stated that silane can form a thick interface layer in the repair procedure. 26 This situation reduced micromechanical bonding, revealing the composite-to-composite interaction and the effect of the adhesive use on bonding. Vertise Flow showed the lowest bond strength value in this group.
In the evaluation of the effect of surface treatments on the bond strength of composite resins, when the Filtek Z550 was used as a repair composite, there was no significant difference between eight surface treatments. This may be due to the fact that the repair composite was the same as the old composite and therefore the composite-to-composite interaction was better. 27
When G-aenial Flo and Vertise Flow were used, a significant difference was found between the eight surface treatments. In both composites, Group 7 (laser) and Group 8 (laser+silane) showed the lowest bond strength. Since the debris, formed in conventional methods, is not caused by laser irradiation, it is expected that bonding will increase with laser applications. However, the laser groups showed the highest results in terms of roughness and lowest results in terms of bond strength in all three composites. Roughness-bond strength contrast relationship in laser studies has also been shown in previous studies. 15,28
In parallel with the results of our study, Daphne et al. found out that the Er:YAG laser was unsuccessful compared to other surface treatments. They held the free particles and the microcracks in the resin matrix after the laser irradiation responsible for the result. 29
In our study, when we examined the profilometer images, there were regular recurrent indentations and protrusions in the form of fissures in parallel with the previous studies (Image10–11). 30,31 This uniform roughness is undesirable for mechanical bonding. 30
There are also studies that do not coincide with our results regarding the laser applications. Burnett et al. found out that the effect of the Er:YAG laser on the bond strength at the 200 mJ energy level in indirect composites was stronger compared to the air abrasion method. 32 In the study, it was stated that more concentrated waves were formed by the additional sapphire tip of the laser unit, the energy density could increase without this tip, and material deterioration could occur due to excessive heat. Eren et al. found no differences in the microshear bonding values between four different surface treatments (diamond bur, phosphoric acid, diamond bur+phosphoric acid, and Er:YAG laser) in the microhybrid composite repair. 33 These contradictory results may be related to the chemical structure of the old and new composite and to different laser parameters. 34 As a result, in our study, the laser has high roughness value and has the lowest results in terms of bond strength. In our correlation analyses, no correlation was found between roughness and bond strength. Regarding the bond strength, the character of the surface roughness is more important than its numerical value.
In many studies, the contribution of the bur to bonding was found to be higher than the laser. 35,36 It was reported that the laser creates macroretentive areas due to the particle breakage and melting in the organic matrix, 37 while the bur creates macroretentive and microretentive areas. 35
The bur groups showed reliable bonding values in all repair composites, including Vertise Flow, although not in parallel to their roughness values. This result is pleasing, considering the fact that the diamond bur is very economical in terms of time and cost, it is easily accessible and applicable, and it is the first choice of many dentists.
An alternative method of roughening the surface, the application of air abrasion, is the spraying of abrasive aluminum oxide (Al2O3) particles in the chamber inside the device through a narrow tube with the help of compressed air. 38
In the three composites we used, the effect of bur and air abrasion on bonding is similar. The effect of the air abrasion method on the surface is related to the microstructure, abrasion resistance, and composition of the material. 39 Accordingly, the results in the literature are also contradictory. In one study, 40 it was reported that air abrasion-treated surfaces were more suitable for bonding, whereas in another study, 41 it was reported that the bur provided a higher bond strength than air abrasion.
Air abrasion with silica coating is the spraying of silica-coated alumina particles under pressure by embedding them in the surface to obtain a chemically more reactive surface, and this is suggested as an effective method to increase the adhesion of resins to restoration. 42 Rodrigues et al. reported that in the samples they examined with SEM, in the silica coating method, there were smoother surfaces, but topographically more suitable surfaces for mechanical retention. 16 When we examine our profilometer images, in Group 6 (Cojet), the surface is smoother, but the roughness distribution is more frequent (Fig. 3F). The silica sprayed on the surface, in addition to abrading the surface, transfers energy to the surface to which it is applied, causing an increase in heat. This excites atoms and molecules, creating triboplasma forms and impregnating the surface with SiO2 to a depth of 15 μ, fused to the surface in islands. 16 In this way, chemical bonding is formed by the interaction between the monomers of the new composite and silica coating, while the mechanical locking is provided by the resin. 43 However, in our study, in three of the composite resins, there was no statistically significant difference between the bur, air abrasion with Al2O3, and air abrasion with silica coating in parallel with the previous studies. 44,45
In addition to mechanical preparation in the repair procedure, chemical agents such as adhesive and silane were also reported to increase bonding. 46 There are contradictory results in terms of silane in the literature. Researchers who state the positive effect of silane on bonding indicate that bond strength increases with chemical siloxane bond between resins and fillers. 47 Silane also increases surface wettability, facilitating the infiltration of adhesive resin. 48
In our study, there was no difference in terms of roughness and bond strength between the groups with and without silane application. Similar to these results, there are many studies reporting that silane does not increase the bond strength. 16,49,50 The ineffectiveness of silane in the bond strength can be caused by the thick interface layer and can also be explained by the relationship between silane and zirconium. 26 Silane does not react with zirconium. 51 In our study, Z550 contains zirconium filler in the composite resin. Therefore, it may not have contributed to bonding. Kaneko also emphasized that the composite should have a high filler content for silane to be effective. 50
Conclusions
Within our study,
The highest roughness values were found in the bur and laser groups, and the lowest roughness values were found in the control group. No correlation was found between bond strength and roughness values.
Silane application had no contribution to bonding.
The fact that the old and new composites were the same reduced the need for surface treatment.
The bur groups were able to exceed the reliable bonding values regardless of the repair composite. The contribution of air abrasion with Al2O3 and silica coating to the bond strength is similar to the bur groups in three composite resins. Routine clinical applications require the use of a bur. Further, it has advantages such as low cost, quick procedure, and ease of use for every dentist. Therefore, it is more preferable to use abrasion with a diamond bur in the composite resin repair compared to other methods that require additional cost and device and more time.
The laser groups showed the lowest bond strength values for each repair composite. Therefore, the Er:YAG laser may not be an ideal surface treatment in the composite resin repair.
Considering the acceptable bonding values (15–25 mpA) indicated by Teixeria et al., 52 Filtek Z550 and G-aenial Flo showed reliable bonding values, and Vertise Flow was insufficient in the laser and laser+silane groups.
We think that the results of our study should be supported with new studies, and they should be evaluated together with long-term in vivo studies before making a final judgment about the materials and methods.
Footnotes
Acknowledgments
This study was supported by Cumhuriyet University Scientific Research Projects Coordination Unit.
Author Disclosure Statement
No competing financial interests exist.