




Abstract
Objective:
Photobiomodulation (PBM) can usefully promote wound healing and relieve pain via its biological effects, with a wide range of applications in clinical medicine. The aim of the present study was to investigate the effect of 660 and 830 nm PBM on orthodontic tooth movement.
Background data:
PBM is based on the biological effects of diode laser irradiation on tissues, promoting cell proliferation and activity.
Materials and methods:
An orthodontic force was applied to the upper right first molars exposed to a 660 and 830 nm PBM (LHH-500I; Beijing Long Hui Heng Medical Science and Technology Development Corporation) on days 0, 1, 2, 3, 4, 5, and 7 for 50 sec with power density of 0.1 W/cm2 (a beam area of 0.5 cm2, radiate power of 0.05 W), energy density of 5 J/cm2 within 14 days, and a control group with no laser irradiation. Tooth movement was analyzed using a stereomicroscope, the number of osteoclasts determined by tartrate-resistant acid phosphatase (TRAP), and the expression of bone remodeling factors evaluated by immunohistochemistry.
Results:
The expression of IL-1β, RANKL, and OPG was significantly stimulated in the 660 and 830 nm groups. The expression of RANKL was significantly higher in the 660 nm group than in the 830 nm group on days 5 and 7; however, there was no significant difference in the expression of OPG and IL-1β between the 660 and 830 nm groups on days 1, 2, 3, 4, 5, 7, and 14. On days 3 and 5, the number of osteoclasts in the 660 nm group was higher than that in the 830 nm group, and the difference was statistically significant. Tooth movement over 14 days was significantly higher in the 660 and 830 nm groups than in the control group, and there was no significant difference between the 660 and 830 nm groups finally.
Conclusions:
Both 660 and 830 nm can accelerate the orthodontic tooth movement and promote alveolar bone remodeling on the compression side. Although the difference of tooth movement over 14 days between the two groups was not statistically significant; however, 660 nm PBM to accelerate bone remodeling is stronger than 830 nm PBM at an early stage.
Introduction
Orthodontic tooth movement is the result of periodontal ligament and alveolar bone remodeling via a series of signal transduction pathways. Bone remodeling is a dynamic balance process, and the effect of force on orthodontic bone remodeling has been studied extensively. The RANKL-RANK-OPG system plays an important role in bone remodeling and participates in many cell differentiation and activation processes, especially for osteoclasts and osteoblasts. 1,2 Routine orthodontic treatment usually takes 2–3 years. Orthodontic doctors aim to speed up the movement of the teeth and shorten the course of orthodontic treatment. With the application of photobiomodulation (PBM) in the medical field, orthodontic doctors have paid more and more attention as to whether it can effectively promote alveolar bone remodeling on the compression side. 3,4 In the present study, we established a rat model to study whether 660 and 830 nm can influence the expression of bone remodeling factors and the regularity of osteoclast number, preliminarily elucidating the effect of 660 and 830 nm on orthodontic tooth movement, and compare the differences between 660 and 830 nm PBM, providing theoretical basis for selecting suitable wavelength for treatment.
Materials and Methods
Fifty 6-week-old male Sprague-Dawley (SD) rats weighing 200 ± 10 g were randomly divided into 3 groups of 25 animals each: the control group, the 660 nm PBM group, and the 830 nm PBM group. An orthodontic elastic closed-coil spring (Beijing San Mateo Technology Co. Ltd.) was fixed between the upper right first molar and the incisors with ultraviolet curable resin (Fig. 1). The pulling force was 10–15 g. The PBM group was also exposed to 660 and 830 nm PBM (LHH-500I; Beijing Long Hui Heng Medical Science and Technology Development Corporation, China) irradiation on days 0, 1, 2, 3, 5, and 7 for 50 sec with power density of 0.1 W/cm2 (a beam area of 0.5 cm2, radiate power of 0.05 W), and energy density of 5 J/cm2. The irradiation sites were mesial buccal, distal buccal, mesial palatal, and distal palatal of the upper right first molar. There were four points per application, the energy per point was 2.5 J, and the total energy per application around the dental root was 10 J, totaling at the end of the six applications, 60 J. The irradiation distance from the gingival mucosa was 2 mm and checked before each laser treatment using a power meter to ensure that each power is the same. The rats in three groups were sacrificed on days 1, 3, 5, 7, and 14 after making a silicone rubber impression of the rat maxillary to measure the distance teeth moved by casting plaster models. SD rats were subjected to an anesthetic agent before each operation. Operation and execution during the experiment are in line with animal welfare requirements. The distance was determined by measuring the separation between the first and second upper molars with an accuracy of 1 × 10⁻⁴ μm using a stereomicroscope and Image-Pro Plus 6.0 software (Fig. 2).
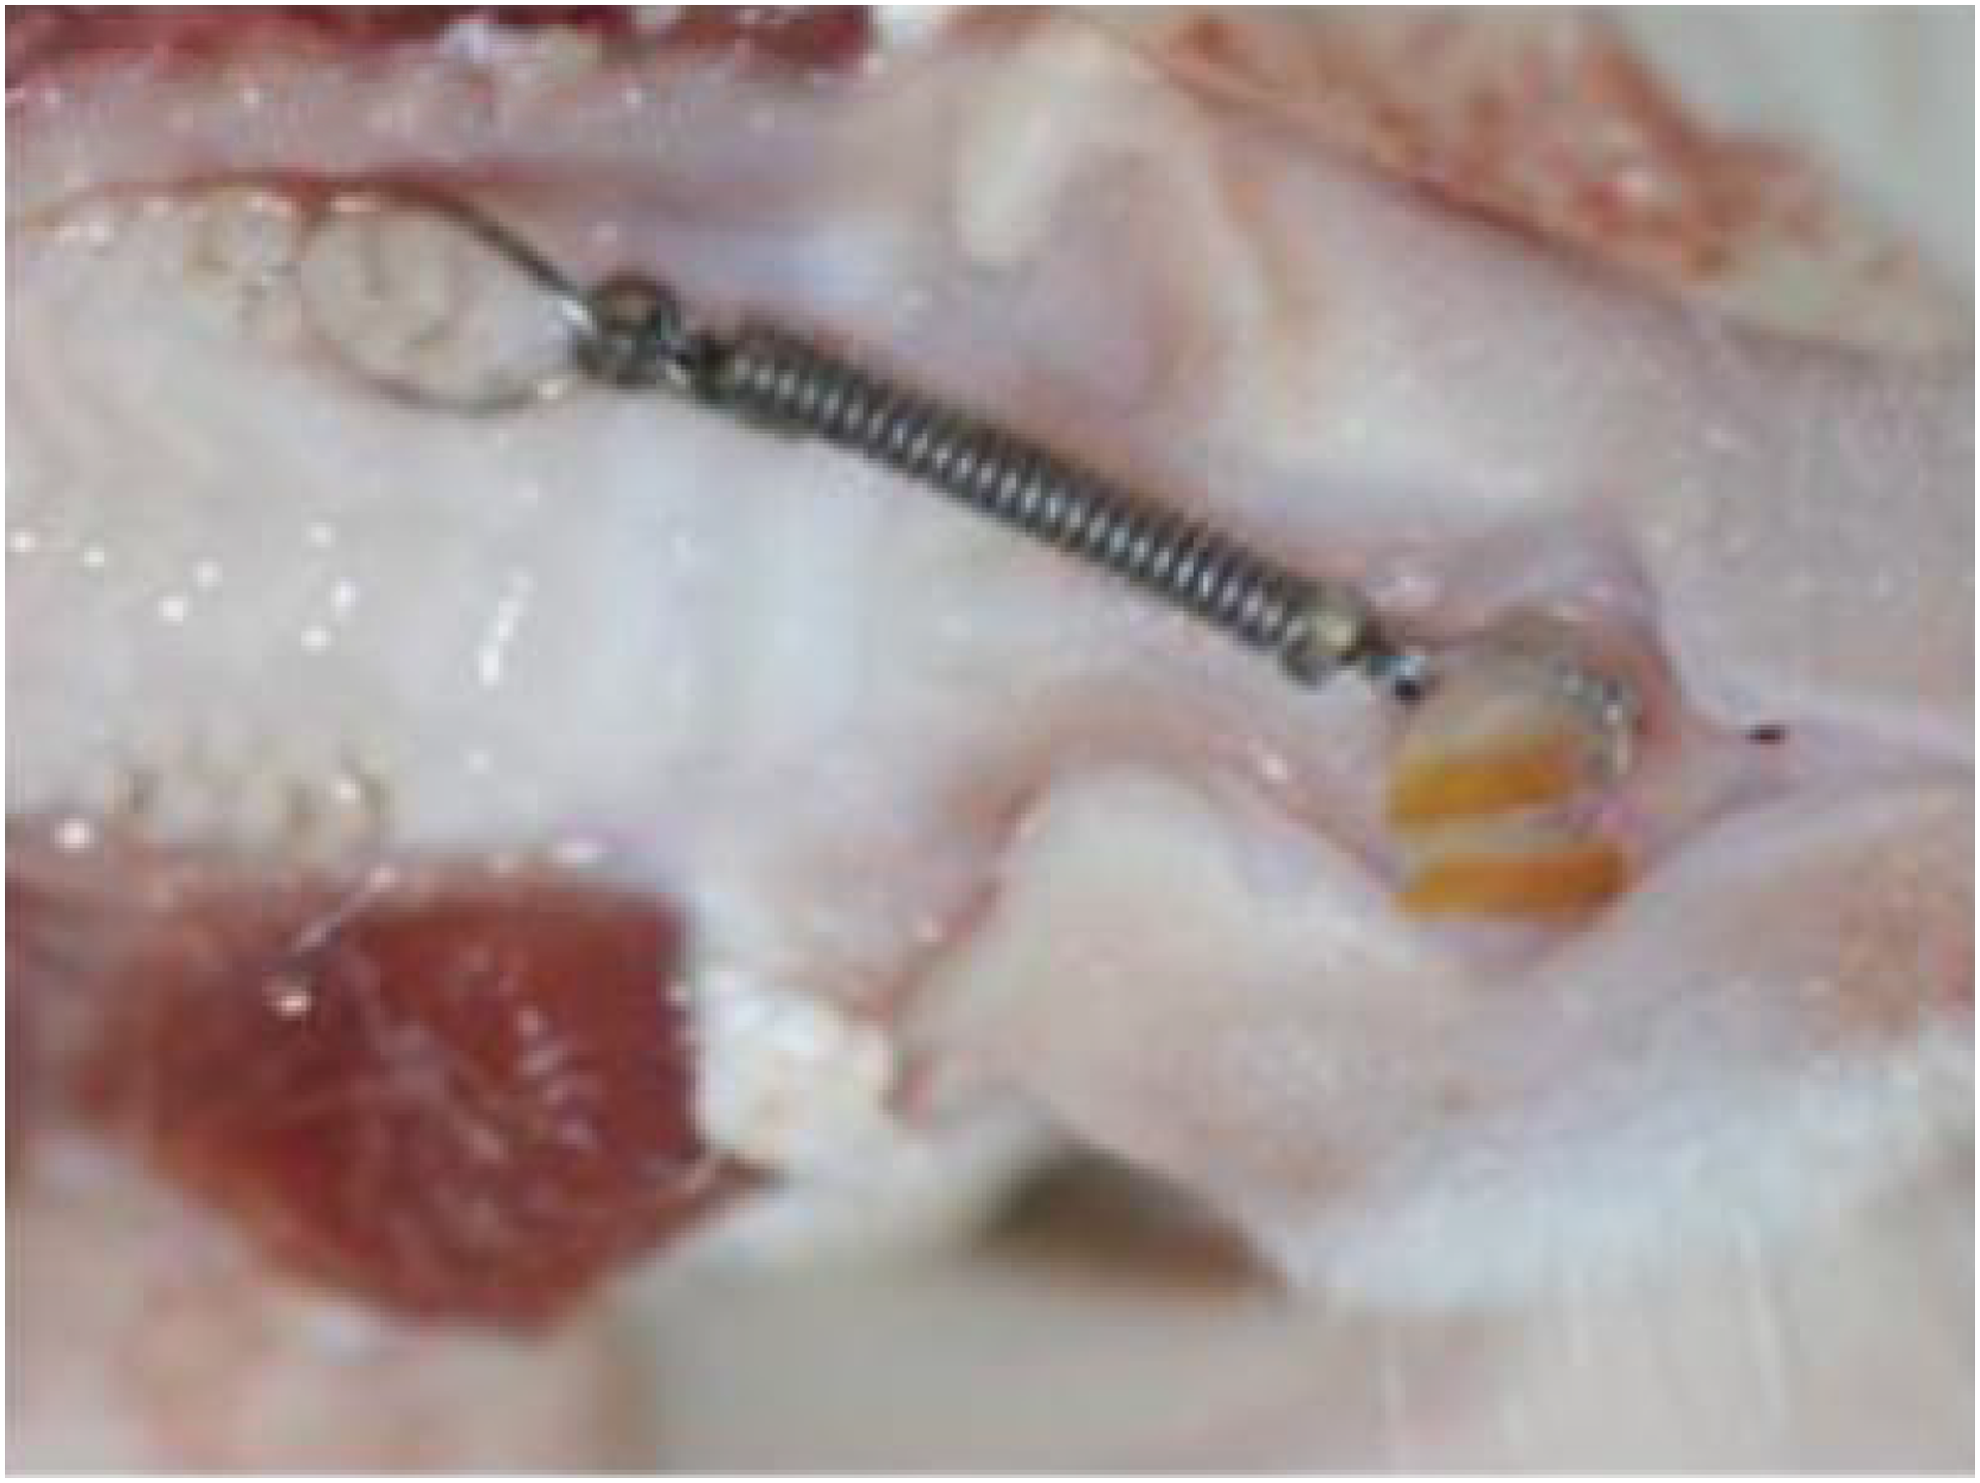
Orthodontic appliance of the upper right first molar in rats.
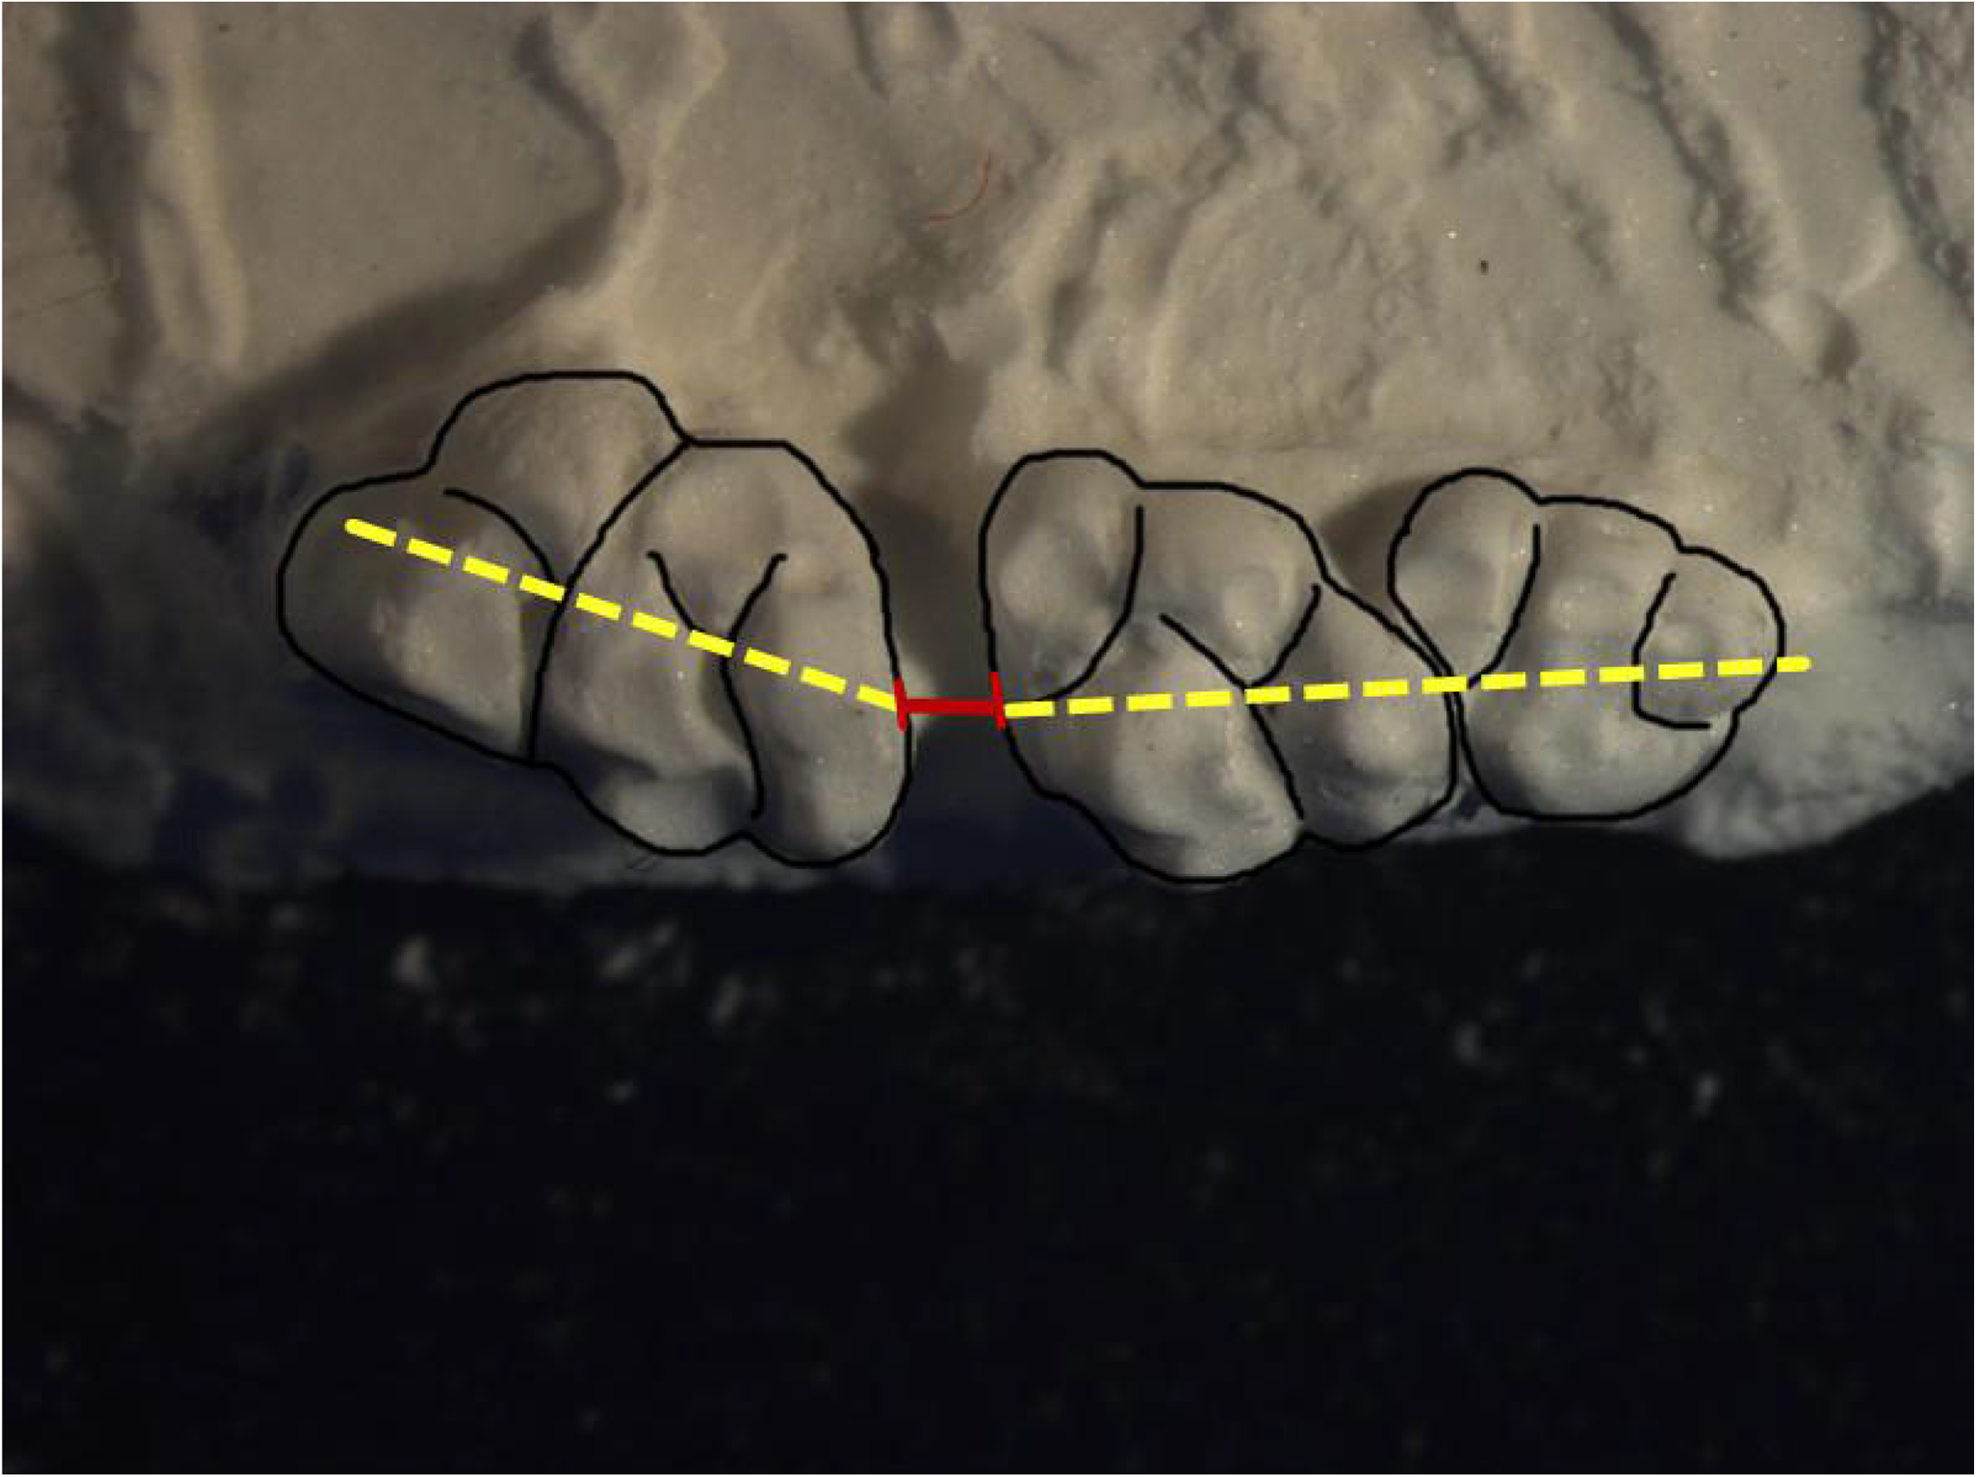
Measurement of the distance the upper right first molar moved. The dashed lines connect the central fossa of occlusal surface.
Histology, immunohistochemistry, and tartrate-resistant acid phosphatase (TRAP) staining
The maxillary tissues of each animal were fixed in 4% paraformaldehyde for 24 h and decalcified at 4°C for at least 30 days. After dehydrating the tissues in ethanol series and embedding in paraffin, 5-mm serial sections were cut in a mesiodistal direction parallel to the long axis of the mesial root of the first molar. Thirteen serial sections per animal were selected, one of them for hematoxylin and eosin staining, three of them for TRAP, the other nine ones for IL-1β, RANKL, and OPG immunohistochemistry (IHC) staining. The compression area in the tissue sections was determined in the periodontal ligament tissue and alveolar bone mesial to the upper one-third of the mesial root (Fig. 3). TRAP staining was performed using a leukocyte acid phosphatase kit (Sigma). Osteoclasts were TRAP positive (amaranth or deep-red color), multinucleated, and distributed on the compression side in the alveolar bone surface. The osteoclasts were counted by Image-Pro Plus 6.0 software at a magnification of 400 times with three random fields in each section and calculated the average of three sections. IHC was performed with the first antibody (Abcam, Cambridge, Britain) in a 1:200 working solution (IL-1β or osteoprotegerin) or 1:50 working solution (RANKL) at 4°C. Sections were stained in a 3,3′-diaminobenzidine solution and counterstained with hematoxylin. The images were captured under a light microscope at the same setting, and the average optical density on the compression area was analyzed by Image-Pro Plus 6.0 software (Media Cybernetics, Bethesda, MD) with three random visual fields in each section.

Histological section of the mesial root of the upper right first molar. The compression area is the first upper molar at the mesial to the upper one-third of the mesial root. Hematoxylin and eosin, 40 × magnification.
Statistical analysis
The data were processed using SPSS 17.0 software. The results are expressed as means and standard deviations. The Tukey test was used to analyze the data between the two groups. The significance level was set at p < 0.05.
Results
On day 1, we found no significant difference in tooth movement among the control, 660 nm, and 830 nm groups, with approximate averages of 0.166 ± 0.041, 0.176 ± 0.048, and 0.176 ± 0.042 mm, respectively. On day 3, the distance was 0.250 ± 0.055, 0.276 ± 0.053, and 0.261 ± 0.053 mm for the control, 660 nm, and 830 nm groups, respectively. On day 5, the differences among three groups were larger. On day 7, the total tooth movement was 0.404 ± 0.063, 0.501 ± 0.081, and 0.447 ± 0.078 mm for the control, 660 nm, and 830 nm groups, respectively. There was a statistically significant difference in the average distance between the 660 nm group and the control group on day 7 (p < 0.05). However, there was no significant difference between the 830 nm group and the control group on day 7. On day 14, the total tooth movement was 0.633 ± 0.082, 0.755 ± 0.090, and 0.734 ± 0.091 mm for the control, 660 nm, and 830 nm groups, respectively (Fig. 5). The average distance of the 660 and 830 nm groups is statistically significantly longer than that of the control group on day 14 (p < 0.05) (Fig. 4).
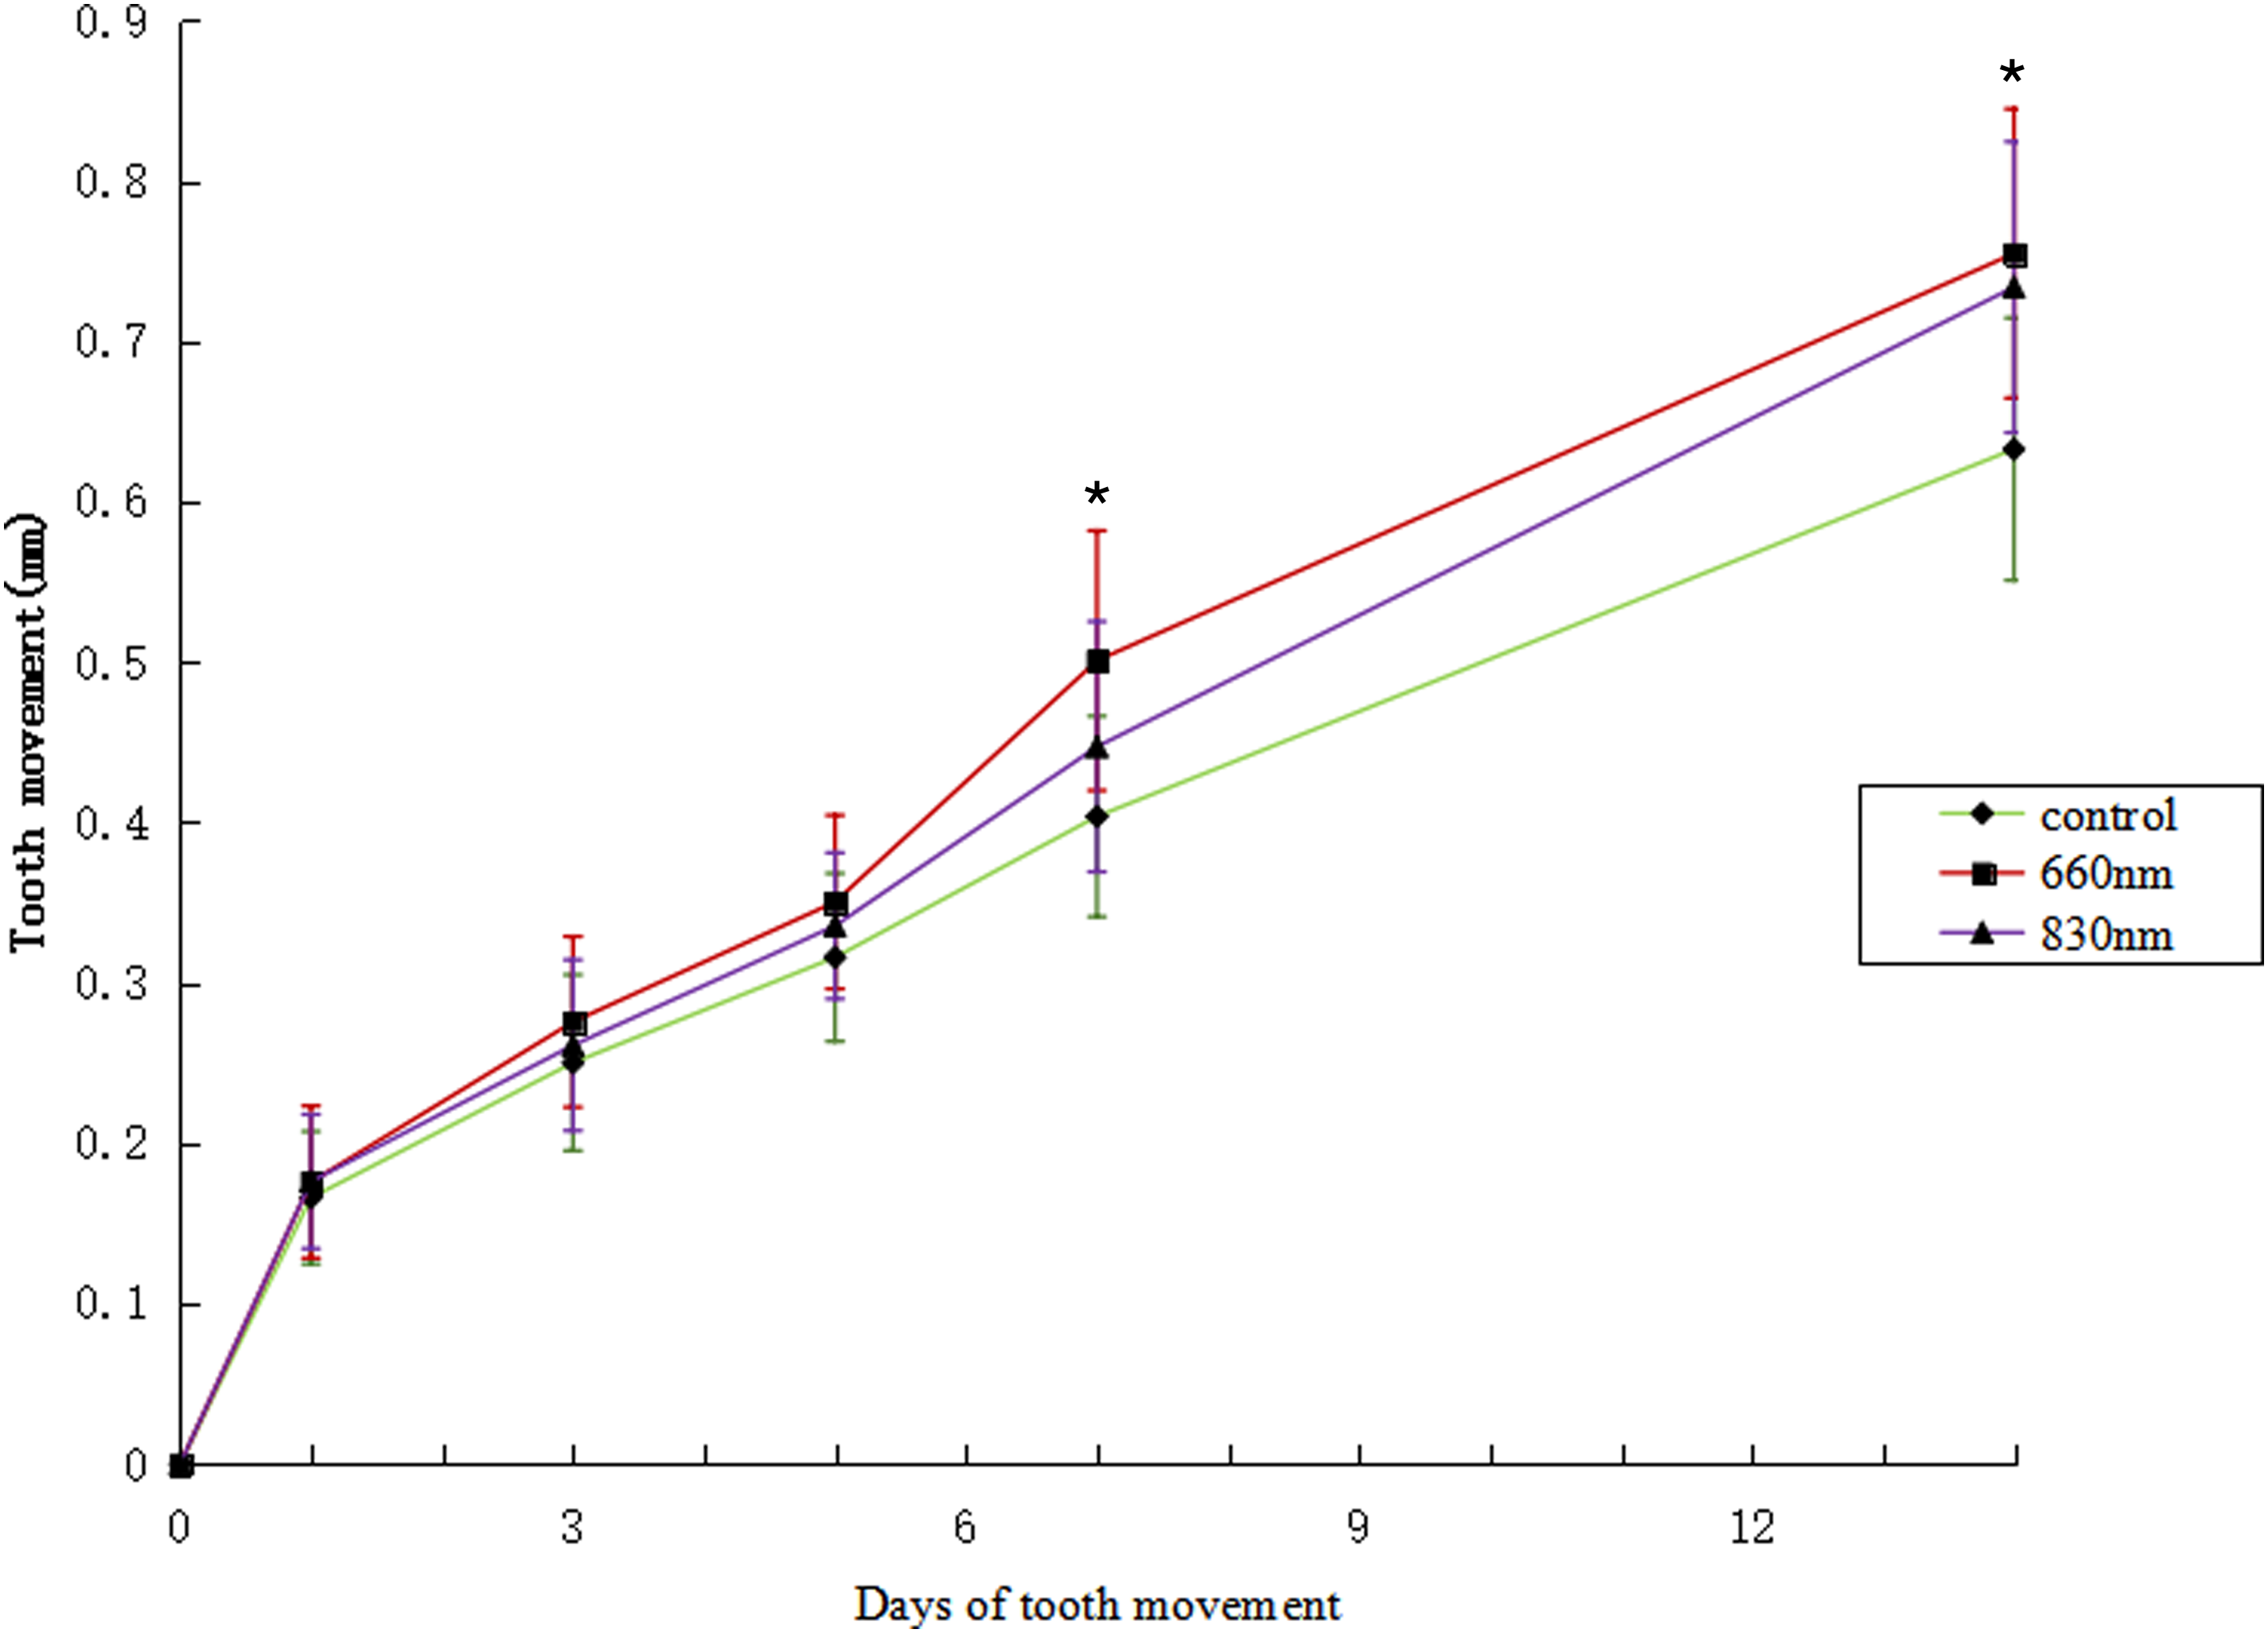
Tooth movement in 14 days. The data are presented as mean ± standard deviation *p < 0.05.
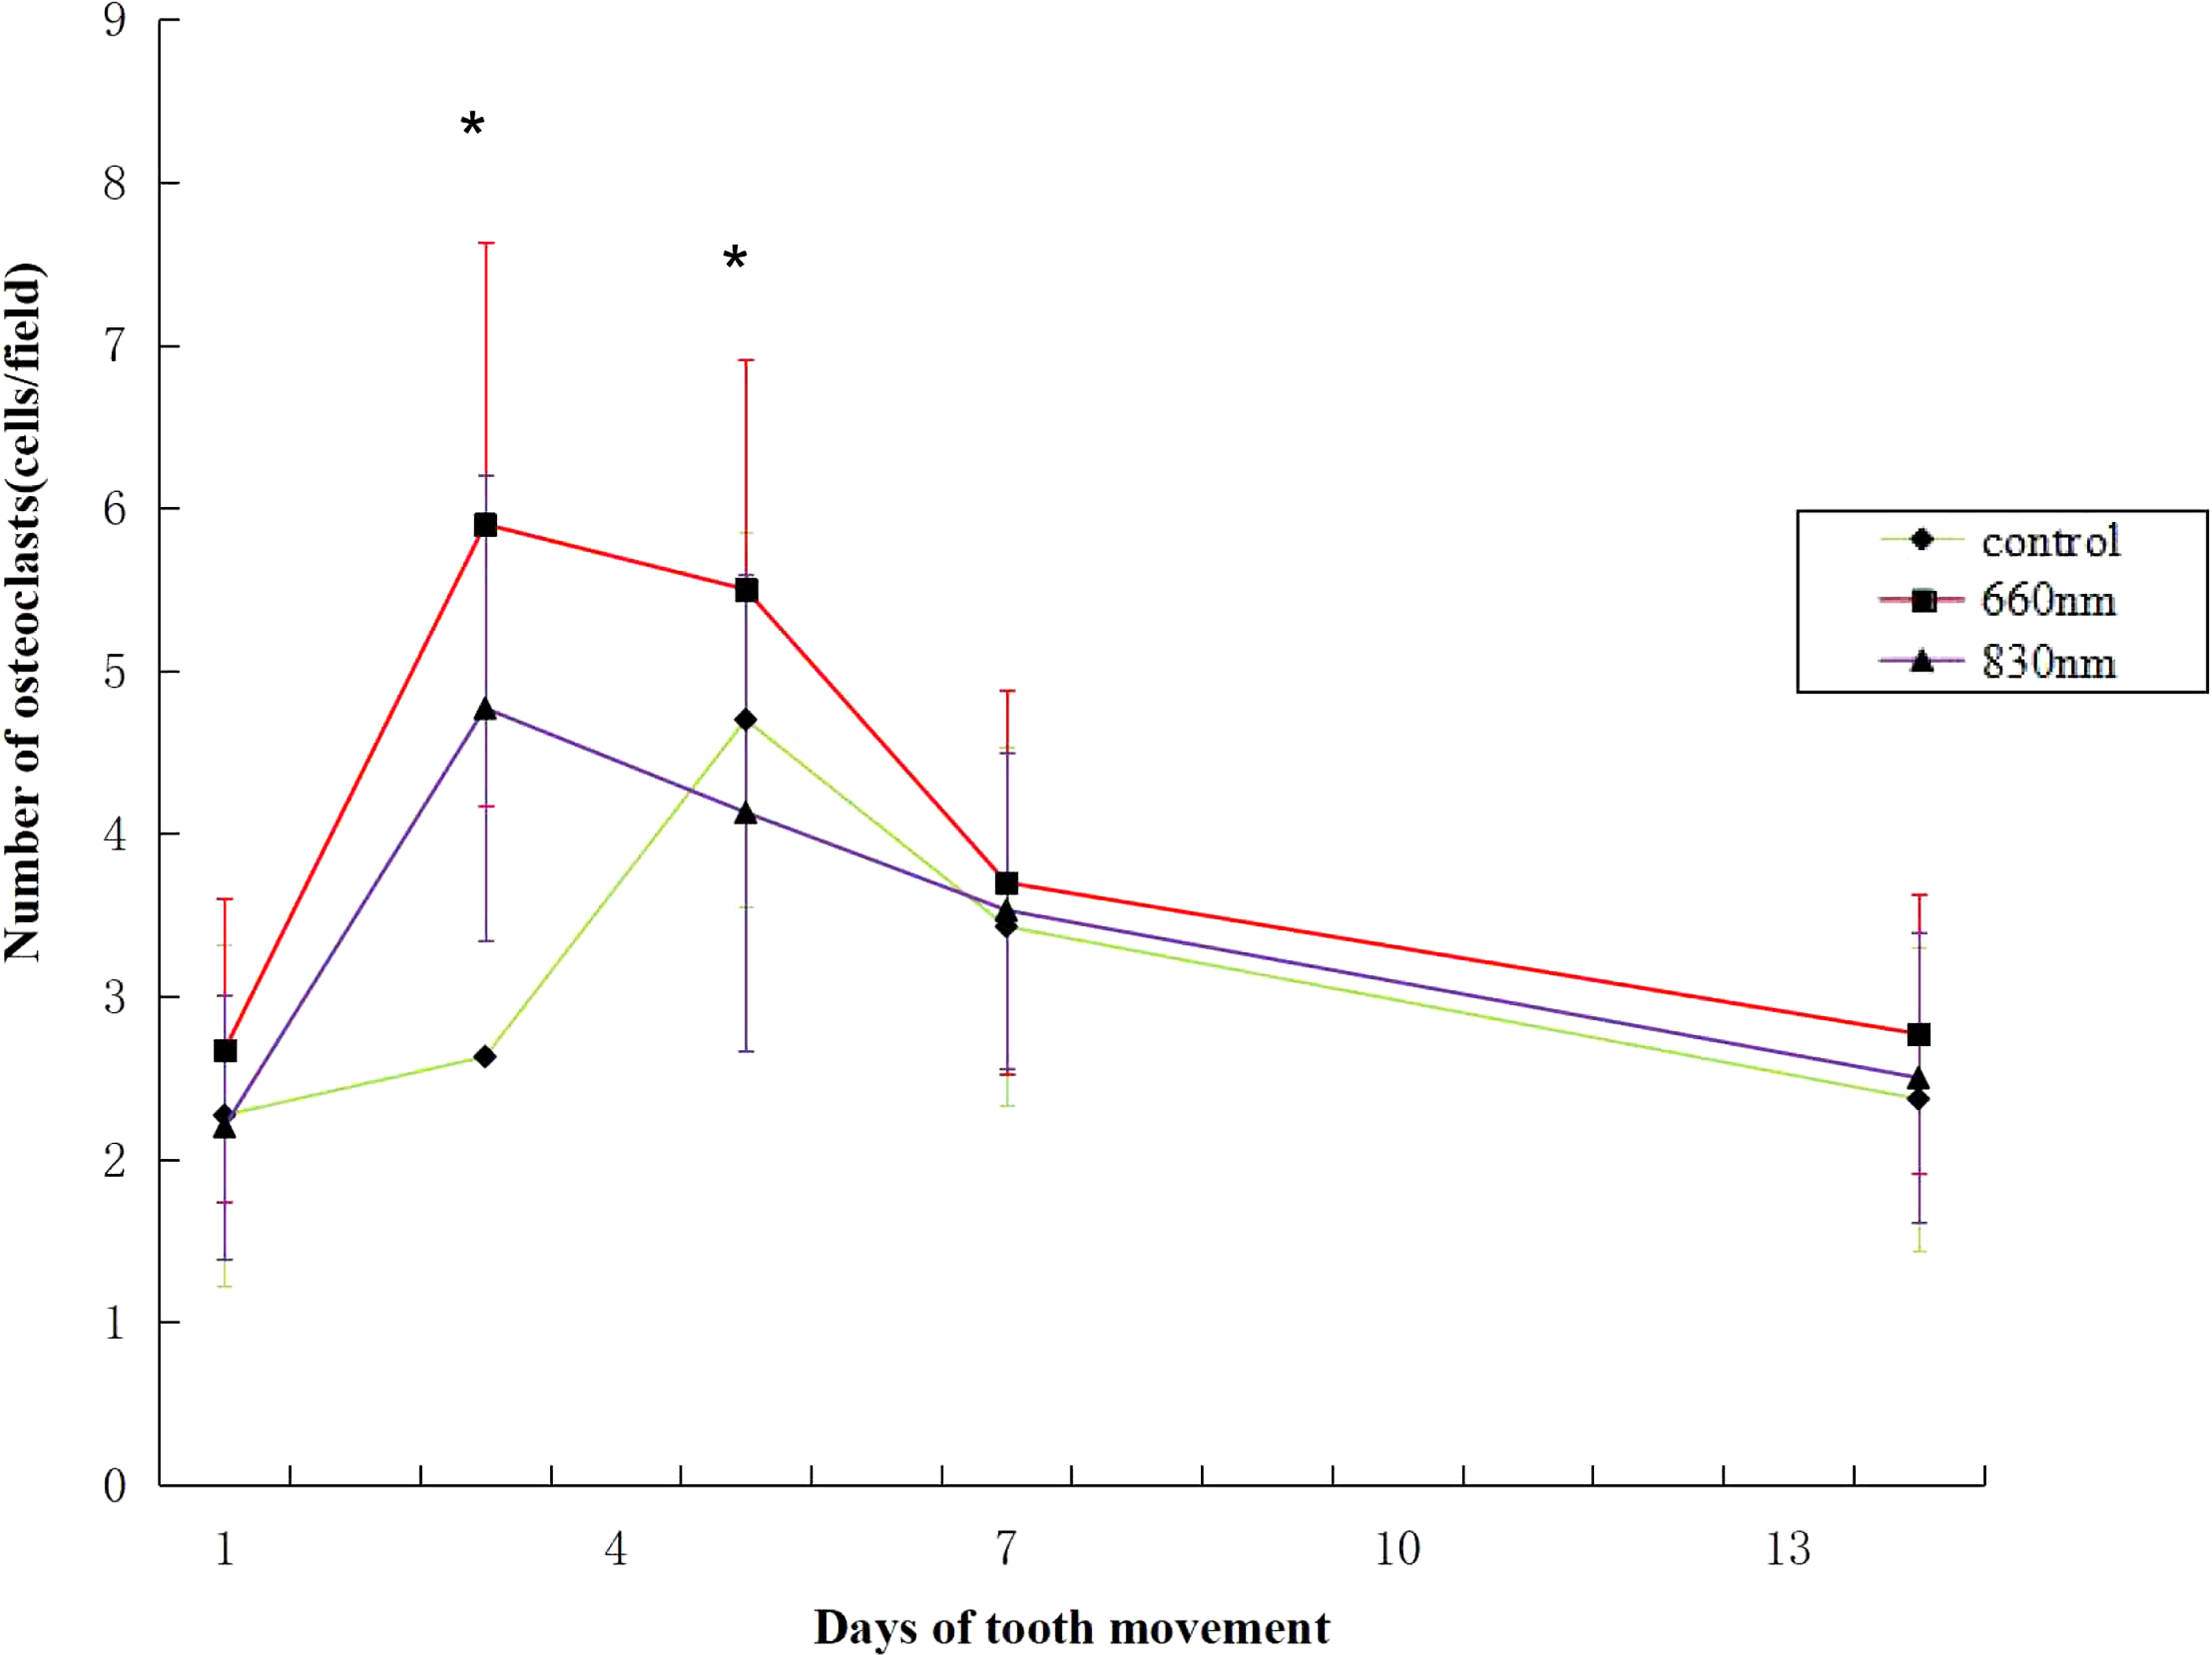
Average number of TRAP-positive osteoclasts in each field. The data are presented as mean ± standard deviation. *p < 0.05. TRAP, tartrate-resistant acid phosphatase.
TRAP-positive multinucleated osteoclasts are always amaranth or deep-red, and these osteoclasts are evenly distributed on the compression side in the alveolar bone surface with a horseshoe, fried egg morphology. On day 1, the number of osteoclasts in each field in the control, 660 nm, and 830 nm groups was 2.27 ± 1.05, 2.67 ± 1.09, and 2.20 ± 0.81, respectively. On day 3, the number of osteoclasts in each field in the control, 660 nm, and 830 nm groups was 2.63 ± 0.76, 5.90 ± 1.73, and 4.77 ± 1.73, respectively (p < 0.05). On day 5, the number of osteoclasts in each field in the control, 660 nm, and 830 nm groups was 4.70 ± 1.15, 5.50 ± 1.41, and 4.13 ± 1.46, respectively (p < 0.05) (Figs. 5 and 6). The results of least significant difference t-test showed that on day 3, the average number of osteoclasts was 660 nm group >830 nm group > control group, and the difference was statistically significant (p < 0.05). On day 5, the average number of osteoclasts was 660 nm group> control group >830 nm group, although the average number of osteoclasts in the control group was slightly greater than that in the 830 nm group, but the difference was not statistically significant.
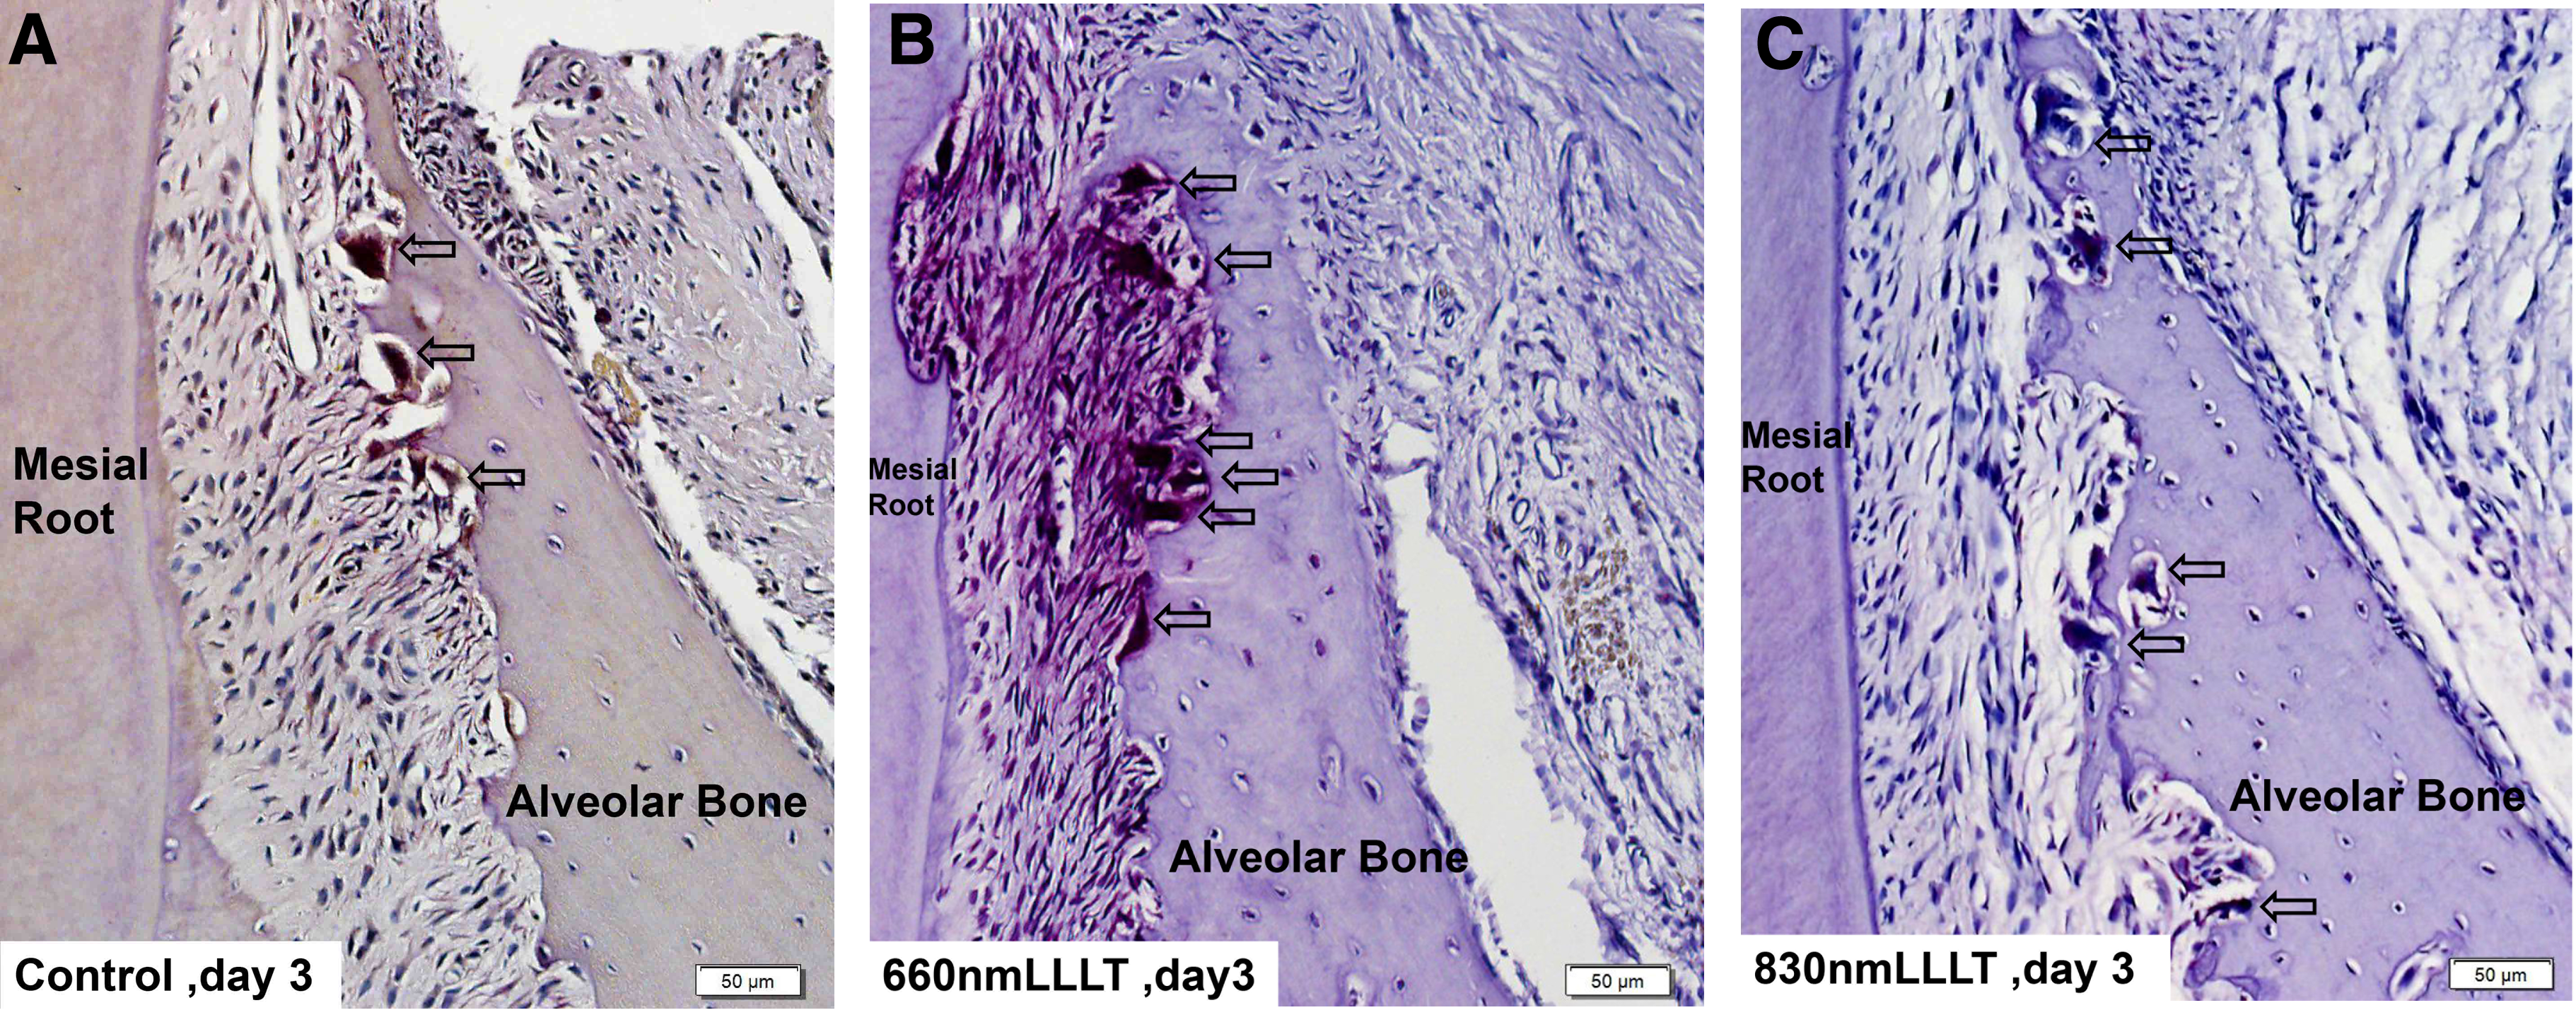
Histological sections captured on the compression side of the mesial root of the upper first molar. TRAP staining, 200 × magnification.
IL-1β immunoreactivity was expressed mainly in the periodontal ligament fibroblasts, vascular endothelial cells, osteoblasts, osteoclasts, and periodontal membrane stroma with positive staining in the cytoplasm and cell membrane. On day 3, the average optical density was 0.109 ± 0.011, 0.129 ± 0.007, and 0.124 ± 0.008 in the control, 660 nm, and 830 nm groups, respectively. The expression was stronger in the 660 and 830 nm groups than in the control group, with a significant difference on day 3.However, the difference between the 660 and 830 nm groups was not statistically significant on day 3 (Fig. 7).

Expression of IL-1β in the periodontal ligament area on the upper first molar compression side of the mesial root. Immunohistochemistry staining, 400 × magnification.
RANKL immunoreactivity was expressed mainly in mesenchymal cells, osteoblasts, periodontal ligament fibroblasts, and osteoclasts, with positive staining in the cytoplasm. On day 5, the average optical density of the control, 660 nm, and 830 nm groups was 0.164 ± 0.016, 0.202 ± 0.017, and 0.185 ± 0.022, respectively. On day 7, the average optical density of the control, 660 nm, and 830 nm groups was 0.150 ± 0.009, 0.195 ± 0.020, and 0.163 ± 0.018, respectively. Expression was stronger in the 660 and 830 nm groups than in the control group, with a significant difference on days 5 and 7. Above all, on days 5 and 7, expression was stronger in the 660 nm group than in the 830 nm group, with a significant difference (Fig. 8). On day 5, expression peaked in the three groups.
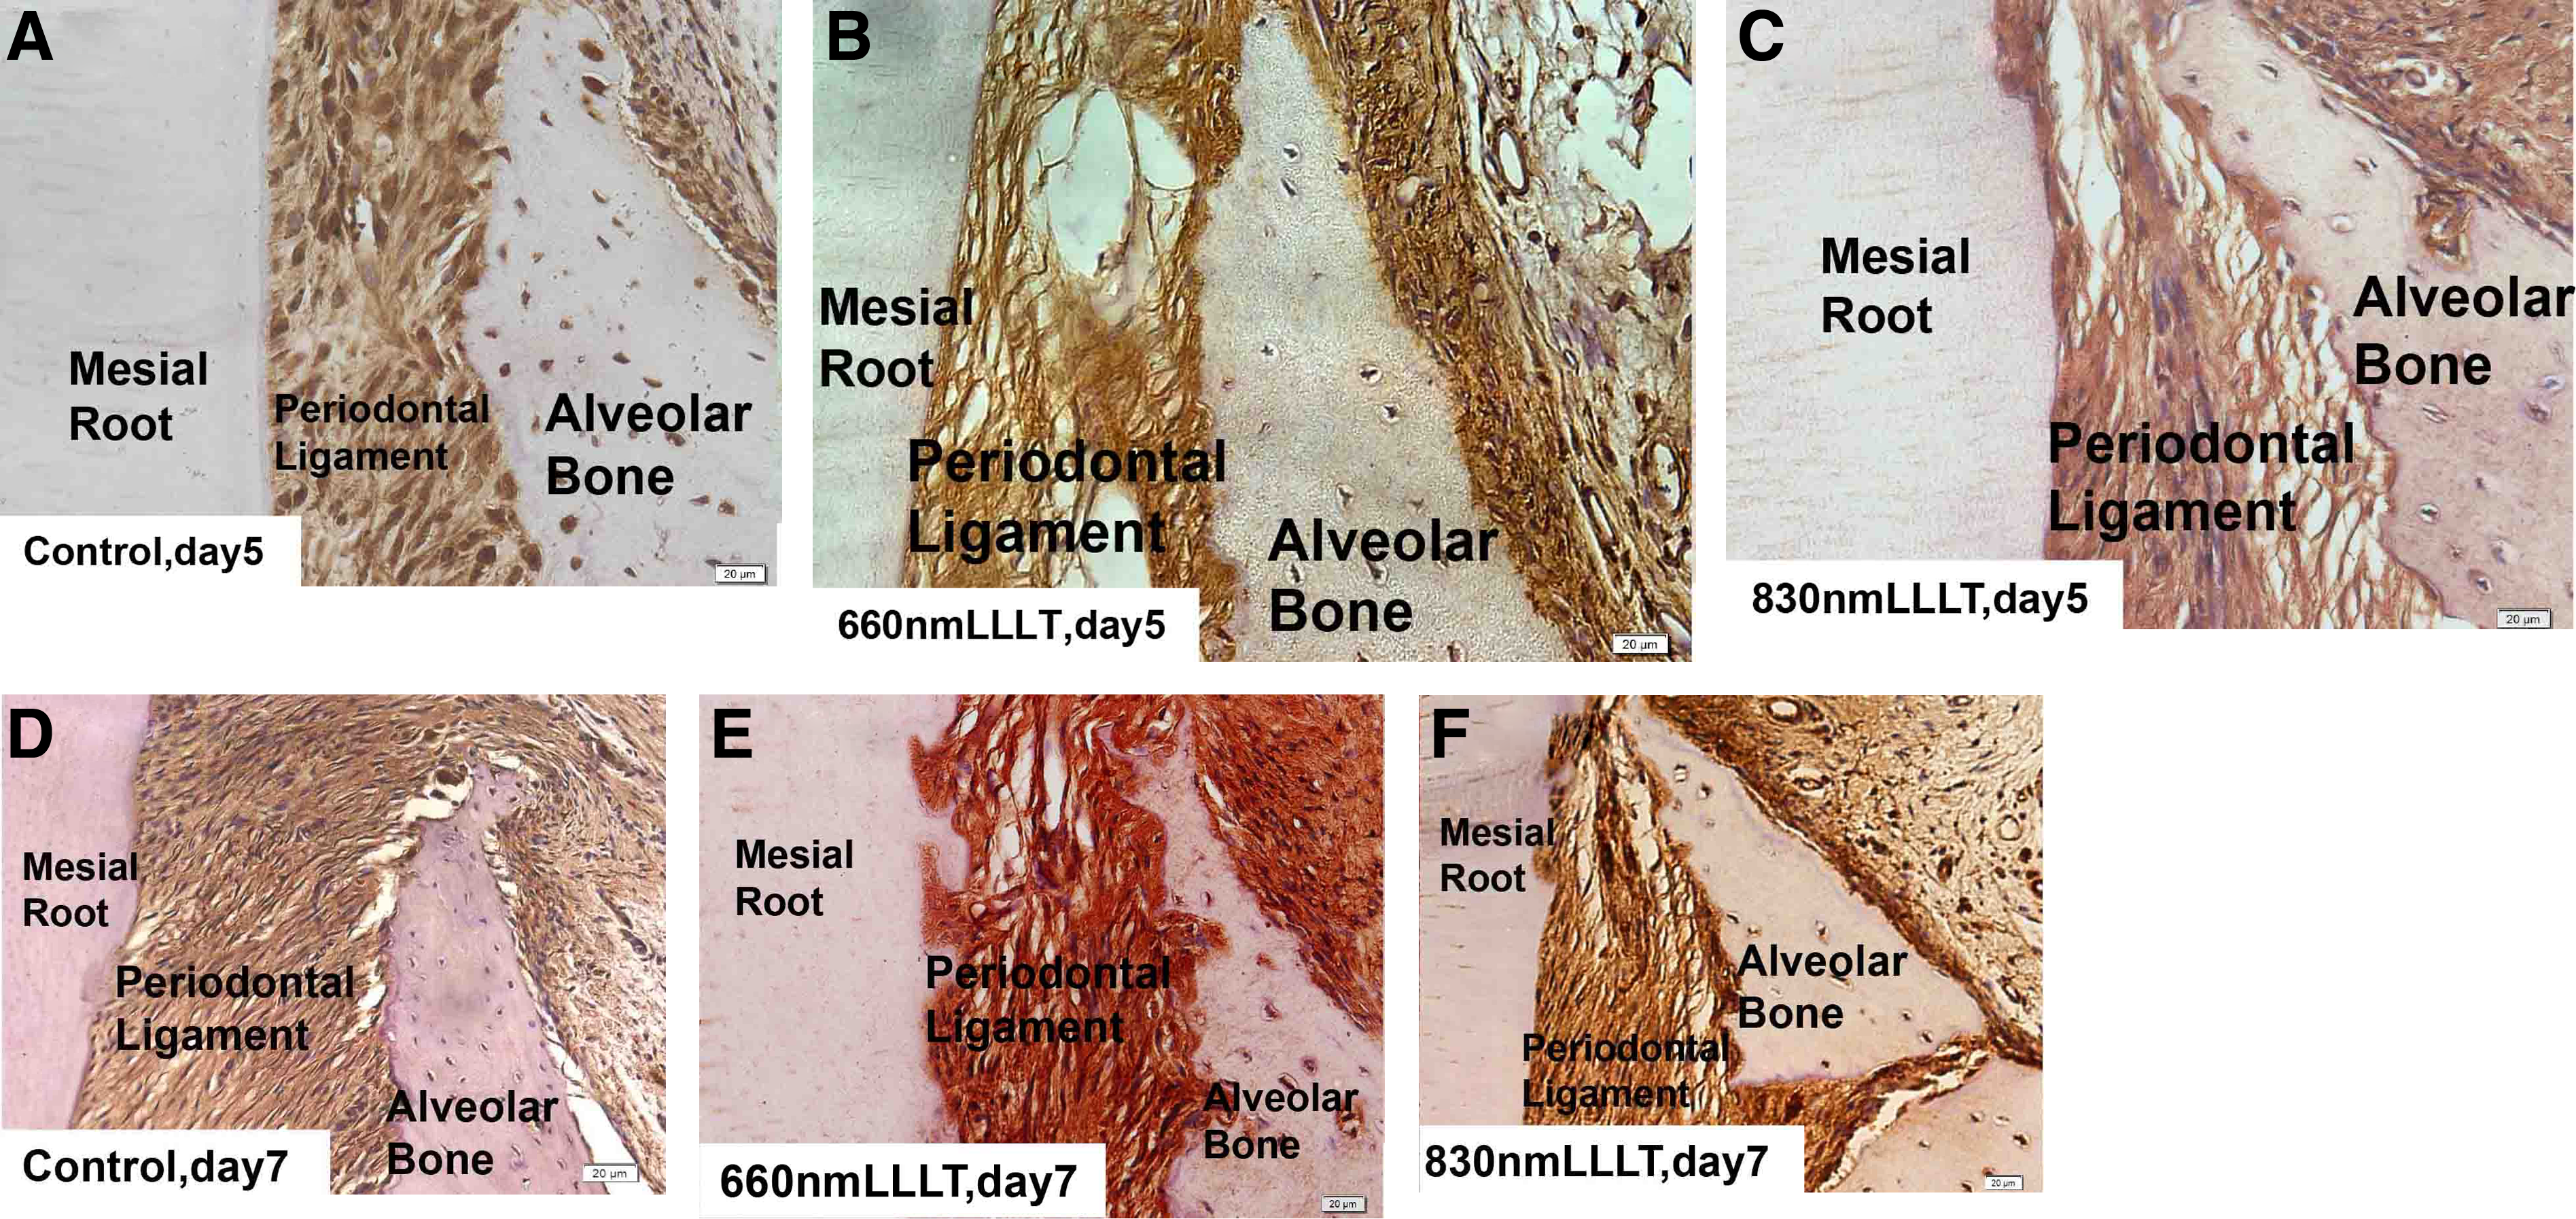
Expression of RANKL and osteoprotegerin in the periodontal ligament area on the first upper molar compression side of the mesial root. Immunohistochemistry staining, 400 × magnification.
OPG immunoreactivity was expressed mainly in mesenchymal cells, osteoblasts, and periodontal ligament fibroblasts, with positive staining in the cytoplasm. On days 5, the average optical density of the control, 660 nm, and 830 nm groups was 0.163 ± 0.021, 0.188 ± 0.025, and 0.180 ± 0.019, respectively. On day 7, the average optical density of the control, 660 nm, and 830 nm groups was 0.184 ± 0.018, 0.210 ± 0.025, and 0.196 ± 0.022, respectively. Expression was stronger in the 660 and 830 nm groups than in the control group, with a significant difference on days 5, and expression was stronger in the 660 nm group than in the control group, with a significant difference on day 7. However, the difference between the 660 and 830 nm groups was not statistically significant on days 5 and 7 (Fig. 8). On day 7, expression peaked in the three groups.
Discussion
Osteoblasts and osteoclasts are two important types of cells in the reconstruction of alveolar bone. Recent studies have shown that the RANKL-RANK-OPG system plays an important role in bone remodeling and osteoclast differentiation or activation. 2,5 With the aid of macrophage colony-stimulating factor, RANKL combines with RANK on the surface of preosteoclasts, inducing differentiation and development into mature osteoclasts. RANKL can also activate mature osteoclasts and inhibit apoptosis. OPG is a nonfunctional receptor of RANKL that can competitively bind RANKL and interrupt osteoclast formation and activation. 6 Liu et al. 7 have reported that RANKL-knockout rats have the obstacle of osteoclast proliferation and differentiation with severe bone sclerosis. Some studies found that RANKL expression increased during experimental tooth movement in the rat molar periodontium. Gerschman and Ruben 10 and Domínguez et al. 11 further confirmed that a higher level of RANKL in the periodontal tissue can activate osteoclasts to accelerate experimental tooth movement.
On day 3, the number of osteoclasts was higher in the 660 and 830 nm groups than in the control group, and the expression of RANKL was significantly higher in the 660 and 830 nm groups than in the control group on days 5 and 7. On day 5, the expression of OPG was significantly higher in the 660 and 830 nm groups than in the control group, indicating that 660 and 830 nm PBM can increase the expression of RANKL and OPG to speed up alveolar bone remodeling on the compression side, resulting in a greater tooth movement distance in the 660 and 830 nm groups, agreeing with Renno et al. 12 who demonstrated in their studies that each cell line responds differently to specific wavelength and dose combinations.
Orthodontic tooth movement is also related to bone immunity. 13 During orthodontic tooth movement, the periodontal ligament on the compression side produces an aseptic inflammatory reaction. 14 IL-1β is an important cytokine in the aseptic inflammatory reaction and can regulate some “downstream factor”, such as RANKL or OPG. The small change in IL-1β expression can lead to more changes in some “downstream factor” through a cascade reaction. 15 Increased IL-1β levels may upregulate the expression of bone remodeling factors. 13 Iwasaki et al. found that increased IL-1β locally or systemically accelerates the rate of tooth movement, indicating that the IL-1β expression level is positively related to the local bone remodeling activity. 16
According to the experimental result, PBM is in synergy with physiological inflammation within a certain period of time. IL-1β expression was significantly higher in the 660 and 830 nm groups than in the control group on day 3, and the number of osteoclasts was significantly higher in the 660 and 830 nm groups than in the control group. This result indicates that 660 and 830 nm PBM can increase the expression of IL-1β to accelerate the rate of alveolar bone remodeling on the compression side, as reported in previous studies, 17,18 which also confirmed that PBM affects the proliferation and activation of some cells. 19 –22 Especially, on days 3 and 5, the number of osteoclasts in the 660 nm group was higher than that in the 830 nm group, and the difference was statistically significant. It indicated that the ability of 660 nm PBM to accelerate bone remodeling might be stronger than 830 nm PBM on days 3 and 5. However, on days 7 and 14, the number of osteoclasts in the 660 nm group was not significantly higher than that in the 830 nm group, indicating that the final effect of 660 nm PBM on accelerating bone remodeling was similar to 830 nm PBM. Barbosa et al. 23 demonstrated that low-power laser therapy was able to promote bone regeneration after 7 days of treatment regardless of 660 or 830 nm wavelength used. This might indicate that 660 nm PBM increase bone regeneration and decrease bone resorption after 7 days, which may lead to no differences between the two groups (660 and 830 nm) at the end of distance in 14 days.
In summary, the principle underlying PBM accelerated orthodontic tooth movement is increased expression of IL-1β, RANKL, and OPG on the compression side. Furthermore, more osteoclasts in the early days after irradiation are the basis for accelerated bone remodeling after PBM. Although 660 nm PBM to accelerate bone remodeling might be stronger than 830 nm PBM in the early days, there was no significant difference in the final tooth movement between the two groups. This suggests that 830 nm PBM has less side effects in accelerating tooth movement.
Footnotes
Acknowledgments
This study was financially supported by the Beijing Talents Fund (Grant No. 2013D003034000022) and the National Natural Science Foundation of China (Grant 81771103).
Author Disclosure Statement
No competing financial interests exist.