
Abstract
Background:
Sphingosine kinase 1 (SPHK1) and heat shock protein 27 (HSP27) are important for antioxidant and anti-inflammatory effects after red light irradiation in an inflammatory model.
Objective:
The purpose of the present study was to evaluate whether SPHK1 and HSP27 work independently or are dependent on some other regulator after 625 nm light-emitting diode irradiation in the human keratinocyte (HaCaT) cell line.
Methods:
Differentially expressed genes (DEGs) were identified between groups with or without 625 nm photobiomodulation (PBM) in the inflammatory model. Potential transcription factors (TFs) of key DEGs were predicted using the iRegulon plugin. The mechanism was investigated by analyzing mRNA and protein expression levels, prostaglandin E2 levels, and intracellular reactive oxygen species (ROS) in phorbol 12-myristate 13-acetate (PMA)-induced HaCaT cells after 625 nm PBM.
Results:
A total of 6 TFs (e.g., E2F1) and 51 key DEGs (e.g., SPHK1) were identified after 625 nm PBM in PMA-stimulated HaCaT cells. E2F1 worked as a regulator of SPHK1; however, it did not affect HSP27. E2F1 knockdown drastically decreased the SPHK1 expression level and increased the intracellular ROS, as well as the expression levels of inflammation-related proteins in PMA-induced HaCaT cells. In addition, the inhibition of HSP27 decreased the anti-inflammatory effect of 625 nm PBM.
Conclusions:
E2F1 worked as a TF of SPHK1 and exhibited anti-inflammatory and antioxidative effects through SPHK1 in PMA-induced HaCaT cells after 625 nm PBM. HSP27 is essential for the 625 nm PBM-induced anti-inflammatory function. Therefore, E2F1/SPHK1 and HSP27 could be used as potential biomarkers for anti-inflammatory therapy with 625 nm PBM.
Introduction
Photobiomodulation (PBM) has been widely accepted as a therapeutic modality for the treatment of skin inflammatory disorders, acne, wound healing, and pain control. 1 Red light PBM can be used in inflammatory and auto-immune diseases, 2,3 precancerous and cancerous lesions, 4,5 hair loss, 6,7 and anti-aging. 8,9 In particular, red light has revealed its efficacy for the treatment of acne vulgaris, rosacea, and psoriasis in clinical applications. 10 Our previous study reported that red light PBM inhibits prostaglandin E2 (PGE2) production and COX-1/2 expression. However, the signaling pathway of PBM at a cellular level remains unclear, and the biomarker to assess the effects of PBM must be determined.
Previous studies have also indicated the possibility of sphingosine kinase 1 (SPHK1)/NF-κB pathway and small heat shock protein 27 (HSP27) being responsible for the anti-oxidant and anti-inflammatory effects of 625 nm PBM. 11,12 However, the detailed molecular mechanisms still need to be elucidated. In addition, there might exist a master regulator that affects both SPHK1 and HSP27 in PBM, and this aspect needs to be investigated further.
Both SPHK1 and HSP27 could be key molecules in evaluating the therapeutic effects of 625 nm PBM. Thus, the first objective of the present study was to determine whether these genes worked independently or not. The second objective was to determine the upstream regulator of SPHK1 and HSP27 to clarify the underlying mechanism of red PBM in phorbol 12-myristate 13-acetate (PMA)-induced human keratinocyte (HaCaT) cells.
According to the microarray profiling data in our previous study, 11 113 genes were upregulated under the influence of 625 nm PBM. To further identify differentially expressed genes (DEGs) and transcription factors (TFs), we comprehensively reanalyzed the gene expression profiling. Among the predicted TFs, E2F1 showed a strong link with SPHK1. Silencing E2F1 drastically decreased the SPHK1 expression level using 625 nm PBM. Six hundred and twenty-five nanometer PBM lost its anti-inflammation effect without HSP27 as well. Therefore, E2F1/SPHK1 and HSP27 might be useful as biomarkers for the prognosis of light-emitting diode (LED) irradiation.
Materials and Methods
Cell culture and chemicals
The immortalized human keratinocyte cell line, HaCaT, was purchased from AddexBio (Catalog Number: T0020001, San Diego, CA) and cultured in Dulbecco's Modified Eagle's Medium (Welgene, Korea) containing 10% heat-inactivated fetal bovine serum (Atlas Biologicals, Korea) and 100 units/mL of penicillin–streptomycin (Welgene) at 37°C in a humid atmosphere of 5% CO2. HaCaT cells were seeded at 1 × 10⁴ cell/well in six-well plates and grown at 37°C for 24 h. The cells were treated with 12 ng/μL of PMA for 3 h and subsequently photobiomodulated by LED for 1 h 11 (Supplementary Fig. S1). PMA (Sigma); N-acetyl-L-cysteine (NAC; Sigma); 2′, 7′-dichlorodihydrofluorescein diacetate (H2DCF-DA; Sigma); SYBR Green PCR Master Mix (Applied Biosystems; Warrington, United Kingdom); and complementary DNA (cDNA) Synthesis Kit were purchased from iNtRON Biotechnology (Korea).
Photobiomodulation
A continuous-wave LED irradiation system (U-JIN LED CO., LTD, Goyang, Korea) was used. The parameters used are as follows: power density: 3 mW/cm2; wavelength: 625 nm; total energy: 10.8 J; and duration of treatment: 3600 sec. The distance between cell culture medium and the light source was about 25 mm. The parameters and schematic of the PBM are shown in Table 1 and Supplementary Fig. S2.
Parameters Involved in the Study
CW, continuous wave; LED, light-emitting diode.
Microarray and data analysis
HaCaT cells were stimulated with 12 ng/μL PMA for 3 h (PMA group), or irradiated by 625 nm PBM for 1 h (R60 group), or stimulated using PMA for 3 h and then irradiated by 625 nm PBM for 1 h (PR60 group). The treatment method and parameters were described in
Bioinformatic analyses of associated genes and TFs
To further identify upregulated DEGs (Fold change ≥1.5) and TFs associated with the 625 nm PBM treated inflammatory in vitro model, the plugin iRegulon (v1.3) in Cytoscape was used. The iRegulon Cytoscape plugin is available through the Cytoscape App Store
13
and can be downloaded from
RNA isolation and real-time polymerase chain reaction
Total RNA was extracted from cells using RNAiso Plus reagent (Takara Bio, Japan), and first-strand cDNA was synthesized from 1 μg of total RNA using the Maxime RT PreMix (Random primer) Kit (iNtRON Biotechnology). cDNA samples were amplified and analyzed by quantitative real-time polymerase chain reaction (qRT-PCR) using a Power SYBR Green PCR Master Mix (Applied Biosystems) and the Applied Biosystems StepOnePlus™ Real-Time PCR System. The expression of E2F1, SPHK1, CUX1, RFXANK, TBP, TGIF2LY, and SIN3A was quantified by RT-PCR using an ABI Real-Time PCR System (Applied Biosystems, United States) under standard qRT-PCR conditions. A 1:10 dilution is used to create a standard curve with at least five points. After getting the slope of the regression between the log values and the average Ct values, primer efficiency was calculated using the equation below 17 : Efficiency = [10(−1/slope)] − 1. The PCRs were performed in triplicate, and the calculation of relative expression of each mRNA was based on the 2−ΔΔCT method with normalization to the housekeeping gene GAPDH. The primer sequences used in the present study are presented in Table 2.
Real-Time Polymerase Chain Reaction Primer Sequences, Product Size, and Gene Function
Western blotting
After red light irradiation, cells were kept for 6 h and then harvested for Western blotting analysis. Cells were lysed in cold lysis buffer (1% NP-40, 50mM Tris-HCl, pH 7.5, 150 mM NaCl, 0.02% sodium azide, 150 mg/mL phenylmethylsulfonyl fluoride) containing protease inhibitor cocktail. The whole-cell lysates were separated by sodium dodecyl sulfate–polyacrylamide gel and transferred to polyvinylidene difluoride membranes (Millipore) followed by being blocked with 5% milk-TBS buffer at 25°C for 1 h. After being blocked, the membranes were incubated with primary antibodies at 4°C overnight. After being washed with TBST, the membranes were incubated with secondary antibodies for 2 h at 25°C and detected using the Chemiluminescence Detection Kit (GE Healthcare, Little Chalfont, United Kingdom). Primary antibodies for p-NF-κBp65, NF-κBp65, and p-HSP27 were purchased from Cell Signaling Technology. Antibodies for E2F1, SPHK1, SPHK2, HSP27, and GAPDH were obtained from Santa Cruz Biotechnology. The secondary antibodies used were anti-rabbit IgG, anti-mouse IgG, and anti-goat IgG (Santa Cruz Biotechnology). The protein levels were measured using ImageJ software.
Small interfering RNA
The silencing RNA duplexes for E2F1 (sc-29297; Santa Cruz Biotechnology), SPHK1 (sc-156038; Santa Cruz Biotechnology), and HSP27 (sc-29350; Santa Cruz Biotechnology) were commercially available and transfected into cells. Briefly, HaCaT cells (1 × 10⁵ cells/well) were seeded in six-well culture plates and incubated at 37°C in a CO2 incubator until the cells are 60–80% confluent. Cells were then transfected with specific E2F1-siRNA, SPHK1-siRNA, HSP27-siRNA, or negative control small interfering RNA (siRNA) for 24 h using 25 pmol siRNA per well by Lipofectamine® RNAiMAX (Invitrogen), following manufacturer's instructions.
Measurement of total reactive oxygen species
Cellular reactive oxygen species (ROS) was determined using H2DCF-DA (Sigma). Cells were treated based on the experimental design mentioned above. After PBM, cells were prepared for DCF-DA assay immediately. Briefly, cells were then incubated with 10 nM DCF-DA for 15 min at room temperature (25–30°C), after which they were washed with PBS. DCF fluorescence intensity was monitored using a Lionheart™ FX Automated Microscope (BioTek Instruments) at λex = 469 nm and λem = 525 nm.
Statistical analysis
The results from the independent experiments are expressed as mean ± standard deviation. Statistical analysis of the experimental data was performed using the Student's t-test. All data were obtained from at least two independent experiments on different days. Data were considered statistically significant when the p-value was <0.05.
Results
Bioinformatic analysis of TFs and predicted target genes under 625 nm PBM
Based on the microarray data, 11 113 genes were upregulated in PMA-induced HaCaT cells irradiated by 625 nm PBM. The transcription regulatory network of these genes is shown in Fig. 1a. The TFs with an NES >4 were CUX1, RFXANK, TBP, E2F1, TGIF2LY, and SIN3A. Specific information regarding TFs and their predicted target genes is shown in Table 3. Among these TFs, E2F1 and TGIF2LY worked as potential TFs of SPHK1 (Fig. 1b). NES of E2F1 was higher compared with TGIF2LY. A previous study 18 also suggested a link between E2F1 and SPHK1.
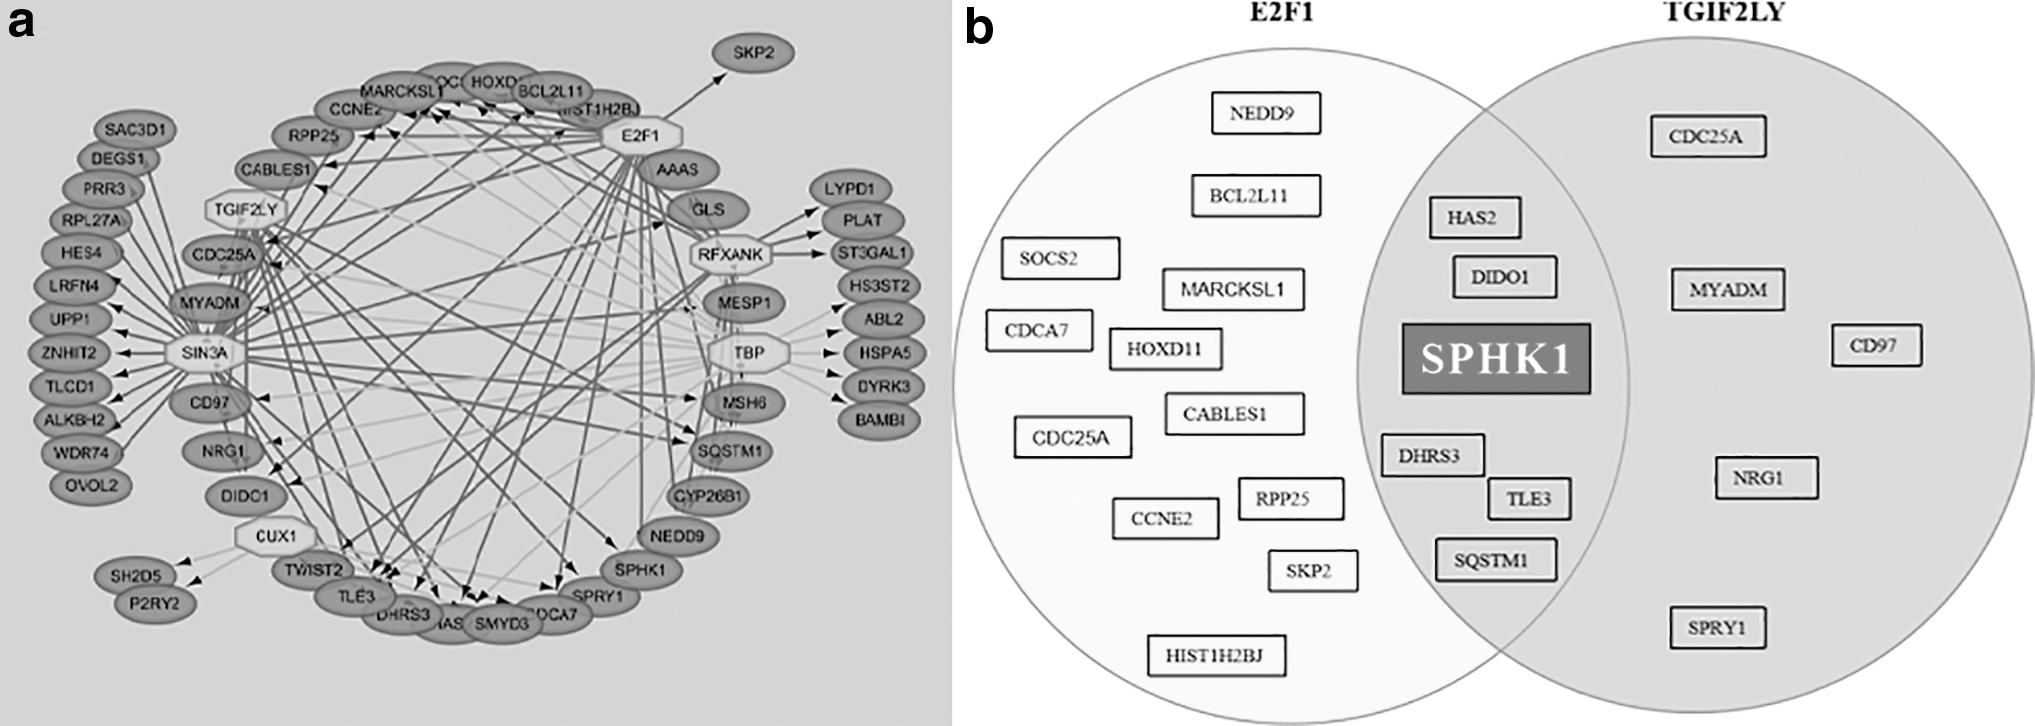
Diagrams representing DEGs and a regulatory network of TFs and predicted genes;
Transcription Factors and Target Genes Associated with 625 nm LED were Predicted by Iregulon Program
Bold indicates that SPHK1 is of interest.
NES, normalized enrichment score, SPHK1, sphingosine kinase 1; TF, transcription factor.
E2F1 regulates SPHK1 expression under normal conditions by 625 nm PBM
Whether E2F1 is affected by 625 nm PBM in the noninflammatory state should also be considered to determine whether E2F1 is sensitive to red light. The mRNA expression level of SPHK1 was increased in both the R60 and siCON+R60 groups (Fig. 2a). However, SPHK1 was significantly decreased in siE2F1+R60 group. Similar results were found in the protein levels of E2F1 and SPHK1 (Fig. 2b). Six hundred and twenty-five nanometer PBM decreased the phosphorylation level of NF-κB (p-NF-κBp65); however, after knocking down the E2F1, the expression level of p-NF-κBp65 increased (Fig. 2b). These data indicate that E2F1 positively affected SPHK1 expression at both mRNA and protein levels under 625 nm PBM, and E2F1 negatively regulated p-NF-κBp65 protein expression.
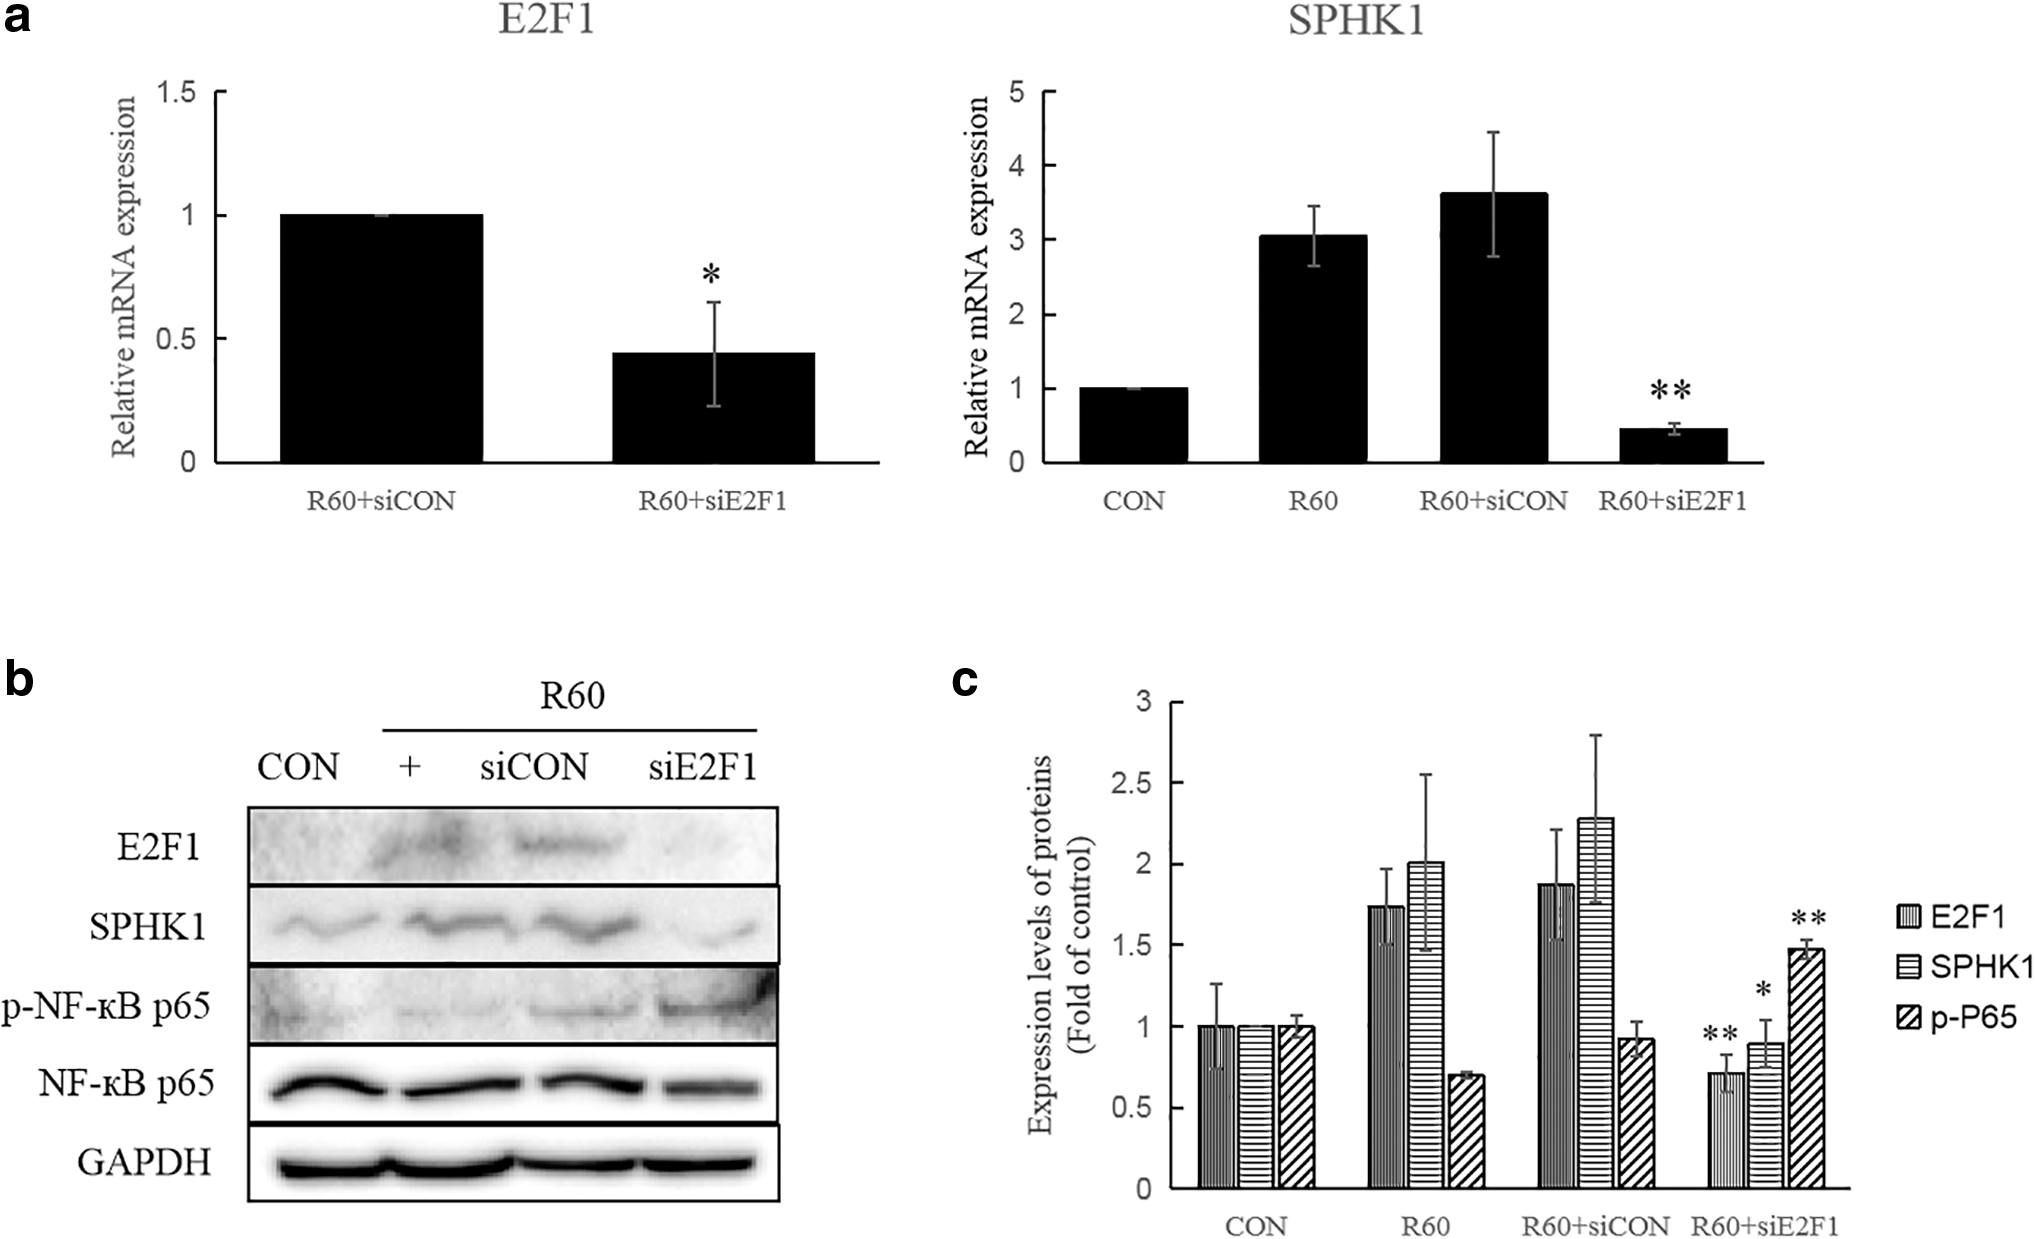
E2F1 regulating SPHK1 expression by 625 nm PBM under normal conditions.
Crosstalk of E2F1/SPHK1/HSP27 in 625 nm PBM treated inflammation
Next, we transfected specific E2F1-siRNA (siE2F1) in inflammatory model, followed by 625 nm PBM. After PMA treatment, both E2F1 and SPHK1 protein expression levels were decreased, whereas p-NF-κBp65 and phosphorylation of HSP27 (p-HSP27) were increased. However, the 625 nm PBM reversed the expression levels of proteins as mentioned above (Fig. 3). More than 60% of E2F1 was knocked down compared to the cells transfected with a scrambled control (Fig. 3a, b). E2F1 silencing significantly reduced the SPHK1 protein expression compared to the controls (Fig. 3a, b). However, p-NF-κBp65 was increased in the same condition (Fig. 3a, b). There was no significant change in p-HSP27 expression with or without E2F1 siRNA treatment (Fig. 3a, b). These data indicate that E2F1 positively affected SPHK1 expression and negatively affected p-NF-κBp65.
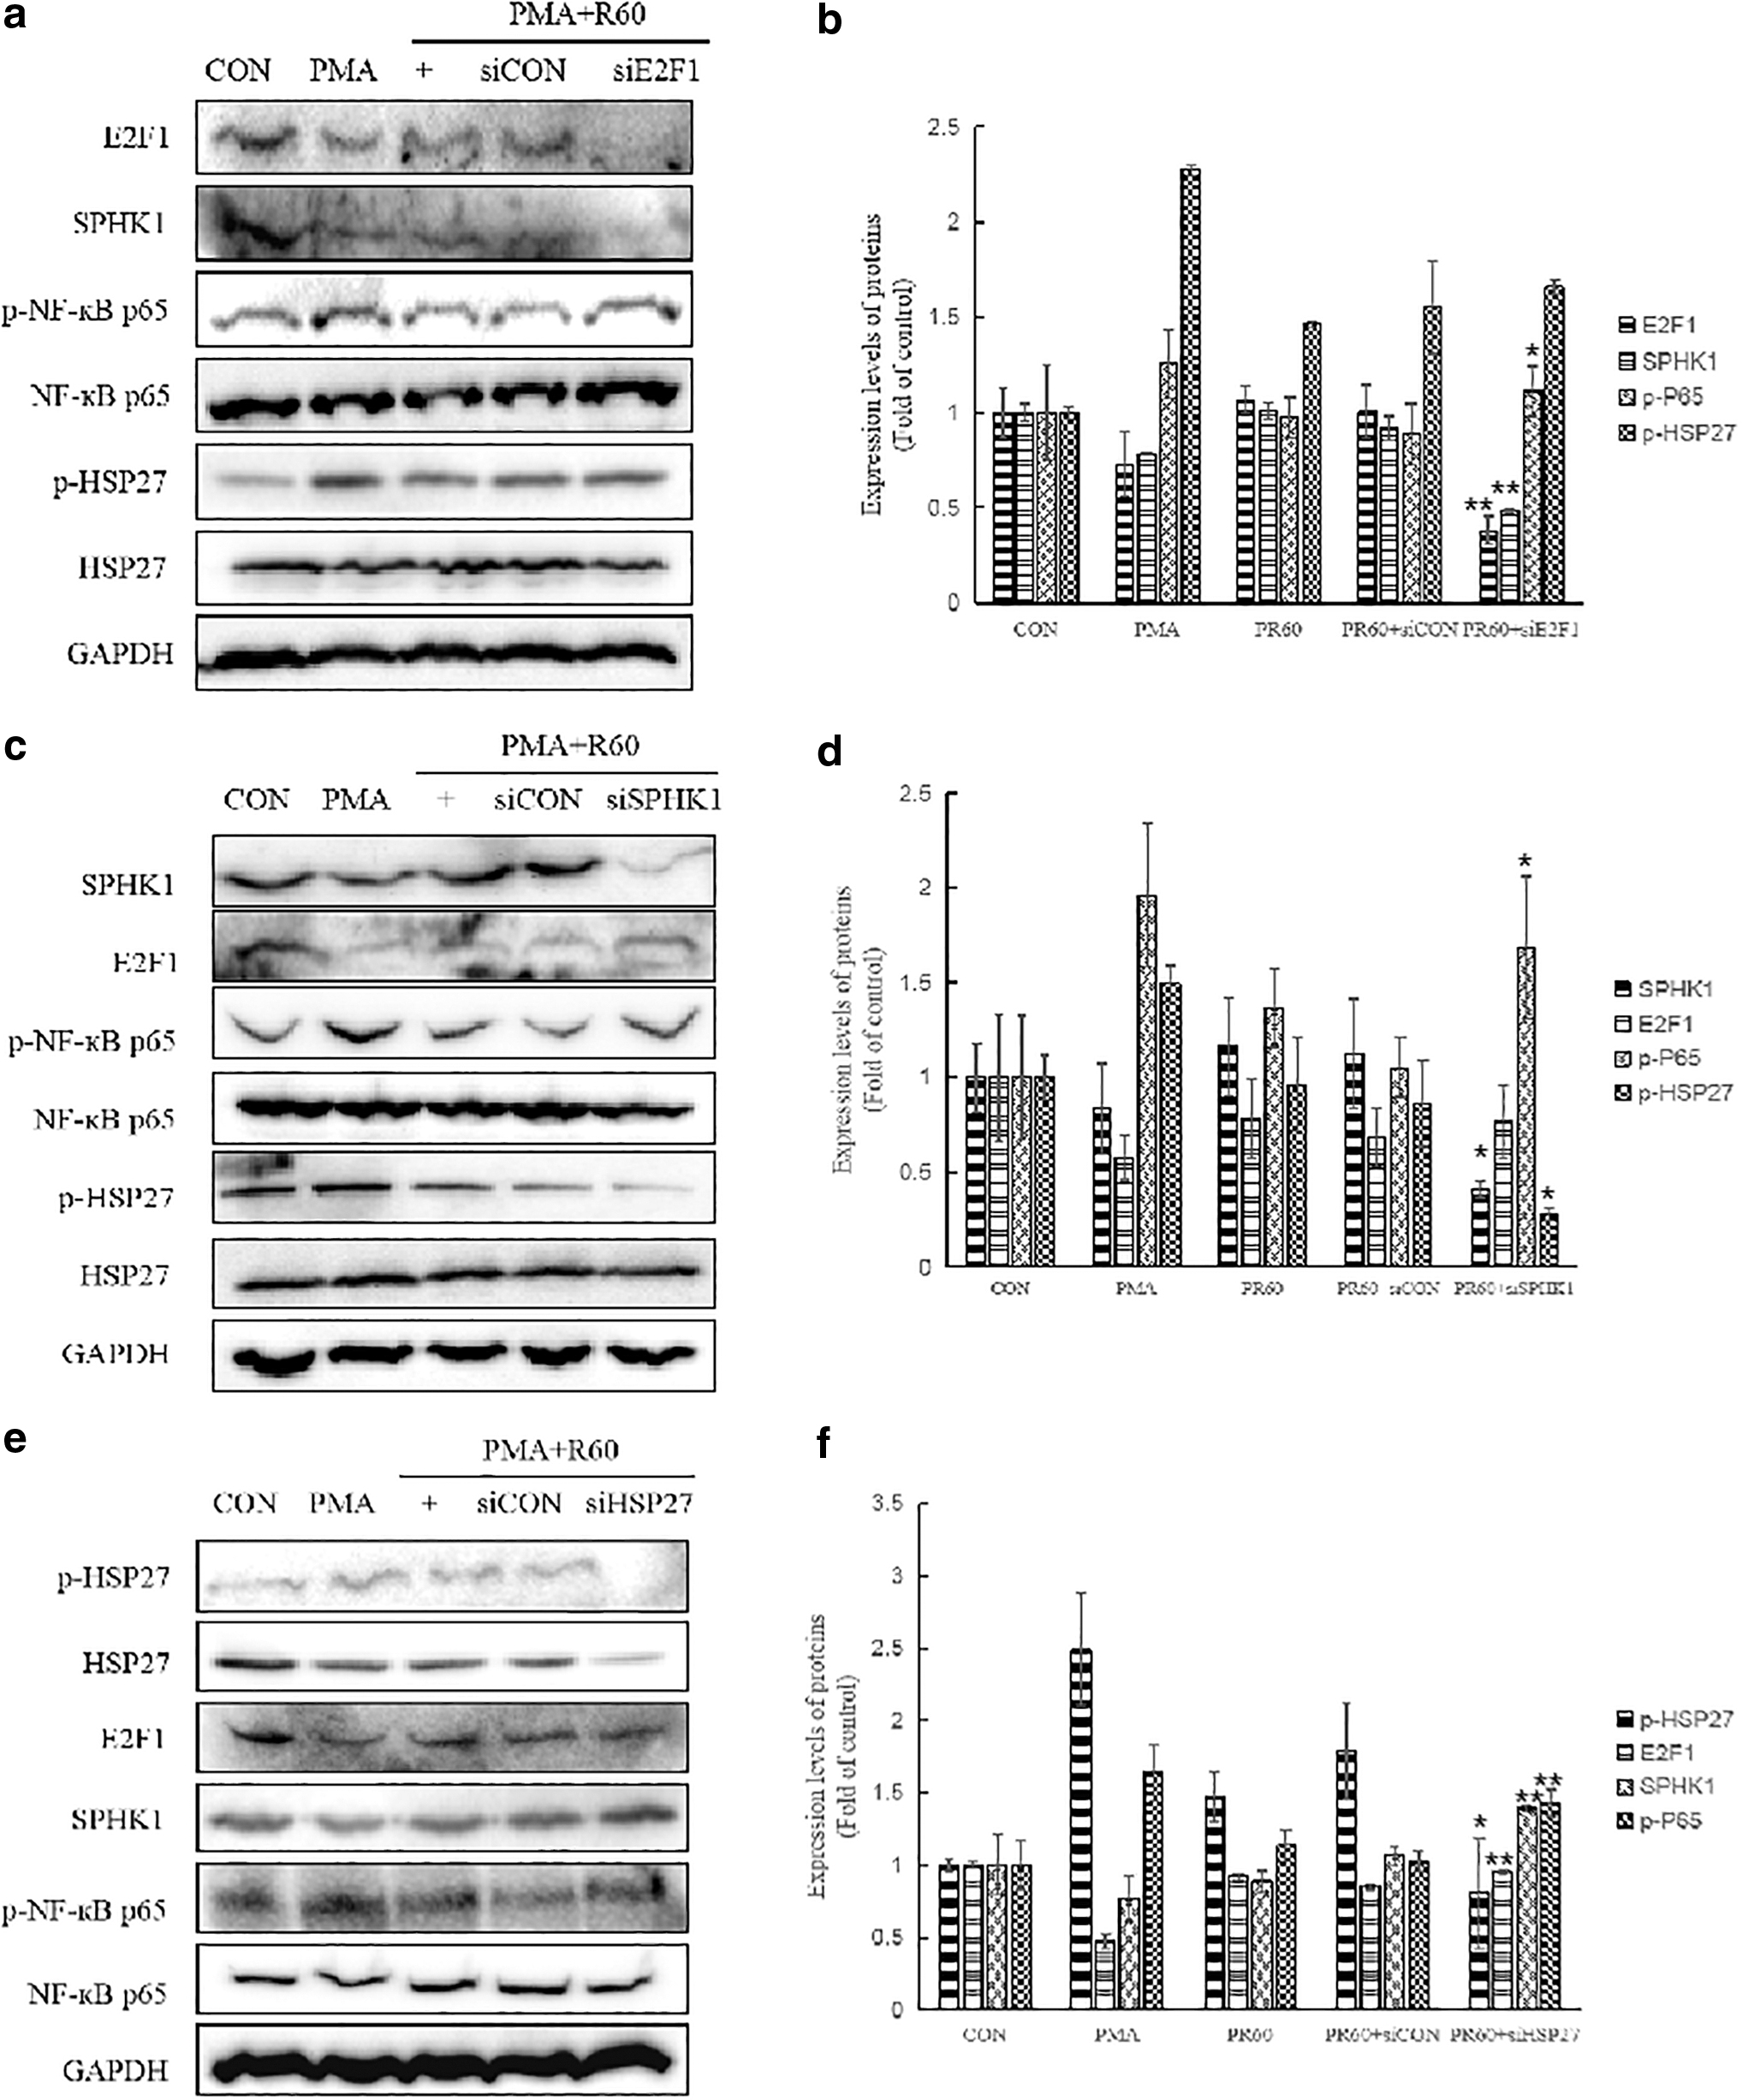
Crosstalk between E2F1, SPHK1, and HSP27 by 625 nm PBM in inflammatory in vitro model. Silencing SPHK1
More than 60% of SPHK1 was knocked down by the siRNA treatment (Fig. 3c, d). For E2F1 expression, there was no significant change between the siCON and siSPHK1 condition. The knockdown of SPHK1 decreased the expression of p-HSP27; however, it increased the expression of p-NF-κBp65 (Fig. 3c, d). These experiments suggested that E2F1 positively affected SPHK1 and SPHK1 positively affected HSP27. The inhibition of SPHK1 increased the expression level of p-NF-κBp65 in the HaCaT cells (Fig. 3c, d).
For the PMA condition, p-HSP27 expression increased, whereas its expression level was markedly decreased by the 625 nm irradiation (Fig. 3e, f). HSP27 knockdown (more than 50%) led to an increase in both SPHK1 and p-NF-κBp65 protein expression levels. However, E2F1 expression was not affected by siHSP27.
E2F1 is important for ROS scavenging by 625 nm PBM
E2F1 orchestrates the repression of oxidative metabolism and it can silence oxidative metabolic gene expression. 19 The role of E2F1 in ROS scavenging was investigated by measuring the intracellular ROS (Fig. 4). From the fluorescence microscopic image, the green color fluorescent intensity increased for PMA-treated cells compared to control. Post-treatment with 625 nm PBM significantly reversed the ROS intensity in PMA-treated cells. However, E2F1 knockdown remarkably increased the green color fluorescence in HaCaT cells compared to that in the cells treated with the scrambled siRNA sequence (Fig. 4a). Comparing the PR60+ siE2F1 group to the PR60+siCON group, the intensity of ROS increased approximately threefold (Fig. 4b), suggesting that 625 nm PBM lost its ROS scavenging function in the absence of E2F1.
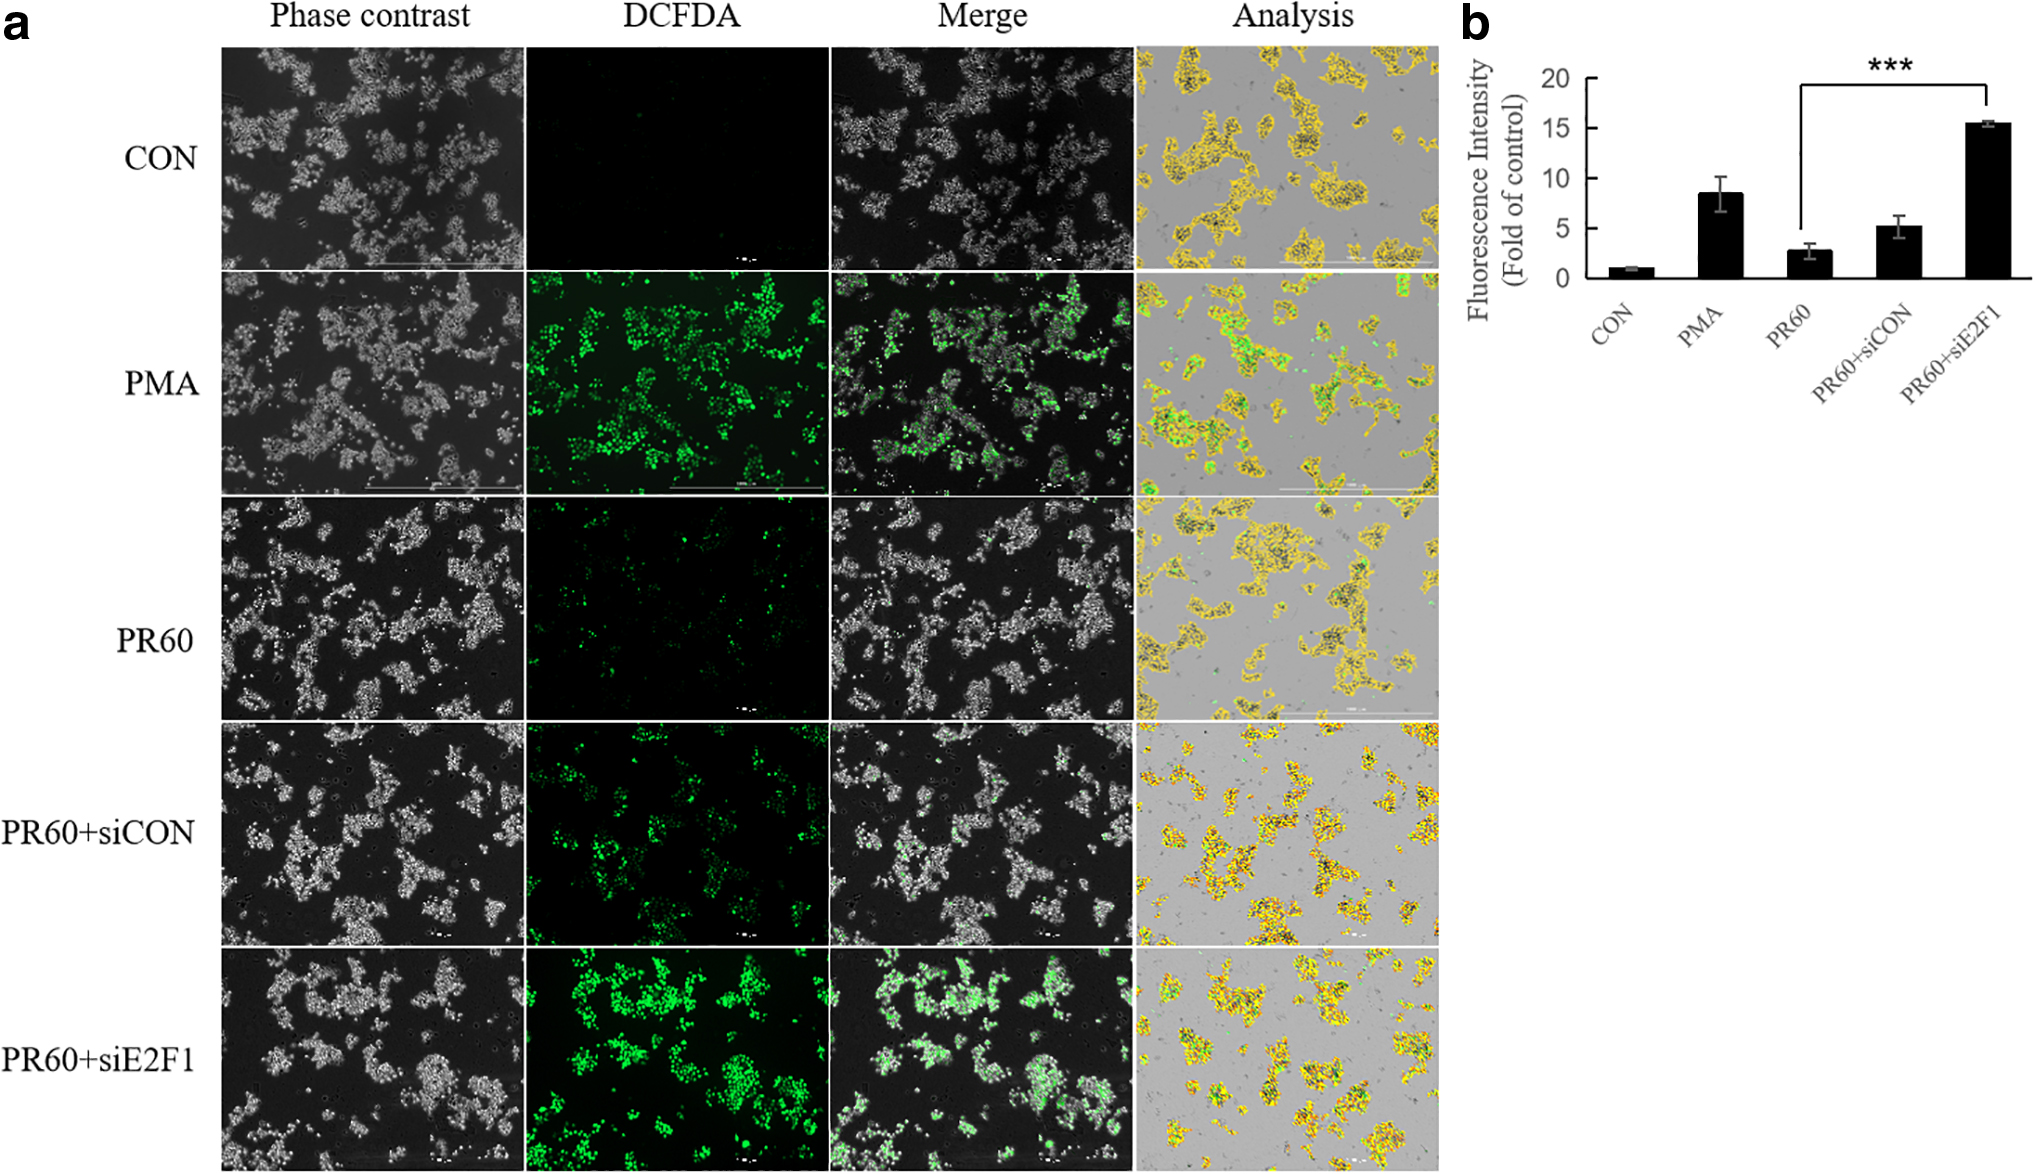
Effect of siE2F1 on intracellular ROS production in HaCaT cells.
Effect of E2F1 on PGE2 release irradiated by 625 nm PBM
The PGE2 level was increased upon PMA treatment, and 625 nm PBM resulted in a marked decrease in PGE2 release in both the PR60 and PR60+siCON groups (Fig. 5). Compared to control group, the concentration of PGE2 was increased by PMA (3.2-fold higher compared with the control). In the PR60 and PR60+siCON groups, PGE2 release was 0.67- and 0.79-fold lower compared with the PMA group. The decreased levels of PGE2 indicated the anti-inflammatory activity of 625 nm PBM. However, the silencing of E2F1 led to a remarkable increase of PGE2 release (2.94-fold higher compared with the siCON group). Therefore, E2F1-siRNA decreased the anti-inflammatory effects of 625 nm PBM in PMA-stimulated HaCaT cells.
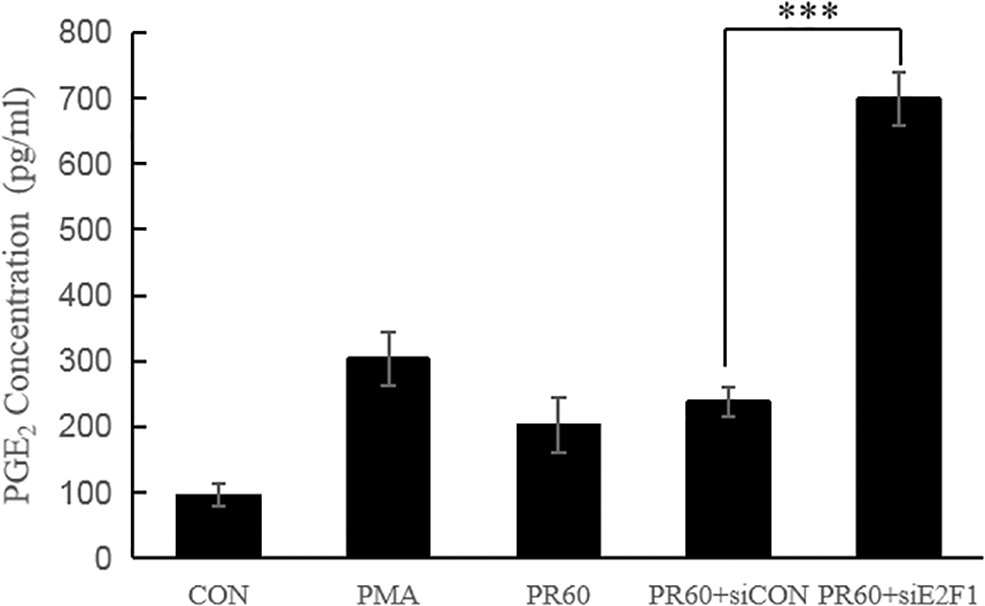
Effect of siE2F1 on PGE2 release in HaCaT cells. Release of PGE2 was measured from the cultured medium, and these were processed for analysis by ELISA. PMA group: HaCaT cells were stimulated with 12 ng/μL PMA for 3 h; PR60 group: cells were stimulated with PMA, followed by irradiation by 625 nm PBM for 1 h; PR60+siCON and PR60+siE2F1 group: cells were transfected with CON and E2F1 siRNA, respectively, and then stimulated with PMA and subsequently irradiated with 625 nm PBM. Significant differences were seen at ***p < 0.005 compared with the presence or absence of siE2F1. PGE2, prostaglandin E2; PMA, phorbol 12-myristate 13-acetate; PR60+siCON group, HaCaT cells were transfected with negative control siRNA and then treated the same as PR60 group; PR60+siE2F1 group, HaCaT cells were transfected with specific E2F1-siRNA and then treated the same as PR60 group.
Discussion
PBM has been known as a form of light therapy, which utilizes lasers, LEDs, or filtered lamps, in the visible and near infrared (NIR) spectrum. 20 Many wavelengths in the red (600–700 nm) and NIR (770–1200 nm) spectral regions have shown similar and positive results. 21 –23 It has been reported that red light is readily absorbed by blood and skin surface components, thus limiting tissue penetration (<10 mm). However, NIR light is not easily absorbed and has greater tissue penetration depth (>30–40 mm); therefore, it could provide greater photon deposition in the wound bed and show therapeutic healing effects. 24 Although both of red light and NIR light have antioxidant and anti-inflammatory effects, in the treatment of deeper wound, NIR could be expected for better effect. In our previous studies, 11,12 red light PBM ranging from 625 to 635 nm reduced inflammation as effectively as indomethacin or ibuprofen. Previous studies have shown that SPHK1 11 and HSP27 12 play important roles in the antioxidant and anti-inflammatory effects of red PBM. We assumed that there might exist a master regulator that affected both SPHK1 and HSP27 during red PBM.
In the present study, a total of 6 TFs (e.g., E2F1) and 51 key DEGs (e.g., SPHK1) were identified and were further validated by RT-PCR (Supplementary Fig. S3). Among these TFs, E2F1 and TGIF2LY worked as candidate TFs of SPHK1 (Fig. 1b). When using the Cytoscape iRegulon plugin, the NES was the output result. According to the results of the present study, the NES of E2F1 was higher compared with TGIF2LY. Saenz-Ponce et al. 18 reported that E2F1 controls SPHK1 expression. Therefore, we decided to undertake further studies of E2F1.
E2F1 induction results in the expression of numerous genes required for DNA synthesis. 25 PMA has previously been shown to decrease E2F1 activity and expression. 26,27 These findings are supported by the result that PMA reduced E2F1 expression, followed by the sequential downregulation of SPHK1 expression (Fig. 3a). Previous evidence has shown that E2F1 repressed mitochondrial biogenesis and oxidative phosphorylation 28 and affects other protein expression. 18 After red light PBM, both mRNA and protein expression levels of E2F1 were increased. In the same condition, expression of p-NF-κBp65 protein (Fig. 3), total ROS in the cells (Fig. 4), and PGE2 content (Fig. 5) were decreased. However, the silencing of E2F1 significantly reversed these phenomena, which suggested that E2F1 negatively regulated oxidative metabolism and inflammation. This result is supported by another study where the knockdown of E2F1 increased the oxidative metabolic-associated gene expression. 19 The knockdown of E2F1 also decreased SPHK1 expression, which indicated that E2F1 positively affected SPHK1. In the 625 nm PBM condition, E2F1 and SPHK1 expressions were increased, thereby leading to an anti-inflammatory effect. Because E2F1 worked as a TF of SPHK1, SPHK1 decreased during E2F1 silencing. Therefore, the antioxidant and anti-inflammation functions were lost without the presence of E2F1 and/or SPHK1 with red PBM. There are two isotypes of SPHK, designated SPHK1 and SPHK2. SPHK1 has been recognized as a key regulator of the delicate balance between cell proliferation and apoptosis. 29 Previous study found that 625 nm PBM exerts its antioxidant and anti-inflammation effects through SPHK1. However, distribution and expression of SPHK2 were not affected by 625 nm PBM (Supplementary Figs. S4 and S5).
HSP27 is a member of the small HSPs and is involved in diverse cellular functions such as stress tolerance, refolding of unfolded proteins, and the regulation of cytoskeleton dynamics, as well as cell cycle regulation. 30 –32 HSP27 is known to become rapidly phosphorylated by various agonists, including PMA. 33,34 In our previous study, HSP27 was essential for decrease of intracellular ROS and the inhibition of PGE2 secretion in the lipopolysaccharide-induced inflammatory model by red PBM. 12 To elucidate the relationship between ROS and HSP27, NAC was used to clear the PMA-induced ROS. The cleared ROS led to a decrease of p-HSP27 with or without PMA stimulation (Supplementary Fig. S6). The capacity of HSP27 is determined by the phosphorylation status, and our results showed that 625 nm PBM inhibited the phosphorylation of HSP27 in PMA-induced HaCaT cells, indicating that phosphor-HSP27 was decreased by 625 nm irradiation. When knocking down HSP27, SPHK1 expression slightly increased. As described above, the increase of SPHK1 has an anti-inflammatory function. However, in the absence of HSP27, 625 nm PBM could not reduce the inflammatory response, even if SPHK1 was increased. Moreover, a significant decrease in phosphorylated NF-κBp65 levels by 625 nm PBM was seen in control siRNA-treated HaCaT cells. However, 625 nm PBM could not decrease phosphorylation of NF-κBp65 in HSP27-silenced HaCaT cells. This also suggests that HSP27 is essential for 625 nm PBM-induced anti-inflammatory function.
Conclusions
In summary, E2F1 worked as a TF of SPHK1 and exhibited anti-inflammatory and antioxidative effects through SPHK1 in PMA-induced HaCaT cells irradiated with 625 nm PBM. In addition, HSP27 was essential for the 625 nm PBM-induced anti-inflammatory function. Therefore, the presence of E2F1/SPHK1 and HSP27 in 625 nm PBM caused a decrease in inflammation. They could be used as potential biomarkers for anti-inflammatory therapy using red LED PBM therapy.
Footnotes
Author Disclosure Statement
No competing financial interests exist.
Funding Information
This work was supported by the National Research Foundation of Korea grant funded by the Korean Government (MSIT) (No. 2019R1F1A1044073 and 2019R1F1A1056887 and 2019R1F1A1059492).
Supplementary Material
Supplementary Figure S1
Supplementary Figure S2
Supplementary Figure S3
Supplementary Figure S4
Supplementary Figure S5
Supplementary Figure S6
References
Supplementary Material
Please find the following supplemental material available below.
For Open Access articles published under a Creative Commons License, all supplemental material carries the same license as the article it is associated with.
For non-Open Access articles published, all supplemental material carries a non-exclusive license, and permission requests for re-use of supplemental material or any part of supplemental material shall be sent directly to the copyright owner as specified in the copyright notice associated with the article.