




Abstract
This study analyzed GE Centricity Electronic Medical Record (EMR) data to examine the effects of body mass index (BMI) and obesity, key risk factor components of metabolic syndrome, on the prevalence of 3 chronic diseases: type II diabetes mellitus, hyperlipidemia, and hypertension. These chronic diseases occur with high prevalence and impose high disease burdens. The rationale for using Centricity EMR data is 2-fold. First, EMRs may be a good source of BMI/obesity data, which are often underreported in surveys and administrative databases. Second, EMRs provide an ideal means to track variables over time and, thus, allow longitudinal analyses of relationships between risk factors and disease prevalence and progression. Analysis of Centricity EMR data showed associations of age, sex, race/ethnicity, and BMI with diagnosed prevalence of the 3 conditions. Results include uniform direct correlations between age and BMI and prevalence of each disease; uniformly greater disease prevalence for males than females; varying differences by race/ethnicity (ie, African Americans have the highest prevalence of diagnosed type II diabetes and hypertension, while whites have the highest prevalence of diagnosed hypertension); and adverse effects of comorbidities. The direct associations between BMI and disease prevalence are consistent for males and females and across all racial/ethnic groups. The results reported herein contribute to the growing literature about the adverse effects of obesity on chronic disease prevalence and about the potential value of EMR data to elucidate trends in disease prevalence and facilitate longitudinal analyses. (Population Health Management 2010;13:151–161)
Introduction
The various definitions and indicators noted have been used to assess the prevalence of metabolic syndrome and the clinical outcomes of patients in several large observational and interventional cohorts. 8 –13 Among the more prominent data sets are those of the Framingham Study, including the Framingham Offspring Study, in the United States, and the General Practice Research Database in the United Kingdom, the largest non-US database of “anonymized” primary care medical records. 14,15
Turning to the effects of body mass index (BMI) and obesity, Bays and colleagues 16 explored the relationships between BMI and prevalence of diabetes, hypertension, and dyslipidemia, examined BMI distributions among patients with these conditions, and compared results from 2 national surveys: (1) the screening questionnaire-based 2004 Study to Help Improve Early evaluation and management of risk factors Leading to Diabetes (SHIELD), and (2) the interview, clinical, and laboratory data of the 1999–2002 National Health and Nutrition Examination Surveys (NHANES). Bays et al found that mean BMI was virtually identical in the 2 data sets: 27.8 kg/m2 for SHIELD and 27.9 kg/m2 for NHANES. Increased BMI was associated with increased prevalence of diabetes mellitus, hypertension, and dyslipidemia in both studies (P < 0.001). For each condition, more than 75% of patients had a BMI > 25 kg/m2. Estimated prevalence of diabetes mellitus and hypertension was similar in both studies, while prevalence of dyslipidemia was substantially higher in NHANES than SHIELD.
McTigue et al 17 studied 90,185 women who participated in the Women's Health Initiative to determine how cardiovascular and mortality risks differ across clinical weight categories in women, especially the extreme obesity category. The duration of follow-up averaged 7.0 years (1993–2004). The researchers found that, among women, extreme obesity prevalence differed with race/ethnicity, from 1% among Asians and Pacific Islanders to 10% among black women. All-cause mortality rates per 10,000 person-years were 68.49 (95% confidence interval [CI], 65.26–71.68) for normal BMI (<25), 71.16 (95% CI 67.68–74.82) for overweight (25 ≤ BMI < 30), 84.47 (95% CI 78.90–90.42) for obesity 1 (30 ≤ BMI < 35), 102.85 (95% CI 92.90–113.86) for obesity 2 (35 ≤ BMI < 40), and 116.85 (95% CI 103.36–132.11) for extreme obesity (BMI ≥ 40). Analyses adjusting for the effects of age, smoking, educational achievement, region of the United States, and physical activity level showed that weight-related all-cause mortality risk, coronary heart disease (CHD) mortality, and CHD incidence did not differ by race/ethnicity. Such adjusted analyses among both white and black participants showed positive trends in all-cause mortality and CHD incidence with increasing weight. Much of the obesity-related mortality and CHD risk was mediated by diabetes, hypertension, and hyperlipidemia. For white women, weight-related all-cause mortality risk varied by age, with obesity producing less risk among older women. McTigue and colleagues advocate using more weight categories and conclude that “considering obesity as a body mass index of 30 or higher may lead to misinterpretation of individual and population risks.”
Sturm 18 asserts that “the most serious health problems are not associated with overweight or moderate obesity … but with clinically severe or morbid obesity (eg, more than 100 pounds (45 kg) overweight).” He uses data from the Behavioral Risk Factor Surveillance System to estimate trends for extreme weight categories (BMI > 40 and BMI > 50) for the period from 1986–2005 in the United States and assesses whether trends have changed since 2000. Sturm finds that from 2000–2005, while the prevalence of obesity (self-reported BMI > 30) increased by 24%, the prevalence of BMI > 40 increased by 50% and the prevalence of BMI > 50 increased by 75%. Sturm concludes that “the heaviest BMI groups have been increasing at the fastest rates for 20 years” and that “because comorbidities and resulting service use are much higher among severely obese individuals, the widely published trends for overweight/obesity underestimate the consequences for population health.”
The analyses reported herein employ GE Centricity a electronic medical record (EMR) data to assess the prevalence of the 3 chronic conditions and the role of obesity in their etiology and progression. The GE database comprises the “anonymized” longitudinal medical records of over 6 million patients, is considered one of the few high-quality patient databases available commercially, and is generally representative of the population of the United States.
A growing proportion of ambulatory care physician practices in the United States are adopting EMR systems to support various clinical processes including documentation of patient encounters and secure exchange of data with other providers. In 2007, the GE Centricity EMR was used by more than 20,000 clinicians in 49 states for medical record documentation for approximately 30 million patients. These electronic records contain a wide range of demographic and clinical variables. The structured user interface supports consistent and accurate documentation by physicians and thus promotes internal data validity for each patient and for the aggregate. As with other EMRs, a significant attribute of Centricity is its capacity to track patients' clinical conditions over time and, thus, to support longitudinal multivariate analytic designs, including retrospective cohort studies. Cumulatively, these attributes of Centricity and other EMRs make them rich resources for population health and outcomes research.
Research interest in the GE Centricity database is evident in the growing peer-reviewed literature employing this resource. Our review of recently published peer-reviewed literature employing GE Centricity EMR data revealed 2 especially useful and relevant studies. First, Brixner et al 19 used clinical, diagnostic, and treatment/prescription information in the Centricity database to examine the prevalence of cardiometabolic risk (CMR) factors that contribute to metabolic syndrome in the primary care setting. The authors concluded that “ … the distribution of CMR factors in a primary care database is similar to that established by prospective national health surveys such as NAMCS. A key method for identifying risk factors is using clinical outcomes, including BMI and lab values. Future studies on metabolic syndrome need to link clinically based information with more readily available treatment and diagnosis information.” The second noteworthy study employing Centricity data is Gill and Chen's 2008 evaluation of lipid management (ie, adequacy of lipid testing, achievement of lipid goals, appropriate use of lipid-lowering medication). 20 The authors note that “National EHR networks are excellent vehicles for large outpatient quality of care studies, particularly for measuring clinical outcomes such as lipid levels.” These studies demonstrate that national EMR databases such as Centricity are valuable tools for epidemiological, outcomes, and health services research.
Methods
GE Centricity Database
The GE Centricity database captures patient-level clinical data elements obtained from the Centricity Physician Office EMR (formerly Logician) for Clinical Data Services (CDS) reporting. The Centricity EMR and its predecessors have been in use for over 20 years, are certified by the Certification Commission for Healthcare Information Technology, and are currently used by over 30,000 clinicians throughout the United States. The CDS database contains data from 133 provider groups with 7259 clinicians (including approximately 60% primary care providers and 40% specialists) at 98 installations. The CDS database includes de-identified, standardized data on more than 8.9 million patients, with the median duration of documentation being 985 days, or approximately 2.7 years. Among the strengths of the Centricity database are its incorporation of documentation of a wide range of diagnostic and therapeutic services, specifically laboratory test results (with exact amounts and units of measurement) and medications ordered, and, perhaps most important, inclusion of the above-mentioned data at multiple points in time, allowing longitudinal analyses not possible with most other data sets.
While the CDS database includes a large and diverse group of providers, participation is voluntary, raising concerns regarding self-selection by providers. For example, Gill and Chen suggest that “practices that are more interested in measuring (and improving) quality of care are more likely to join MQIC [Medical Quality Improvement Consortium].” 20 Moreover, a recent study by Oderda et al 21 that compared the patient population in MQIC to the general US population found that the MQIC population is older (with approximately 50% age 45 years or older, compared to 37% of the US population), more likely to be from the northeast or midwest regions (62% vs. 41%), and more likely to have commercial insurance (73% vs. 59%) or Medicare (20% vs. 11%). However, the MQIC population is very similar in its racial distribution (79% vs. 81% white, 15% vs. 13% African American). Although the proportion of patients with hypertension in the MQIC database is virtually identical to that of the US population (25.9% vs. 25.8%), according to data from the National Health Interview Survey, the proportion with diabetes is somewhat higher (9.8% vs. 7.4%). To summarize, as Gill and Chen note, “while the MQIC population differs somewhat from the general US population, it is unclear whether this reflects differences in persons who seek care in outpatient settings, differences in providers who use an EHR [electronic health record], or differences in providers who use an EHR and join MQIC.” 20
Among the specific potential limitations of the Centricity database are (1) invalid retrospective patient data, (2) unconfirmed diagnoses, and (3) duplicate patient data. The present research design addresses these 3 potential limitations by applying inclusion/exclusion criteria to maximize the validity of the data.
Inclusion/exclusion criteria
Exclusion of invalid retrospective patient data
When a new provider's data are entered into the Clinical Data Services database, the visit dates may be back-filled, and thus may be inaccurate (ie, the database entry date is assigned as the visit date for activities that occurred long before that date). As a result of the potential inaccuracy of visit dates, the duration and prevalence of chronic conditions may be underestimated. Therefore, the research design used herein excludes patient data for the first year after the patient data were initially entered into the database.
Exclusion of unconfirmed diagnoses
Patients merely evaluated for a condition and patients with confirmed diagnoses have identical International Classification of Diseases, Ninth Revision (ICD-9) codes in the database. Exclusion criteria were developed to exclude instances when patients were merely evaluated for a diagnosis (with no confirmation of the evaluated diagnosis) through the following algorithm: (a) include only records where the Diagnosis Qualifier contains any of the phrases “diagnosis of,” “hospitalized for,” “history of” (but not “family history of”), “minor diagnosis of,” “take note of,” “recurrence of,” or “status post”; and (b) exclude records where the Problem Concept description contains any of the phrases “rule out,” “family history of,” “risk of,” or “screening.”
Further investigation may reveal that disease counts should be supplemented with data derived from sources in the database other than problems and explicit ICD-9 diagnosis codes. For instance, for diabetes, there may be a medication record indicating regular use of insulin or oral hypoglycemics for a patient with no ICD-9 diagnosis code for diabetes in the database. Likewise, for hypertension, there may be recorded observations of blood pressure for a patient who may not have an ICD-9 diagnosis code for hypertension in the database.
Exclusion of duplicate patient data
An exclusion algorithm was applied to exclude cases for which there was potential duplication of patient data as a result of a patient visiting more than 1 Centricity client practice. This is critical because the data are “anonymized” (ie, all unique patient identifiers are removed in the de-identification process). To avoid duplication of patients, the research design specified exclusion of data originating from 3-digit zip codes containing 3 or more providers who employ the Centricity EMR system. The rationale for this exclusion criterion is that a patient residing in a 3-digit zip code area that contains more than 1 practice employing Centricity may appear in the database as more than 1 patient.
In addition to applying the aforementioned inclusion/exclusion algorithms, additional data (ie, diagnosis and procedure codes, patient age) were obtained from the Centricity EMR database. Current Procedural Terminology (CPT) code numbers indicating specific procedures can be found in either the Order table or the Problem table, requiring that both be mined to identify procedures. To identify each procedure, our design scanned all records in both of these tables to identify relevant CPT procedure codes. Likewise, age was derived from either the “Activity Fact” table or the “Patient Dimension” table, with preference given to the former table. A summary of the results of employing these inclusion/exclusion algorithms is shown in Figure 1.
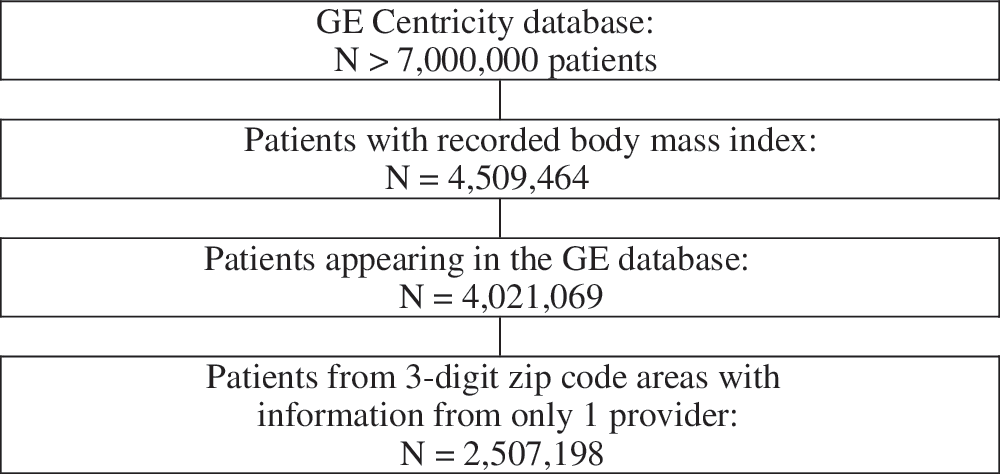
Attrition flow diagram.
Analytic methods
Patient age groups used in the bivariate analyses are <18 years, 18–24, 25–34, 35–44, 45–54, 55–59, 60–64, 65–69, and ≥70. For simplicity, the age groups used in the multivariate analyses are <20, 20–39, 40–59, and ≥60 years. The narrower age ranges were selected so as to discern subtle patterns as well as general ones. BMI categories are BMI < 18.5, 18.5 ≤ BMI < 25, 25 ≤ BMI < 30, 30 ≤ BMI < 35, 35 ≤ BMI < 40, 40 ≤ BMI < 45, 45 ≤ BMI < 50, and BMI ≥ 50; these categories were likewise selected to be sufficiently narrow to detect subtle patterns. Racial/ethnic categories include white, African American, Hispanic, Oriental/Asian, Native American, Other, and Unknown.
In the initial analyses, contingency tables were used to assess the bivariate relationships of BMI category, age group, sex, and race/ethnicity with the diagnosed prevalence of type II diabetes mellitus, hyperlipidemia, and hypertension. Sets of 3-way tables stratified the relationships between BMI category and diagnosed prevalence of the 3 diseases as a function of age group, sex, and race/ethnicity. Next, a contingency table was used to assess the relationship between BMI category and the diagnosis of obesity per se. Finally, logistic regressions were performed to summarize the effects of demographic factors (age, sex, and race/ethnicity), obesity, and comorbidities on the prevalence of each of the 3 conditions. These analyses consisted of an initial step including only the demographic factors and obesity, and then a second step adding the relevant comorbidities.
Results
Figures 2 –5 and Table 1 present GE Centricity EMR results for the number and percent distribution of patients with diagnosed type II diabetes, hyperlipidemia, and hypertension, as a function of patient BMI, age group, race/ethnicity, and sex, for the United States in 2005. The GE Centricity data show that the prevalence of each condition is positively associated with both BMI and age (see Figs. 2 and 3). Figure 4 shows the associations between race/ethnicity and disease prevalence, and indicates that African Americans have the highest proportions of patients with diagnosed diabetes (12.1%) and hypertension (28.9%), while whites have the highest proportion with diagnosed hyperlipidemia (25.7%). The associations between sex and disease prevalence are shown in Figure 5, which portrays how males are more likely than females to have each of the 3 conditions: 9.3% vs. 7.2% have diabetes, 25.1% vs. 19.2% have hyperlipidemia, and 22.8% vs. 20.1% have hypertension.
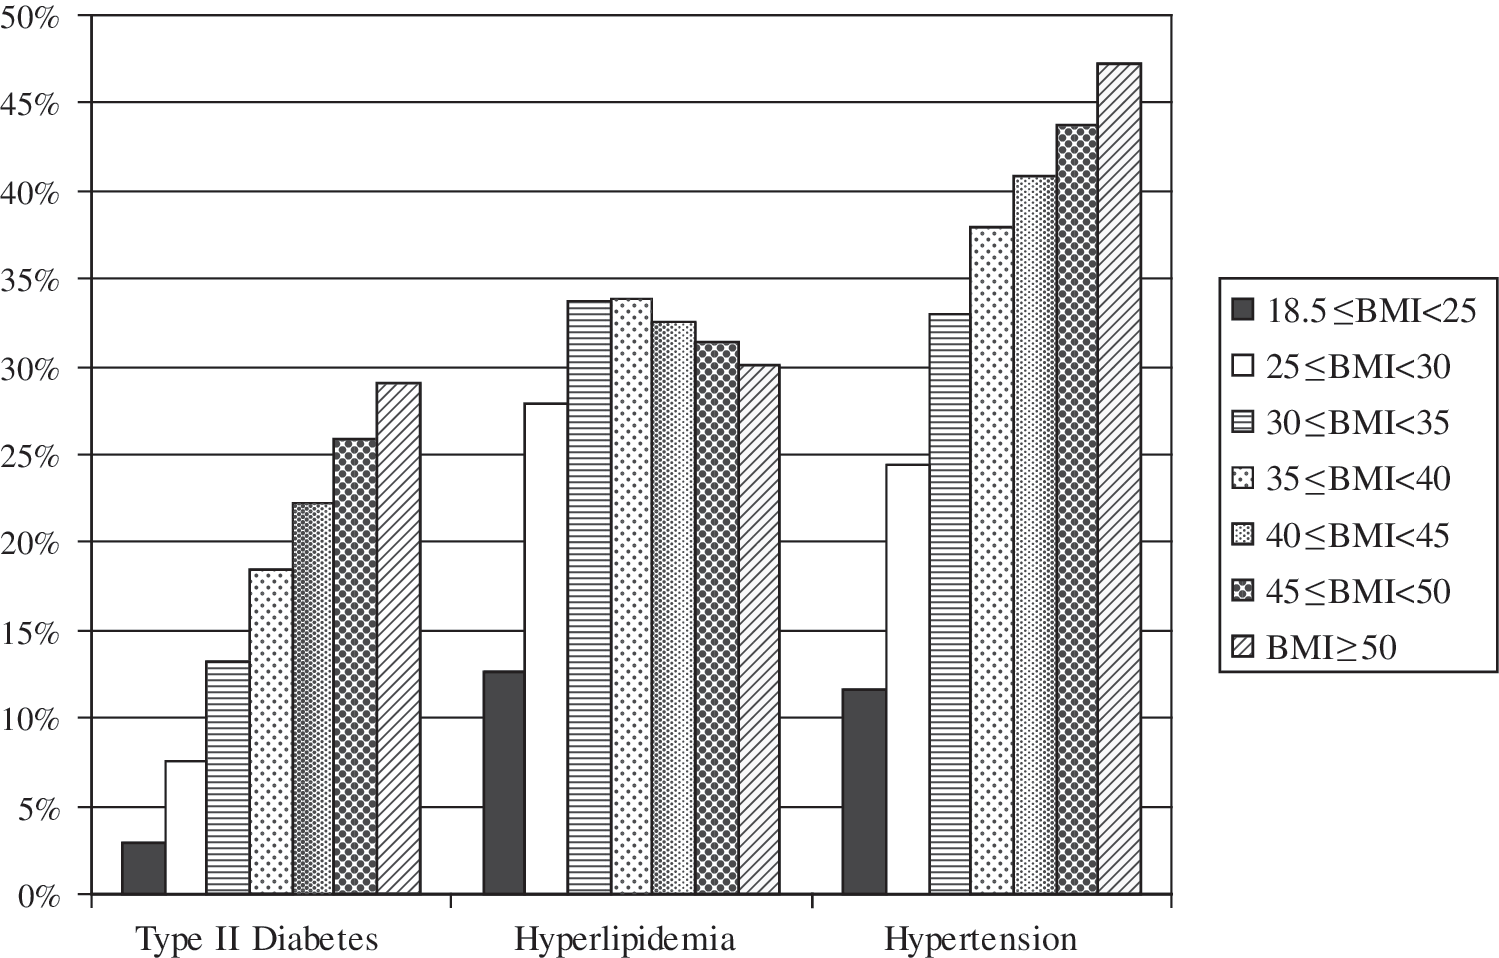
Diabetes, hyperlipidemia, and hypertension prevalence by BMI category.

Diabetes, hyperlipidemia, and hypertension prevalence by age group.
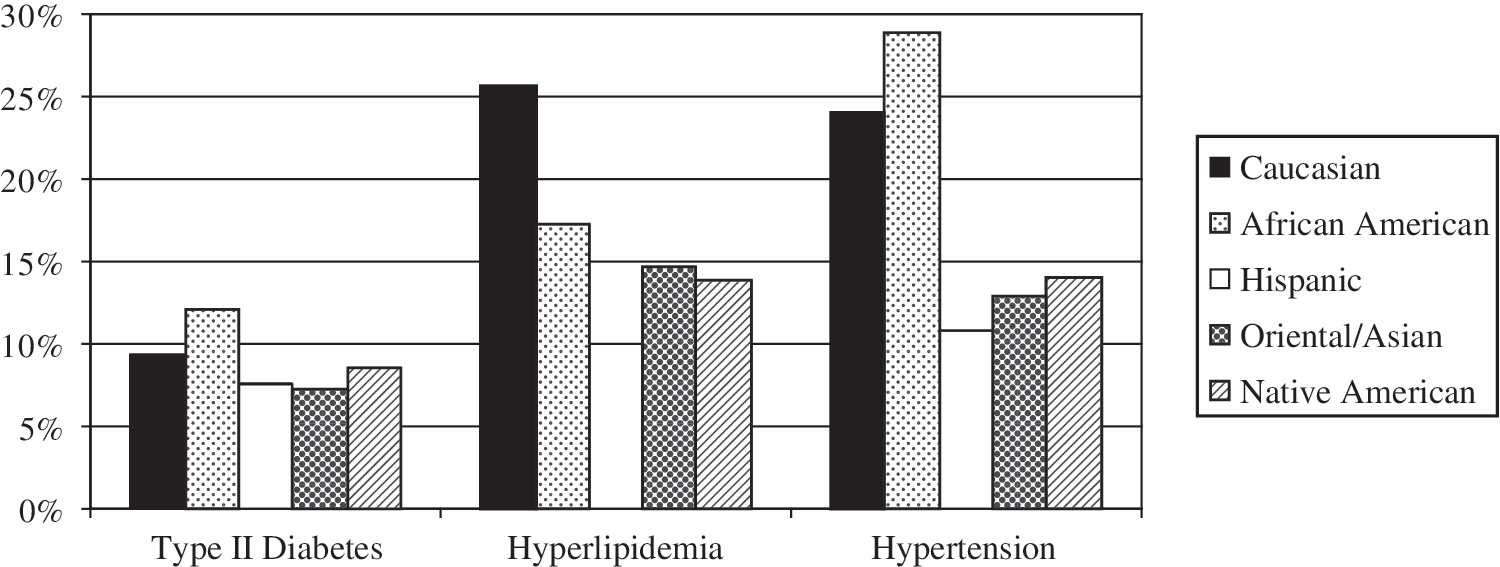
Diabetes, hyperlipidemia, and hypertension prevalence by race/ethnicity.
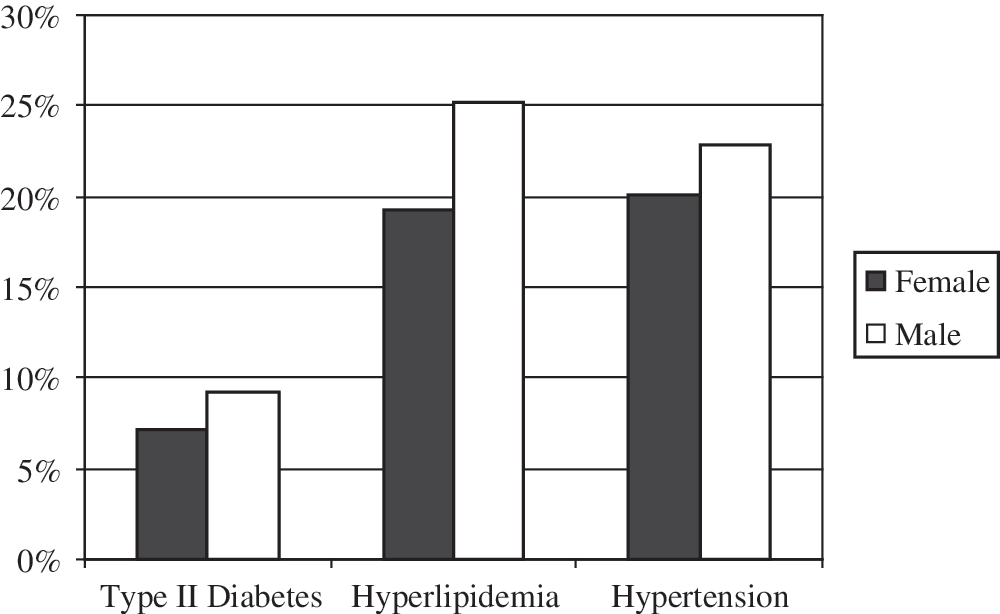
Diabetes, hyperlipidemia, and hypertension prevalence by sex.
As shown in Figures 2 and 3 and Table 2, the proportions of patients with type II diabetes mellitus, hyperlipidemia, and hypertension increase as both BMI and age increase. Figures 6A, 6B, and 6C show the combined effects of BMI and age on the prevalence of diabetes mellitus, hyperlipidemia, and hypertension, respectively. There are strong linear associations between both age and BMI and disease prevalence for all 3 conditions, and these associations are consistently additive rather than interactive, that is, age and BMI combine in a straightforward fashion without any marked unpredictable interactions. Among the oldest patients (≥60) with the highest BMIs (≥50), the highest disease prevalences are found: 50.0% for diabetes, 52.3% for hyperlipidemia, and 72.6% for hypertension. There are only a few small inconsistencies in the linear relationships noted between BMI and disease prevalence after stratifying by age group; almost all of these inconsistencies reflect slightly higher disease prevalence for the underweight (<18.5 BMI) group compared to the next lowest BMI group (18.5 ≤ BMI < 25); these may reflect the effect of disease on underweight status rather than the effect of underweight status on disease.

Prevalence of (
Table 3 shows the combined effects of BMI and sex on the prevalence of diabetes, hyperlipidemia, and hypertension. As noted above, males have a higher prevalence of all 3 conditions, and the direct association between BMI and disease prevalence is virtually identical for males and females.
Table 4 shows the combined effects of BMI and race/ethnicity on the prevalence of diabetes, hyperlipidemia, and hypertension. As was true for the combined effects of BMI and sex, the positive association between BMI and disease prevalence is highly consistent across all of the racial/ethnic groups.
Table 5 presents results of the association between BMI and the diagnosis of obesity. While BMI and reports of obesity as a medical problem are positively associated, obesity is substantially underreported. The medical definition of obesity includes having a BMI of 30 or above. However, only a little more than 10% of patients with 30 ≤ BMI < 35 are reported as obese, and only 57% were reported as obese at the highly serious threshold of BMI ≥ 50.
ICD-9-CM diagnosis codes 278.00 and 278.01
The final analyses reported herein (Table 6) are logistic regressions that summarize the effects of demographic factors, obesity, and comorbidities on the prevalence of each of the 3 chronic conditions. These analyses begin with inclusion of the demographic factors and obesity and then add the relevant comorbidities. The analyses of diabetes prevalence reinforce the findings presented above: Whites have a higher risk of having diabetes than the reference category (odds ratio [OR] = 1.377), but African Americans and Hispanics have even higher odds (ORs = 2.201 and 2.754, respectively); males have higher odds than females (OR = 1.517); increasing age increases one's odds of having diabetes (for each year, OR = 1.060); and obesity leads to higher odds of having diabetes (OR = 1.113).
Variable(s) entered: White, African American, Hispanic, age, obesity, sex.
Similarly, the logistic regression analyses of hypertension prevalence reinforce the findings presented earlier: Whites have a higher risk of having hypertension than the reference category (OR = 1.257), and African Americans have even higher odds (OR = 2.572), but the odds for Hispanics are lower than those for whites (1.198); males have higher odds than females (OR = 1.269); age increases one's odds of having hypertension (for each year, OR = 1.077); and obesity also leads to higher odds (OR = 1.094).
The logistic regression analyses of hyperlipidemia prevalence also confirm the earlier findings: while whites have a higher risk of having hyperlipidemia than the reference category (OR = 1.275), African Americans and Hispanics have lower odds (ORs = 0.911 and 0.937, respectively); males have higher odds than females (OR = 1.560); age increases one's odds of having hyperlipidemia (for each year, OR = 1.062); and obesity also leads to higher odds (OR = 1.059).
Discussion
The key role of obesity in the etiology of chronic disease in the United States is a focus of health researchers, health policy experts, and policy makers. For example, the American Heart Association and National Heart, Lung, and Blood Institute Scientific Statement includes, as one of its 7 conclusions, that “in the United States, the [metabolic] syndrome is strongly associated with the presence of abdominal obesity.” The Statement also “recognizes several issues related to the metabolic syndrome that require additional research for clarification. Foremost is the need for improved strategies to achieve and sustain long-term weight reduction and increased physical activity.” 22 Similarly, the Seventh Report of the Joint National Committee on Prevention, Detection, Evaluation, and Treatment of High Blood Pressure includes obesity along with hypertension, dyslipidemia, and diabetes mellitus in its list of 9 major cardiovascular risk factors. 23
Utilizing the longitudinal data available in the GE Centricity EMR database, this study has assessed the associations between obesity and 3 key chronic disease states: type II diabetes, hyperlipidemia, and hypertension. The positive association between obesity and the 3 comorbid conditions in the GE Centricity database is similar to that found for the US population using other data sets and methods. Although obesity is underdiagnosed as an explicit problem in the Centricity EMR, as it is in medical records generally, the inclusion of BMI data in the Centricity database allows identification of obesity and allows estimation of the degree to which it is underreported.
The EMR data show both the high rates of prevalence of the 3 chronic diseases and the significant role of obesity in their etiology. Both bivariate and multivariate analyses document the role of obesity in predicting and explaining the prevalence of the 3 conditions and the value of the BMI data found in the Centricity EMR. While the demonstrated impact of obesity is strong, this impact is most likely underestimated by using only 5 years of data, as was done in these analyses. Further analyses should be performed utilizing a longer time frame, an opportunity which will be facilitated by the expanding use of EMRs in the future.
Additional implications of the current analyses relate to optimal methods of analyzing EMR data. Specifically, exclusion algorithms were used to exclude retrospectively entered patient data, unconfirmed diagnoses, and duplicate patient data. Further research is needed to assess the feasibility and effectiveness of the existing techniques to maximize validity, as well as the extension of these techniques and development of additional ones.
Limitations
The limitations of this study originate primarily from 2 sources: (1) limitations of medical records in general and EMRs in particular, and (2) limitations that have been identified in the GE Centricity EMR database in particular. All medical records, manual or electronic, are subject to threats to validity, although EMRs generally reduce data errors and increase data validity compared to paper charts. For example, EMRs eliminate the problem of illegibility; yet EMR users can still make data entry errors. Similarly, regardless of whether records are manual or electronic, there will be gaps if information is not forwarded from one provider to another, even though EMRs should eventually improve such information exchange. Additionally, there may also be free text data in an EMR that are not available for analysis because of the complexities and costs of text mining. Still, in general, EMRs have great potential to mitigate many of the above-mentioned problems.
The second class of methodological limitations, those identified as potential problems in using GE Centricity EMR data, include invalid retrospective patient data, unconfirmed diagnoses, and duplicate patient data. As described earlier, inclusion/exclusion algorithms were developed and applied to address each of these issues. However, available data do not allow comprehensive assessment of the success of this strategy to eliminate all possible duplication and underestimation/overestimation. A specific potential limitation of the study stems from the fact that physicians' diagnoses of hypertension may not have taken into account that, for diabetics, hypertension is defined as systolic blood pressure ≥130 mmHg and diastolic blood pressure ≥80 mmHg, while for other populations, systolic blood pressure is defined as ≥140 mmHg and diastolic blood pressure is defined as ≥90 mmHg. However, it is unlikely that physicians failed to take this distinction into account when making diagnoses and recording problems. Still, to the degree that this distinction was ignored in physicians' diagnoses, the present analyses underestimate diabetes prevalence and probably underestimate associations between prevalence of diabetes, hypertension, and hyperlipidemia.
Conclusions
The study presented herein analyzes GE Centricity EMR data in order to determine the effects of BMI and obesity, key risk factors, and components of metabolic syndrome, on the prevalence of 3 chronic diseases that have both high prevalence and high disease burdens: type II diabetes mellitus, hyperlipidemia, and hypertension. While BMI and obesity are often underreported in surveys and administrative databases, EMR databases such as the GE Centricity EMR database may be good sources of relevant data and may allow tracking such variables over time, and facilitate longitudinal analyses of increasing disease prevalence and progression.
This study demonstrates strong positive associations of age, sex, race/ethnicity, BMI, and comorbidities with diagnosed prevalence of the 3 conditions. Results include uniform positive associations between both age and BMI and the prevalence of each condition; uniformly greater prevalence for males than for females; and associations with race/ethnicity, with African Americans having the highest prevalence of diagnosed type II diabetes and hypertension and whites having the highest prevalence of diagnosed hypertension. Despite the differences in disease prevalence by sex and by racial/ethnic group, the positive associations between BMI and disease prevalence are consistent for males and females and across all racial/ethnic groups. Finally, the logistic regression analyses control for possible confounding and demonstrate the unique effects of each of the factors—age, sex, racial/ethnic group, obesity, and comorbidities—in explaining and predicting the prevalence of the 3 chronic conditions. All of these results contribute to the growing literature regarding the adverse effects of obesity and demonstrate the value of EMR databases for studying and documenting such effects.
Footnotes
Author Disclosure Statement
Dr. Haas is employed by Ethicon Endo-Surgery, Inc. Ethicon Endo-Surgery, Inc., funded this study, and it contracted with all other authors listed on this article. Drs Crawford, Cote, Couto, Daskiran, Gunnarsson, Haas, Nigam, and Schuette, and Ms. Haas disclosed no other financial ties or conflicts of interest.
a
Centricity Physician Office is a registered trademark of GE Medical Systems Information Technologies.