




Abstract
The objective of this study was to examine the impact of reducing the prescription co-pay for diabetes medications on pharmacy utilization, medication adherence, medical utilization, and expenditures. The co-pay reduction involved placing all diabetic drugs and testing supplies on the lowest co-pay tier for one employer group. The sample comprised members with diabetes who were both continuously enrolled in the 12-month pre period and the 2 years following co-pay reduction. Measured outcomes included diabetic prescription utilization, medication adherence, medical utilization, and expenditures. Generalized estimating equations for repeated measures were used to estimate differences between the pre period and years 1 and 2, while adjusting for age, sex, and comorbidity risk.
Diabetic prescription utilization and medication adherence increased by approximately 3.0% in year 1 and dropped in year 2. The increases were primarily in brand name diabetes medications, which increased by approximately 5%, while generic use decreased in both years. Decreases in emergency room visits and hospitalizations were also observed in both years, followed by a decrease in health care expenditures in year 2. Adherent members experienced greater decreases in emergency room visits following the co-pay reduction compared to nonadherent members.
After the implementation of a co-pay reduction, a modest increase in adherence and use of diabetes medications was observed. There were some compensatory cost savings for the employer from lower medical expenditures in year 1. In addition to financial strategies, additional strategies to reinforce medication adherence are needed to gain and sustain more meaningful increases in prescription utilization. (Population Health Management 2010;13:235–245)
Introduction
However, the negative impact of these more traditional cost-sharing benefit designs on medication adherence and the resulting additional use of health care resources have been well documented. 16 Past research has found that increasing cost sharing for patients, for vulnerable populations such as the elderly and low-income individuals as well as insured patients, can result in a reduction in adherence to essential medications and increased utilization of medical services such as emergency room visits and hospitalizations. 17, 18 Notable among this body of research was the work of RAND researchers, who found that for every 10% increase in cost sharing, prescription drug use decreases by 2%–6%, depending on the class of drug and the condition of the patient. 19 For some chronic conditions, such as congestive heart failure, lipid disorders, diabetes, and schizophrenia, increased cost sharing was associated with increased use of other health care services, offsetting any potential cost savings to payers.
Given the overwhelming evidence about the negative impact of traditional cost sharing for prescription medications, payers have turned to newer value-based benefit designs (VBBD) that are designed to encourage the use of medically necessary medications and services, while discouraging the use of nonessential medications and services. Academics have defined VBBD as a “clinically sensitive approach that is explicitly designed to mitigate the adverse health consequences of high out-of-pocket expenditures.” 20 In their simplest form, the newer VBBDs provide graduated co-pays or coinsurance structures: low or no co-pays/coinsurance for essential medications and necessary medical services and high co-pays or no coverage for nonessential or less essential medications and unnecessary medical services. 21
Although theoretically VBBDs should apply to all medical services, much of the initial focus has been on newer pharmacy benefit designs that either reduce or eliminate co-pays for chronic disease states. 22 Despite the complexities of a pharmacy benefit, prescription-based VBBDs are popular because employers believe adherence to medications is integral for the management of chronic disease states. 23 In addition, the ease of implementing a pharmacy benefit change is also appealing to an employer. In its simplest form, employers merely have to change a pharmacy benefit rider to reflect the lower co-pays and communicate this change to employees.
Interest in VBBDs has mostly grown from the efforts of a few implementations dating back to the 1990s. The City of Asheville in North Carolina launched one of these earlier forms of prescription-based VBBD in 1997. 24 In this program, co-pays for diabetes medications and supplies were waived for employees of the City of Asheville if they agreed to be counseled by trained pharmacists every 1–3 months on diet, exercise, medication use, and blood sugar testing, and to undergo foot and eye exams. While prescription costs increased for the employer, mean medical costs per member decreased between $2705 and $6502 in all 5 years after program implementation, and 53%–75% of employees had improved HbA1C levels. Unlike many VBBDs, however, the Asheville program also included other aspects of pharmaceutical care, including counseling by pharmacists and case management.
The efforts of Pitney Bowes, a national employer that provides various postal services, to implement VBBDs have been widely publicized. Between 2002 and 2004, Pitney Bowes lowered prescription co-pays for brand-name medications used to treat diabetes, asthma, and hypertension to a co-insurance rate of 10%, compared to prior rates of 30% and 50%. 9 For diabetics, nonadherence to insulin therapy decreased by two thirds, diabetic testing strip use increased by 27%, and the use of fixed combination oral diabetic drugs increased by 13%. 25
More recently, evaluations of a pharmacy-based VBBD have shown modest results. Chernew and colleagues found that when co-pays for generic, preferred, and nonpreferred medications were decreased by 50%, a 3.8%–6.3% increase in medication adherence for all drug classes examined was observed above and beyond active disease management, which was constant.26
Recently, Nair and colleagues examined the impact of reduced co-pays on adherence in a 3-tier pharmacy benefit plan for diabetes medications and testing supplies.27 Mean adherence levels increased by 7%–8% in year 1 and fell slightly in year 2 compared with the baseline period. The researchers also found that those patients who became adherent with their diabetes medications after the introduction of the reduced co-pays had consistently lower health care costs and utilization compared to those patients who continued to be nonadherent. Although the study was one of the first to evaluate the comprehensive impact of VBBDs, the small sample size warranted further research to validate whether improving adherence through lower co-pays has a measurable impact on use of medical services and expenditures for payers. The goal of the present study was to continue this validation with a different employer and a larger sample size.
We examined the impact of reducing prescription co-pays for employees and dependents with diabetes in a larger employer group over a 2-year period, including the impact of any resulting increased adherence on the use of medical services and expenditures.
Methods
The study design involved a pre-post comparison of a cohort of continuously enrolled members at baseline and post-period years 1 and 2.
Demographic description of the employer group
The program was administered by a state employer with 27,881 employees who are enrolled with health benefits. The mean age was 45.9 years, with an average length of service of 9.4 years and a mean annual salary of $48,932. Among the employees, 23.9% were 35–45 years old, 34.2% were 45–55 years old, and 20.3% were 55–65 years old. The population was 49.1% female; 63.9% were white, 17.4% were Hispanic, and 4.1% were African American.
The primary departments represented in the state-based employer group were the Department of Corrections (18.4% of all employees), Department of Human Services (16.4%), Department of Transportation (9.3%), and various higher education institutions (29% of all employees). With regard to employment types, 26.2% of all employees were in professional services; 19.8% were in law enforcement and protective services; 16.3% were in labor, trades, and crafts; 14.3% were in administrative support; 10.9% were in health care services; 6.0% were in physical sciences and engineering; and 5.6% were in financial services.
Medical and prescription plan features
The employer offered 4 health plans in 2005, all of which were preferred provider organization (PPO) plans. One of the plans was not offered in the follow-up years of the study and therefore was excluded from the analyses. The primary features of these plans, named PPO A, B, and C, are shown in Table 1. In year 1 of the follow-up period, PPO A and B had no changes in the medical benefit features, while PPO C had a decrease in the annual deductible from $3500 for individuals to $3300 and from $7000 for families to $5000 per year. In year 2, only members in PPO C experienced a decrease in the annual deductible for individuals, from $3300 to $3000 per year. Pharmacy benefits were similar for all plans and consisted of an annual $100 deductible per individual followed by co-pays of $10 for tier 1 or generics, $25 for tier 2 or preferred brands, and $50 for tier 3 nonpreferred brands for a 30-day retail supply. Prescription co-pays for mail-order drugs were $20 for tier 1 drugs for a 90-day mail-order supply, $50 for tier 2 drugs, and $100 for tier 3 drugs following a $100 per individual deductible. For PPO B and C plans, self-administered injectables dispensed through a pharmacy were available to individuals at a 30% co-pay, which could not exceed $250 for a 30-day supply or $500 for a 90-day supply. For injectables administered in a physician's office or outpatient facility, individuals had to pay 30% of the cost of the medication.
NA, not applicable; PPO, preferred provider organization.
Prescription-based VBBD
The program consisted of placing all diabetic drugs and testing supplies at tier 1 regardless of the brand or generic status, so that employees would have access to these drugs and testing supplies for a $10 retail co-pay or a $20 mail-order co-pay after an annual prescription deductible of $100. A letter was sent to all members with diabetes, who were identified based on either a prescription claim for a diabetic drug or a diagnosis code during the 1-year period before the start of the program, informing them of the reduced co-pays for brand-name diabetes medications or testing supplies. No further direct communication about the program was sent to eligible members following the initial letter. In addition, members had the option of participating in a diabetes disease management program offered by the health plan, which was in place before the introduction of the prescription-based VBBD. The program was briefly mentioned in an online newsletter for employees published by the Division of Human Resources, as well as in bulletins e-mailed to benefit administrators in each department. Neither of these communications was promotional in nature.
Sample selection
The sample consisted of members who were continuously enrolled with the health plan for all observation periods. There were 3 observation periods: pre period (or baseline period): July 1, 2005–June 30, 2006; post period year 1: July 1, 2006–June 30, 2007 (referred to as “year 1”); post period year 2: July 1, 2007–June 30, 2008 (referred to as “year 2”). Once the continuous enrollment criteria were met, individuals with diabetes were identified in the pre period as those who met 1 of the following conditions28: 2 outpatient visits with diabetes as the primary or secondary International Classification of Diseases, Ninth Revision (ICD-9) code of 250.xx; 1 emergency room visit with diabetes as the primary or secondary ICD-9 code; 1 hospitalization with diabetes as the primary or secondary ICD-9 code; or 2 consecutive prescriptions for any diabetes medications. Individuals were excluded who had gestational diabetes, polycystic ovarian syndrome, or chronic renal failure and who were on dialysis, as well as transplant patients and individuals with high-cost conditions (eg, cancer, HIV) in the baseline period.
Pharmacy-based outcome measures
The pharmacy-based measures consisted of annual or annualized measurements per member per year (PMPY) in the 3 observation periods for: (a) the number of diabetes medications (any, brand, generic, mail order); (b) the number of diabetic testing supplies; and (c) medication adherence, defined as the proportion of days covered (PDC) for diabetes medications (any diabetes medications, oral diabetes medications, or insulin use). Individuals were classified as adherent if the PDC was ≥80% for any diabetes medications, including oral diabetes medications and insulin.29 Individuals were classified as adherent or nonadherent in each period separately. Three sets of percent differences were determined for all measures: differences between year 1 and the pre period, year 2 and the pre period, and year 2 and year 1, respectively.
Medical utilization–based measures
The medical utilization outcome measures consisted of the number of diabetes-related emergency room visits, hospitalizations, outpatient visits, and laboratory or diagnostic visits in all 3 observation periods, and the same measures for adherent and nonadherent members in each time period. Percent differences between year 1 and the pre period, year 2 and the pre period, and year 2 and year 1 were determined for all medical utilization measures for which a diagnosis for diabetes was present in the primary or secondary ICD-9 diagnosis position code. In addition, percent differences in medical utilization of diabetic services between adherent and nonadherent individuals in each time period (baseline, year 1, and year 2) were also examined.
Expenditure-based outcome measures
Expenditure-based measures consisted of payer pharmacy expenditures for diabetes medications and testing supplies, member out-of-pocket costs for diabetes medications and testing supplies (to include co-pays and deductibles), and payer expenditures for diabetic medical services for adherent individuals (those with PDC ≥80% for any diabetes medication) and nonadherent individuals (those with PDC <80% for any diabetes medication) in each time period separately. In addition, percent differences in all expenditure measures between adherent and nonadherent individuals in each time period (baseline, year 1, and year 2) were also examined.
Covariates
Differences in the outcome measures between each of the observation periods were adjusted for age, sex, and the RxHCC (prescription drug hierarchical condition category) risk score.30 The RxHCC risk score was developed by the Centers for Medicare and Medicaid Services using a prescription drug risk-adjustment model to tailor payments to reflect the health status of plan enrollees. The model uses particular demographic characteristics and claims information to predict the following year's expected costs for an individual. The RxHCC diagnostic classification groups more than 15,000 ICD-9 diagnosis codes into 197 conditions categories, known as RxCCs, which are then classified into disease groups.
Statistical analysis
Generalized estimating equations for repeated measures were used to estimate pairwise differences between the observation periods.31 For count-based variables with <25% of values equal to zero, we assumed a Poisson distribution (numbers of prescriptions, emergency room visits, and hospitalizations). For count-based variables with >25% zero values, we used a zero-inflated Poisson model (brand or generic prescription use, testing supply use, and mail-order prescription use). Medication adherence was coded as a binary variable (ie, “yes” for adherence of ≥80% and “no” otherwise) and this outcome measure was evaluated using logistic regression. Expenditure data were evaluated by computing the period-to-period differences within a subject; the differences were approximately normally distributed. All analysis was conducted using SAS version 9.1.3 (SAS Institute Inc., Cary NC).
Results
A total of 589 individuals were continuously enrolled for all 3 years and met all the inclusion criteria. Their mean age was 51 years, 43.3% were female, and the mean risk score was 1.09 (Table 2). Sixty-one percent of the sample had hypertension, 45% had dyslipidemia, and 17% had depression.
Pharmacy utilization
Pharmacy utilization of diabetic drugs and testing supplies is shown in Table 3. There was a mean increase of 3% for any diabetic prescription in year 1 and a decrease of −1.2% in year 2 compared to the pre period. There was a 5% increase in brand-name diabetic prescription use in year 1 and a 4.4% increase in year 2, compared to the pre period. Generic prescription use saw a decrease of 4.2% in year 1 and 11.5% in year 2, compared to the pre period. Mail-order prescriptions saw increases of 19.3% in year 1 and 17.4% in year 2, compared to the pre period. There was a decrease in the mean number of diabetic testing supplies in year 1 (-0.8%) and year 2 (-6.6%), compared to the pre period. A majority of these differences between years 1 and 2, compared to the pre period, were statistically significant (P < 0.05).
Estimates based on a Poisson model.
Estimates based on a zero-inflated Poisson model.
P < 0.05.
Medication adherence
Mean levels of medication adherence increased by 3.2% for any diabetes medication in year 1, but only by 1.3% in year 2 compared to the pre period (Table 4). Mean levels of medication adherence increased from 70.82% to 73.11% in year 1 and dropped to 71.76% in year 2 for all diabetes medications. Similar trends in mean levels of medication adherence were seen for users of oral diabetes medications. However, medication adherence was lower for insulin users in all years (56.1% in the preperiod, 61.4% in year 1, and 62.5% in year 2) compared to those taking oral medications. Insulin users saw an increase of 9.4% in year 1 and a slight increase in year 2 compared to year 1. Only differences in insulin adherence were statistically significant.
Includes members who took prescriptions in all 3 observation periods.
Includes members whose adherence levels were ≥80% in each observation period.
P < 0.01.
The percent of adherent individuals increased slightly for any diabetes medications in year 1 compared to the pre period (48.9% vs. 52.4%). Similar increases were observed for members using oral diabetes medications (51.2% vs. 53.7%), although the increase was greater for insulin users (22% vs. 30.3%). However, with the exception of insulin, the number of adherent individuals decreased in year 2 compared to the pre period (any diabetes medication was 48.9% vs. 46.6% and oral diabetes medication 51.2% vs. 46.1%). Only a few of the differences in years 1 and 2 compared to the pre period were statistically significant.
Medical utilization
Mean diabetes-related medical utilization (Table 5) showed a decrease in diabetes-specific office visits in year 1 (-11.9%) and year 2 (-5.0%), compared to the pre period. Emergency room visits saw a statistically significant decrease in year 1 (-30.7%) and year 2 (-36.0%), compared to the pre period. Hospitalizations showed decreases of −52.8% and −12.8%, respectively, in years 1 and 2, compared to the pre period. Laboratory and diagnostic visits showed a slight increase of 2.1% in year 1 and a decrease of −1.4% in year 2, compared to the pre period. Only comparisons for office visits between the pre period and year 1 and comparisons for emergency room visits between the pre period and year 1 and the pre period and year 2 were statistically significant.
Estimates based on a Poisson model.
Estimates based on a zero-inflated Poisson model.
P < 0.01; Estimates are rounded up to 2 decimal points. Percent differences reflect differences that include all the decimal values.
Expenditures
There was a 61% increase in payer paid pharmacy expenditures PMPY for diabetes medications in year 1 and an 85% increase in year 2 compared to the pre period (Table 6). These increases were highest for brand-name diabetes medication use (66% in year 1 and 87% in year 2, compared to the pre period). There was no increase in expenditures for generic diabetes medications in year 1, compared to the pre period, but a 62% increase in year 2, compared to the pre period, despite a decrease in the use of generic prescriptions in both years. A majority of differences for pharmacy expenditures in years 1 and 2, compared to the pre period, were statistically significant.
Statistical tests are based on the analysis of differences between periods for each subject. *P < 0.05. **Expenditures rounded up to the nearest integer.
Member out-of-pocket expenditures (including deductible amounts) decreased by 36% for all diabetes medications in year 1 and by 35% in year 2, compared to the pre-period. Large decreases were seen in member out-of-pocket costs for brand-name diabetes medications (45% in year 1 and year 2, compared to the pre period). There was a 3% increase in member out-of-pocket expenditures for generic medications in year 1 and a 7% increase in year 2, compared to the pre period. A majority of differences for member out-of-pocket expenditures in years 1 and 2, compared to the pre period were statistically significant.
With regard to medical utilization, there was an 18% increase in total medical expenditures for diabetic services in year 1 and an 18% decrease in year 2, compared to the pre period, both of which were statistically significant.
Adherent versus nonadherent individuals
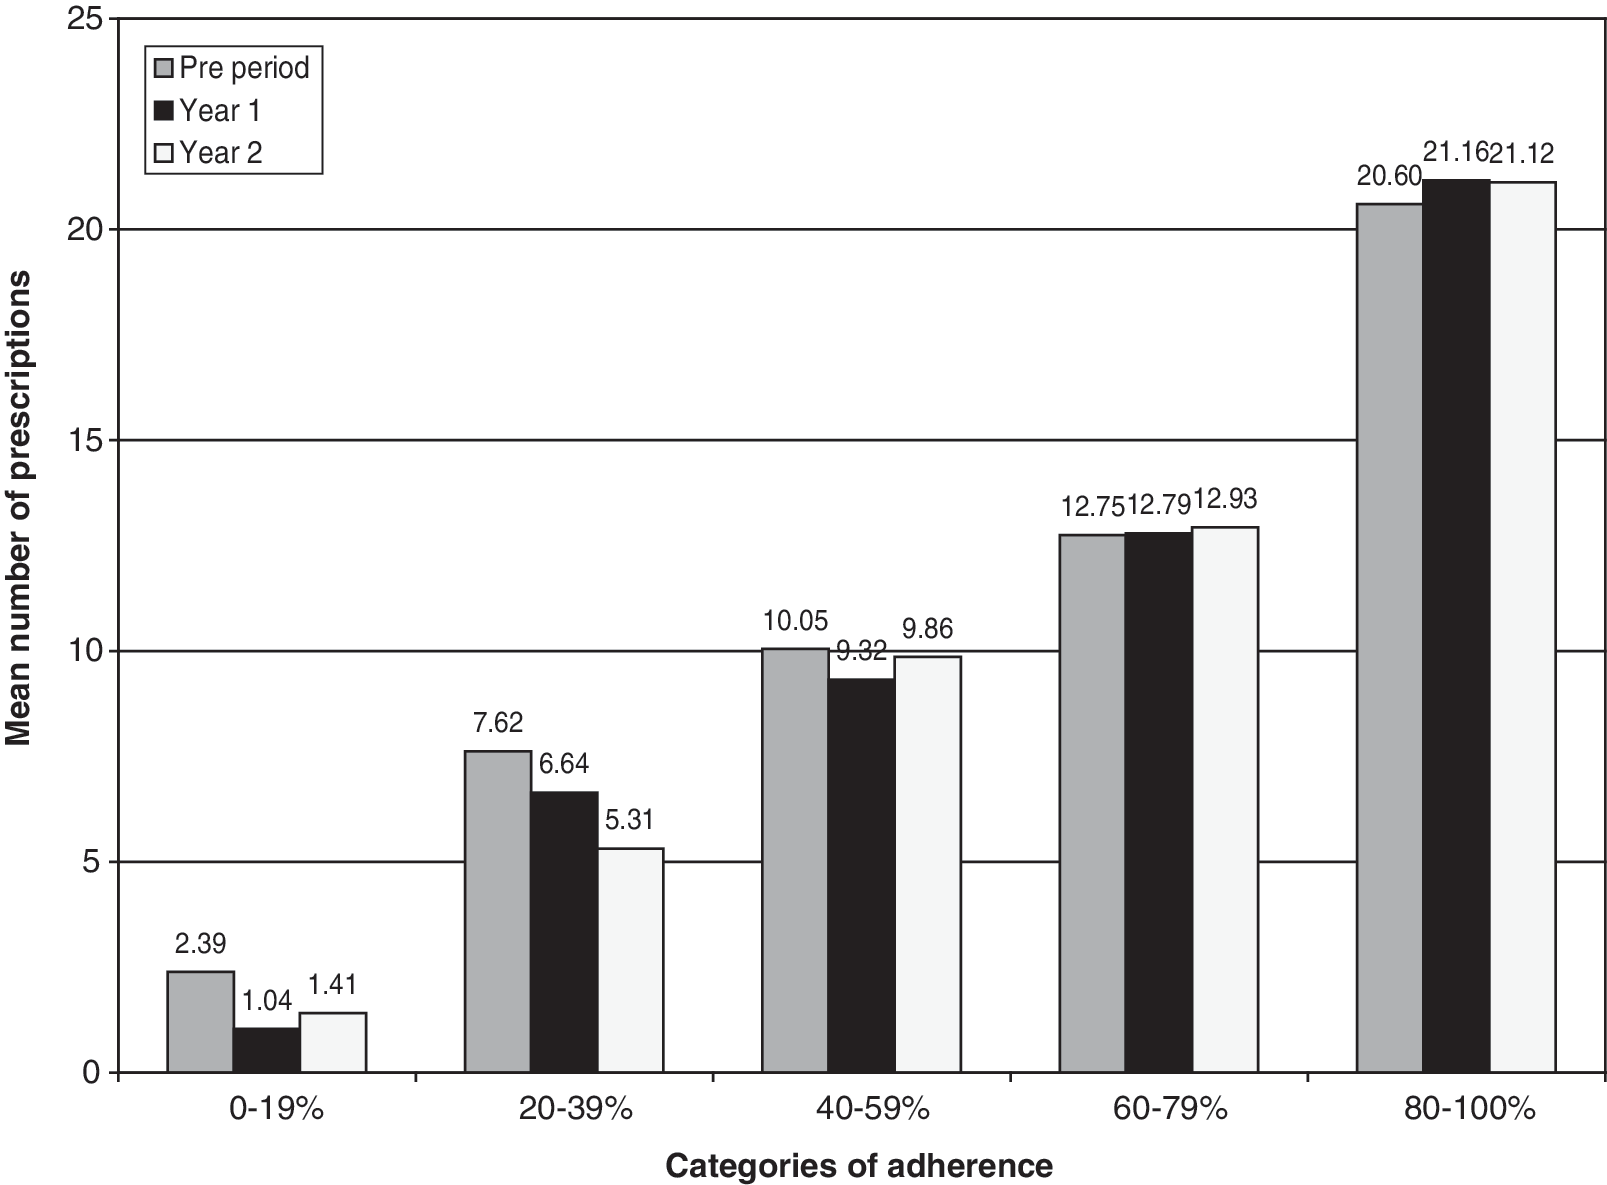
Figure 1 shows the mean number of prescriptions between adherent and nonadherent individuals for various categories of adherence ranging from 0% to 100%. In the lower categories of adherence that included members whose PDC ranges were 0%–19%, 20%–39%, and 40%–59%, the number of prescriptions decreased in years 1 and 2 compared to the pre period. Members whose adherence levels were between 60% and 79% and between 80% and 100% had a higher number of prescriptions in years 1 and 2, compared to the pre period.
The difference in medical utilization for office visits, emergency room visits, hospitalizations, and laboratory services between adherent and nonadherent individuals in all 3 time periods PMPY is shown in Table 7. Office visits and laboratory services were generally higher for adherent members compared to nonadherent members, with the differences being greater in year 1 (7.0%) and year 2 (15.5%), compared to the pre period (0.4%). Laboratory use showed little difference in the pre period (-0.5%), but was higher by 10.5% in year 1 and 26.08% in year 2 for adherent members, compared to nonadherent members. Emergency room visits were lower for adherent members, compared to nonadherent members in all 3 years, with the differences being greater in year 1 (-30.7%) and year 2 (-36.70), compared to the pre period (-26.20%). Hospitalizations showed mixed results. They were lower by −72.8% in the pre period for adherent members, compared to nonadherent members, but higher by 21.1% in year 1 and lower by −29.60% in year 2. Only differences between adherent and nonadherent members in year 2 were statistically significant.
P < 0.05; PMPY, per member per year.
Table 8 shows the difference in payer pharmacy expenditures, member out-of-pocket expenditures for medications, and disease-specific medical expenditures between adherent and nonadherent individuals in all 3 time periods. Payer pharmacy expenditures services were higher for adherent members, compared to nonadherent members in all 3 years, with the differences being greater in the pre period (55.57%) and lower in year 1 (47.65%) and year 2 (51.36%). Out-of-pocket expenditures for adherent members were higher in all 3 periods, compared to the nonadherent members, with increases of 49.88% in the pre period, 49.82% in year 1, and 52.31% in year 2. Medical expenditures were lower for adherent members in all 3 periods, compared to nonadherent members, with the greatest decreases in the pre period (-78.69%) and year 1 (-45.58%). A majority of these differences between adherent and nonadherent members for various expenditures were statistically significant.
P < 0.05; PMPY, per member per year.
Discussion
Our study expanded the examination of a prescription-based VBBD design for a more comprehensive set of outcomes than previously included. The present study was based on 1 employer group and a sample of employees with diabetes continuously enrolled for 3 years with reduced co-pays for diabetes medications and testing supplies. Our data revealed the following key findings.
There were moderate increases in medication utilization after the implementation of the program. The increase in adherence levels was modest (less than 5%) following the reduction in co-pays for oral diabetic drugs but higher for insulin users (9.4%) in year 1.
We offer several explanations for this finding. First, the modest increase we observed in overall adherence levels for all diabetes medications could be due to the high (71%) baseline levels of adherence for this population, which could reduce the impact of lowering the co-pays. In other words, the population already exhibited higher adherence levels at baseline and the additional impact of lower co-pays may not have been able to increase adherence any further. Second, the moderate increases in adherence could be related to the modest reduction in out-of-pocket costs that members observed for their diabetes medications. On average, members saw a 35% reduction in out-of-pocket costs for their diabetes medications, which is lower than what has been observed in similar programs. In other diabetes-related VBBD programs (eg, the MHealthy program for diabetics at the University of Michigan, the Diabetes Ten City Challenge, the Pitney Bowes model) members had either zero co-pays for their diabetes medications32, 33 or faced a 50% reduction in out-of-pocket costs.25,32 The average co-pay reduction for this population may not have been large enough to inspire more significant changes in adherence and overall utilization of diabetes medications. Third, the high comorbidity burden of the study population (60% with hypertension, 45% with dyslipidemia, and 17% with depression) may also be a confounding factor in the results we observed. The complexity of a prescription regimen for members with diabetes who have multiple comorbidities may partially explain why our study population may have been reluctant to increase their uptake of diabetes medications, despite the financial incentives that were offered. The presence of additional medications and only a 35% reduction in out-of-pocket costs may not have been sufficient to encourage greater diabetes medication use. Finally, our study population was predominantly male (57%) and it is well documented that males with diabetes and other comorbidities are likely to be less adherent to their medications compared to females.34
We also observed that the impact of the co-pay reduction appears to be more pronounced for patients whose adherence levels were over 60% at baseline than for patients who had a lower level of adherence at baseline (PDC <60%). Mail order use also appeared to be substantially impacted, with an approximately 20% increase in utilization, by reducing the co-pays in years 1 and 2 compared to the pre period. Members with diabetes appear to respond better to the reduction in co-pays for a 90-day supply compared to a 30-day supply.
The increase in prescription utilization and adherence observed in year 1 of the co-pay reduction program decreased or reverted to baseline levels in year 2, raising questions about the long-term sustainability of lowering co-pays as an effective method to improve adherence rates. However, despite these modest increases, total health care costs decreased by −18% in year 2. Whether these decreases in total health care costs can be attributed to lower utilization of medical services as a result of the co-pay reduction is unclear at this time. It is also possible that regression to the mean effects may offer an explanation of why we observed a decrease in utilization, adherence, and total health care costs in year 2 of the post period, compared to year 1. We discuss the potential impact of this effect in greater detail in the limitations section.
The use of brand-name diabetes medications increased following the reduction in co-pays, while generic use was reduced. Out-of-pocket costs for brand-name diabetes medications were reduced by −45% for patients. The increase in brand-name medication use in both years 1 and 2 following the co-pay reduction may have been due to the transition by patients who were treated with generics despite their unmet needs. It may also have been spurred in part by the introduction of newer agents/formulation to the market in 2006 and 2007. Another reason for the increases in brand-name medication use may be due to a “moral hazard,” as patients did not bear the same financial burden for brand-name medications as before the co-pay reduction.35 However, determining which of these was the driving force behind the increased brand name use was beyond the scope of the current study.
Although adherent members had approximately 50% higher prescription use as a result of a 100%–125% decrease in member out-of-pocket expenditures, they had 30%–36% fewer emergency room visits and higher rates of office visits and laboratory services compared to nonadherent members in both follow-up time periods, although the differences were not statistically significant in year 1. Adherent members experienced notably lower medical expenditures in the pre period and year 1. Our findings corroborate previous research that showed that adherent individuals are less expensive for payers and that VBBDs aimed at increasing the number of adherent individuals will decrease total health care expenditures for payers.36 However, it is possible that the differences we observed in medical utilization between adherent and nonadherent individuals may be a result of inherent differences between adherent and nonadherent members rather than the result of a prescription co-pay reduction. In other words, adherent individuals are more likely to manage their diabetes better than nonadherent individuals, and thereby incur fewer medical services and health care expenditures than nonadherent individuals. These differences may exist irrespective of the presence of a lower co-pay for diabetes medications.
What lessons were learned from this endeavor? First, there were modest increases in adherence after the simple co-pay reduction. However, the observed impact was not sustainable in the long term. It is important to note that the prescription-based VBBD design we measured was a “no frills” approach, with the primary change to diabetes management being the co-pay reduction for tier 2 and tier 3 diabetes medications. The program was communicated to the members via a 1-time mailing only. Additional value-based efforts to reinforce the impact of financial incentives with behavior modification methods and integration with disease management programs are likely needed to yield a more meaningful and sustainable change in adherence.
Second, payers need to be encouraged to think differently about return on investment for a prescription-based VBBD. Payers may expect to offset the increased pharmacy costs incurred as a result of lower co-pays with savings on medical costs. Our findings show that individuals who are adherent with their diabetes medications had fewer emergency room visits, consumed 50% more diabetes medications, and used more office visits and laboratory/diagnostic services after a co-pay reduction was introduced. Therefore, payers must be encouraged to think of return on investment in alternative terms (eg, fewer sick days taken by employees and improved work efficiency) and to find ways to encourage members to improve their adherence to chronic medications. By getting more members to achieve adherence levels of ≥80%, payers may realize savings in medical costs over time.
Finally, the employer paid a substantial amount of money for this program. Its prescription costs increased by 62% in year 1 and by 108% in year 2 compared to the pre period. While a −18% reduction in medical costs for diabetic services was observed in year 2, it was not enough to offset the increased pharmacy costs borne by the payer and cannot be definitely attributed to the reduction in prescription co-pays. Because the baseline adherence for diabetes medications for this population was high, it is possible that a more targeted approach may provide a better return-on-investment for payers. This can be further supported by the fact that the patients with a lower level of adherence were less likely to be impacted by the program. Focusing a co-pay reduction on high-risk diabetics or those with multiple comorbid conditions may prove to be a greater incentive for these members, thereby increasing the impact of this type of VBBD.
Limitations
Our study had several limitations. First, there was no control group. This would have allowed us to differentiate the effects of the co-pay reduction from any underlying trends in prescription use and medication utilization. We tried to identify a comparison group from the health plan's other employer groups that had a similar 3-tier pharmacy benefit, type of industry, age, sex, and risk score distribution. However, these efforts did not yield an appropriate comparison group.
Second, related to our inability to find a control group, pre-post designs can be affected by regression to the mean, which impacts the validity of results. Regression to the mean refers to the phenomenon in which, without the influence of an intervention (ie, the co-pay reductions), diabetic members with high costs and utilization in the baseline year will tend to use fewer services and thereby have lower expenditures in the following year (ie, year 1 of post period).37 The converse may also occur when members with diabetes who use fewer services in the baseline year may use more services and incur greater costs in year 1 of the post period. In both instances, costs and use of services could be moving closer to the mean. The use of a control group avoids this phenomenon as two similar groups chosen at the same baseline should have similar outcomes because they are expected to “regress” in a similar fashion. In pre-post designs, choosing a longer baseline period (ie, 2 years or more) could mitigate these effects to some extent. A longer time period allows the natural movement of individuals across the range of measurement for each outcome measure, allowing a greater probability of reaching the mean prior to the start of the post period. Our study design used only 1 year for the baseline period and, therefore, it is possible that some of the results we observed, in particular the reduction in utilization, adherence, and total health care costs in year 2, may be influenced by regression to the mean.
Our results showed a larger increase in adherence for insulin users (9.4%) compared to those members who take oral diabetes medications. However, our measure of adherence for insulin use may not be the most reflective of its actual use. Insulin is dispensed as individual vials or as pens with multiple doses. The dosing of insulin (from once a day up to 4 times a day) can vary for each individual. Because dosing information is not present in pharmacy claims data, our measure of the length of time a member had insulin may not accurately reflect “adherence” with insulin therapy per se. Therefore, the results we observed for insulin users should be interpreted with caution.
Despite the availability of diabetic testing supplies at lower co-pays, our results showed a decrease in the use of these agents in both years 1 and 2. The mean number of testing supplies was less than 2.0 in all time periods, which could indicate that members were not buying their testing supplies through their pharmacy benefit insurance but rather from other sources. We could not confirm these behaviors and hence were not able to accurately measure the impact of reducing co-pays on the use of diabetic testing supplies.
A few external factors may have influenced our results. The presence of a disease management program for these members and the $4 prescription programs initiated by Walmart began in September 200638 and may have impacted the adherence levels we observed in this population, as the program included many generic oral diabetes medications. We did not have data on whether members in our sample chose to purchase diabetes medications directly from Walmart or other pharmacies for $4 rather than through their health plan, thereby resulting in lower observed adherence levels in the health plan data used for this study. We also did not have information about how many members in our study sample chose to participate in the disease management program provided by the employer. The presence of both these programs may have influenced our results. As the popularity of the $4 prescription programs continues, the impact of this source of prescription medications must be considered when making any assessments of a prescription-based VBBD.
We observed small sample sizes for the utilization of emergency room visits and hospitalizations, which are not common medical events (ie, most members do not experience such events). Therefore, changes in emergency room visits and hospitalizations should be interpreted with caution as the mean number of annual visits per member was small (<0.1) in all years.
We were not able to compare changes in diabetes prescription use by tier status in the pharmacy claims. The identifiers for tier status (tiers 1–3) were not available in the claims, and cross-references using the formulary and brand/generic indicator was not conclusive. Thus, we were unable to examine whether members purchased more expensive brand-name medications that were placed in the highest tier (ie, tier 3) before the co-pay reduction was introduced, which could imply the possibility of moral hazard behavior after the program was implemented. Similarly, as 30% of our sample had diagnosis codes for both Type 1 and Type 2 diabetes, the resulting sample sizes after all inclusion criteria were met did not permit a comparison of these two forms of diabetes.
Finally, the ultimate impact of a prescription-based VBBD for diabetes is on clinical outcomes. Although we were not able to collect data on clinical markers such as HbA1c levels, examining these outcomes for improvements in mean levels of HbA1c markers and the number of individuals whose HbA1c levels improved after the co-pay reductions for medications could provide greater evidence of the positive impact of a VBBD.
Conclusions
Implementing reduced co-pays for diabetes medications resulted in modest increases in prescription utilization and medication adherence. The use of brand-name medications increased, while generic use decreased after the introduction of the program. Despite these modest changes in pharmacy utilization, decreases in high-cost medical services such as emergency room visits and hospitalizations were observed. Members who were adherent with their diabetes medications had fewer emergency room visits, consumed 50% more diabetes medications, and used more office visits and laboratory/diagnostic services after the co-pay reduction was introduced. Payers may see more gains in long-term medical savings by supplementing financial incentives with additional behavior modification methods to see a greater and more sustainable impact on medication adherence.
Footnotes
Author Disclosure Statement
Drs. Nair, Miller, Park, Allen, Saseen, and Ms. Biddle have no institutional or commercial affiliations that might pose a conflict of interest.
This study was funded by a grant from GlaxoSmithKline.