




Abstract
The objective of this study was to determine the economic impact of the Hawaii Medical Service Association's health promotion/disease prevention program. A retrospective analysis of health risk, health claims, and cost was performed using a mixed model factorial design for the years 2002–2005 that compared program participants to nonparticipants. All analyses were adjusted for preexisting observed differences based on sex, age, baseline morbidity, and health care costs between participants and nonparticipants using propensity score matching method and/or covariates as appropriate.
After analyzing data from more than 166,000 HMSA members over a 4-year period, participants were found to incur consistently lower costs. Predictive modeling of upward cost trajectories relative to actual health care costs for participants and risk-matched nonparticipants indicated a savings of $350 per participant per year. Those who participated in additional wellness programming demonstrated additional cost savings. This study illustrates the economic value of a comprehensive health promotion program. (Population Health Management 2010;13:309–317)
Introduction
Although the impact of lifestyle on health risk, health status, and cost has been established, and it seems intuitive that a healthy modification of lifestyle should produce favorable outcomes in these very same domains, a strong body of supporting evidence has only recently begun to develop. Given the relative recent appreciation for behavior change in population health management, the evidence base that supports the economic viability of primary and secondary prevention efforts in population-based programs is highly variable. 7 –9
The question remains as to whether health promotion is a good investment and how best to operationalize the clinical, social, and economic value of population-based health management programs. Wolf et al 10 recently reported significant cost savings for a case management program in a high-risk, obese health plan population. Rasmussen 11 demonstrated the clinical value of health screenings and health consultations in a primary care setting that significantly modified risk without increasing direct costs. Most recently, Naydeck et al 8 evaluated an employee wellness program using a multivariate analytical approach to create a matched comparison group and to estimate health care expenditures. The approach thoughtfully accounted for other contributing factors in this nonrandomized design. Their findings conservatively estimated the return on investment (ROI) at $1.65:$1. A review of worksite promotion studies by Chapman 12 concluded that, despite this lack of standardization, the preponderance of the evidence supports an economic return associated with worksite health promotion programming, a conclusion most recently confirmed by an industry report by Watson Wyatt (2009/2010). 13
Despite recent developments in methodological guidelines, 14 there remains an ongoing need to further establish this evidence base with valid and defendable approaches to evaluation of specific case examples that both acknowledge the methodological challenges but also evaluate true effectiveness (as opposed to efficacy). Importantly, studies that attempt to demonstrate program value in real-world settings face unique methodological challenges, 15 –17 and the randomized clinical trial, regarded as the “gold standard” for establishing efficacy, can be impractical in terms of expense and the logistics required of randomization without contaminating the context in which most of these programs are implemented. 18,19 Because of the inherent threats to internal validity that cohort designs can pose (ie, selection bias), other methodologies such as statistical adjustments and sophisticated matching procedures to assure group equivalence may be the most likely course to build a strong evidence base.
In this study, we sought to evaluate the economic value of a health and wellness program delivered through a large health plan in terms of the economic (costs) and utilization (claims) benefits that might be realized for such a program and to assess how a cohort of participants differ in their characteristics and utilization outcomes relative to nonparticipants. Because this study constitutes a nonrandomized effectiveness (as opposed to efficacy) study, we attempted to equate the evaluated cohorts using propensity score estimators for matching and statistical adjustment where relevant.
Methods
The Program
The Hawaii Medical Service Association's (HMSA) HealthPass is a comprehensive health promotion and disease prevention program. HMSA is an independent licensee of the Blue Cross and Blue Shield Association, the largest single provider of health care coverage for the state of Hawaii. At the time of this study, HMSA offered a variety of programs, services, and support to improve the health and well-being of its members. The program began with a health risk assessment (HRA; HealthMedia, Succeed) that evaluated each member in terms of lifestyle, health habits, and health risks (the first 2 years of analysis here used a different HRA provided by Staywell, Inc.). Participants then received biometric screenings that included blood pressure, cholesterol (total cholesterol and high-density lipoprotein cholesterol), glucose, and body composition indices of height, weight, body mass index (BMI), waist circumference, and percentage of body fat. Other screenings may have been prescribed based on sex, age, and risk (eg, Pap smear, bone density, sigmoidoscopy). Each participant underwent a counseling session with a health care professional to review their biometric values, identify their particular risks, discuss wellness goals and lifestyle changes, and to develop a related action plan in order to provide relevant health education, make risk-based referrals to healthy lifestyle programs/health education classes, and recommend appropriate prevention exams. Counseling sessions were offered in several formats including individual, group, face-to-face, and telephonic. Finally, a suite of tailored, online wellness intervention programs that focus on weight management, nutrition management, smoking cessation, and stress management were available to participants. These online programs were only available to participants in the latter 2 years of this evaluation. Depending on the members' employer, they may also have received an incentive for their participation.
The Sample
This study evaluated a total sample of 384,801 HMSA enrollees, some of whom participated in the HealthPass wellness and disease prevention program during any 1 or more of the 4 years from 2002 to 2005. Selection criteria for the cost/claims data included having 4 complete years of claims data; having total health care costs of less than $100,000 in any 1 year; being enrolled in the health plan for at least 9 months in any given year; having single plan coverage; being a subscriber or spouse between the ages of 18–70 years; being a resident of the state of Hawaii but not living on Lanai, Molokai, or outside the State of Hawaii due to the limited access and availability of the program service; not being pregnant; having no skilled nursing facility claims; and being hospitalized <365 days in any 1 year. Members with conflicting dates of birth or sex in multiple data sets were excluded. A total of 166,210 (43% of all members) met the inclusion/exclusion criteria and were selected into the analysis. Table 1 displays yearly HealthPass participation rates relative to the total yearly samples of eligible members.
In 2004 the organization changed health risk assessments (HRAs). Differences in constructs and scales are noted where relevant. Information for 369 participants who took both HRAs overlapped in the 2004 data. These participants were counted only once using HRA #2 in subsequent analyses. Yearly HealthPass N represents the total and percentage of individuals who participated in all 4 years evaluated in this report.
Selection bias
Because there is an inherent self-selection bias in nonrandomized participation in wellness programs, interpretation of program outcomes relative to nonparticipants must account for this bias. In this study, participants and nonparticipants differed significantly in sex, age, baseline morbidity, and baseline costs (P < 0.01). These variables were employed as matching variables and/or covariates, where indicated, to better equate groups and account for self-selection bias through statistical adjustment. Specifically, in the following analyses that revealed the program economic values (see Table 5, Fig. 1), nonparticipants were matched to participants on these variables using the propensity score matching method, followed by chi-square and t tests that assured that there were no significant differences in these characteristics of participants and matched nonparticipants. The propensity score matching method is a statistical matching method that is widely used in observational studies. It generates the predicted probability that an individual receives the treatment of interest from 1 or many confounding variables. For each participant, the procedure seeks a nonparticipant who has the same or nearly the same estimated probability of inclusion in the treatment in order to minimize the distance between matched cases on those confounding variables. 20 –23

Measures
HealthPass participants were required to complete an HRA at program entry. Two different HRAs were used during the years of analysis covered here (the first employed during the first 2 years of analysis and the second during the last 2 years). Both assessment tools assessed self-reported health history, behavioral and biometric risks, and constructs related to behavioral change (eg, behavioral barriers, motivations, stage of change). Construct mapping was conducted to determine the comparability of the two instruments and the analyses that follow indicate those compatibilities and gaps between instruments.
Biometric measures, included cholesterol and related subfractions, fasting blood glucose, systolic and diastolic blood pressure, BMI, waist circumference, and percent body fat, were collected by various members of the HealthPass staff using standard clinical protocols.
All subjects (participants and nonparticipants) were also assessed using the Johns Hopkins Adjusted Clinical Groups (ACG) Case-Mix System. 24 The ACG system uses diagnostic information, disease patterns, age, and sex to quantify disease burden as a constellation of morbidities as opposed to individual diseases. The scale measures aggregate morbidity level on a range of 0–5 where a score of 0 indicates no illness or morbidity and a score of 5 indicates severe illness burden or maximum level of illness.
Claims and cost measures consisted of total health care expenditures; expenditures were categorized by inpatient costs, number of admissions, length of stay per admission, outpatient cost/claims, medical services and pharmacy. Data are expressed in unadjusted dollars and utilization counts.
Sample demographics and descriptive statistics
The demographic characteristics of 2005 participants and nonparticipants are displayed in Table 2. Women were more likely to participate in HealthPass, χ2(1) = 500.69, P < 0.0001. Nonparticipants were significantly younger than HealthPass participants in terms of the age distribution (χ2(5) = 210.211, P < 0.0001) and mean age (F(1,166208) = 83.89, P < 0.0001). This relationship was consistent in all years 2002–2005 (P < 0.0001). Over two thirds of the HealthPass participants self-identified themselves as Asian or Pacific Islander, and almost 60% were college graduates or higher. Data on ethnic identification and education were not available for nonparticipants.
Indicates significant difference between participants and nonparticipants, as tested by chi-square test for categorical variables and 1-way analysis of variance for continuous variables, P < 0.05.
Comorbidity scores
Table 3 presents Hopkins Morbidity ACGs 24 by age stratification and participation year, using a 2 (participation status) x 4 (year of analysis) x 5 (age stratification) analysis of covariance adjusted for sex. The morbidity scores were used as covariate adjustments in subsequent analyses where indicated. The findings indicated a main effect for participation, F(1,664799) = 176.90, P < 0.0001 (greater morbidity in participants), a main effect for age, F(4, 664799) = 4329.44, P < 0.0001 (greater morbidity in the older cohorts), a main effect for year, F(3, 664799) = 43.87, P < 0.0001 (increased morbidity over course of the years of analysis), and a participation status by age interaction, F(4, 664799) = 18.95, P < 0.001 (higher morbidity in the younger HealthPass cohort but no morbidity differences in the older cohorts based on participation status). Other interaction terms were nonsignificant (P > 0.05).
Morbidity score was adjusted for sex. The main effect for HealthPass participation status, age stratification, and year was significant. The interaction between participation status and age stratification was significant, as tested by general linear model, P < 0.001.
Results
Health Care Claims and Costs
The economic value of the HealthPass program was evaluated in terms of total annualized health care expenditures by year and cost by category including inpatient costs (total dollars paid for the facility portion of the claim and excluding professional services), outpatient costs (total dollars paid including outpatient surgeries, emergency room visits, mental health partial day services, diagnostic and treatment services), medical services (total dollars paid for all medical or professional services), and pharmacy (total dollars paid for all prescriptions). The actual cost data by year by participation is summarized in Table 4. Participants consistently had lower total health care expenditures, inpatient costs, and pharmacy costs than nonparticipants in all years, and higher medical services costs in 2002 and 2003 (P < 0.005). The outpatient costs in 4 years and medical services costs in 2004 and 2005 between the two groups were nonsignificant (P > 0.10).
Total health care costs include inpatient, outpatient, medical, and pharmacy costs.
indicates significant difference between HealthPass participants and nonparticipants, as tested by 1-way analysis of variance, P < 0.005.
The administrative costs for the HealthPass program included staff salaries, employee benefits, employer taxes, Hawaii general excise taxes, medical supplies, office supplies and printing, postage and freight, utilities and telephone, furniture and equipment expense, occupancy expenses, professional services, advertising and promotions, insurance, travel, depreciation and amortization, data processing and software purchases, and general administrative expenses (ie, human resources, legal, accounting, administrative services). Yearly program administrative costs per participant were $204 in 2002, $219 in 2003, $236 in 2004, and $214 in 2005.
Return on investment
Table 5 shows the health care cost for HealthPass participants relative to nonparticipants by participation year after accounting for HealthPass operational costs. In this table, nonparticipants were members who never took HealthPass in any of the 4 years while participants were members who started HealthPass in 2002, 2003, 2004, or 2005 respectively. Each year a subsample of nonparticipants was matched to participants on sex, age, morbidity score, and total health care costs in the preparticipation year(s), and no significant difference was found between participants and nonparticipants after matching (P > 0.05). These matching variables were also set as covariates in the cost comparisons to better reveal the impact of the program. Participants consistently and significantly had lower total health care costs for each year relative to nonparticipants (P < 0.0001). After subtracting the HealthPass program expenses from the actual health care expenditure savings, we estimated a net savings of $374, $34, $132, and $124 per participant per year yielding an estimated ROI of $2.83, $1.16, $1.56, and $1.58 for every dollar invested for the years of 2002–2005, respectively.
Health care costs include inpatient, outpatient, medical, and pharmacy costs. Data were derived from members with total health care costs >0. Participants and nonparticipants were matched on sex, age, morbidity, and total health care cost in the preparticipation year(s). Savings were adjusted for sex, age, morbidity, and total health care cost in the preparticipation year(s). HealthPass participants had significantly lower total health care costs than nonparticipants for all years, as tested by general linear model, P < 0.005.
To evaluate the association between HealthPass participation and health care costs, we analyzed the cost trajectories before and after participation for those individuals who did not initially use HealthPass in years 2002–2003, but became first-time participants in 2004 and continued their participation in 2005. This provided a 2-year run in period with which to establish cost trends. As previously described, in this analysis we used nonparticipants who never participated in HealthPass during 2002–2005 to generate a group that was matched 1-to-1 on sex, age, morbidity in 2002 and 2003, and total health care cost in 2002 and 2003 to compare with the participant group. The matching strategy yielded successful matches (ie, nonsignificant group differences for these variables). Table 6 presents a comparison of the two groups on baseline characteristics. Sex, age, and morbidity in 2002 and 2003 were also used as covariates in the model to make the two groups better equivalent.
The trajectory for participants depicted in Figure 1 is based on predictive modeling using a curvilinear fit (linear regression) for the years 2002–2004, and estimates total health care costs for 2005 (indicated by the dotted line) given the existing 3-year trend line, linear model, R 2 = 0.975, P = 0.101. The difference between this predicted estimate ($2616) and actual costs ($2266) of those entering the HealthPass program in 2004 was $350 per participant on average, and 1-sample t test (assuming equal variance) indicated the actual costs were significantly lower than the predicted costs, t(1226) =2.34, P = 0.019 (2-tailed test). Nonparticipant costs for those years are also included in Figure 1 as a point of further comparison. Note also that the actual cost trend line for nonparticipants continues to rise consistent with the established trend. The similar estimate procedure was conducted for nonparticipants using 2002–2004 data, linear model, R 2 = 0.925, P = 0.177. One-sample t test indicated that the actual costs ($2773) were nonsignificantly different from the predicted costs ($2643), t(1226) = −0.87, P = 0.384 (2-tailed test).
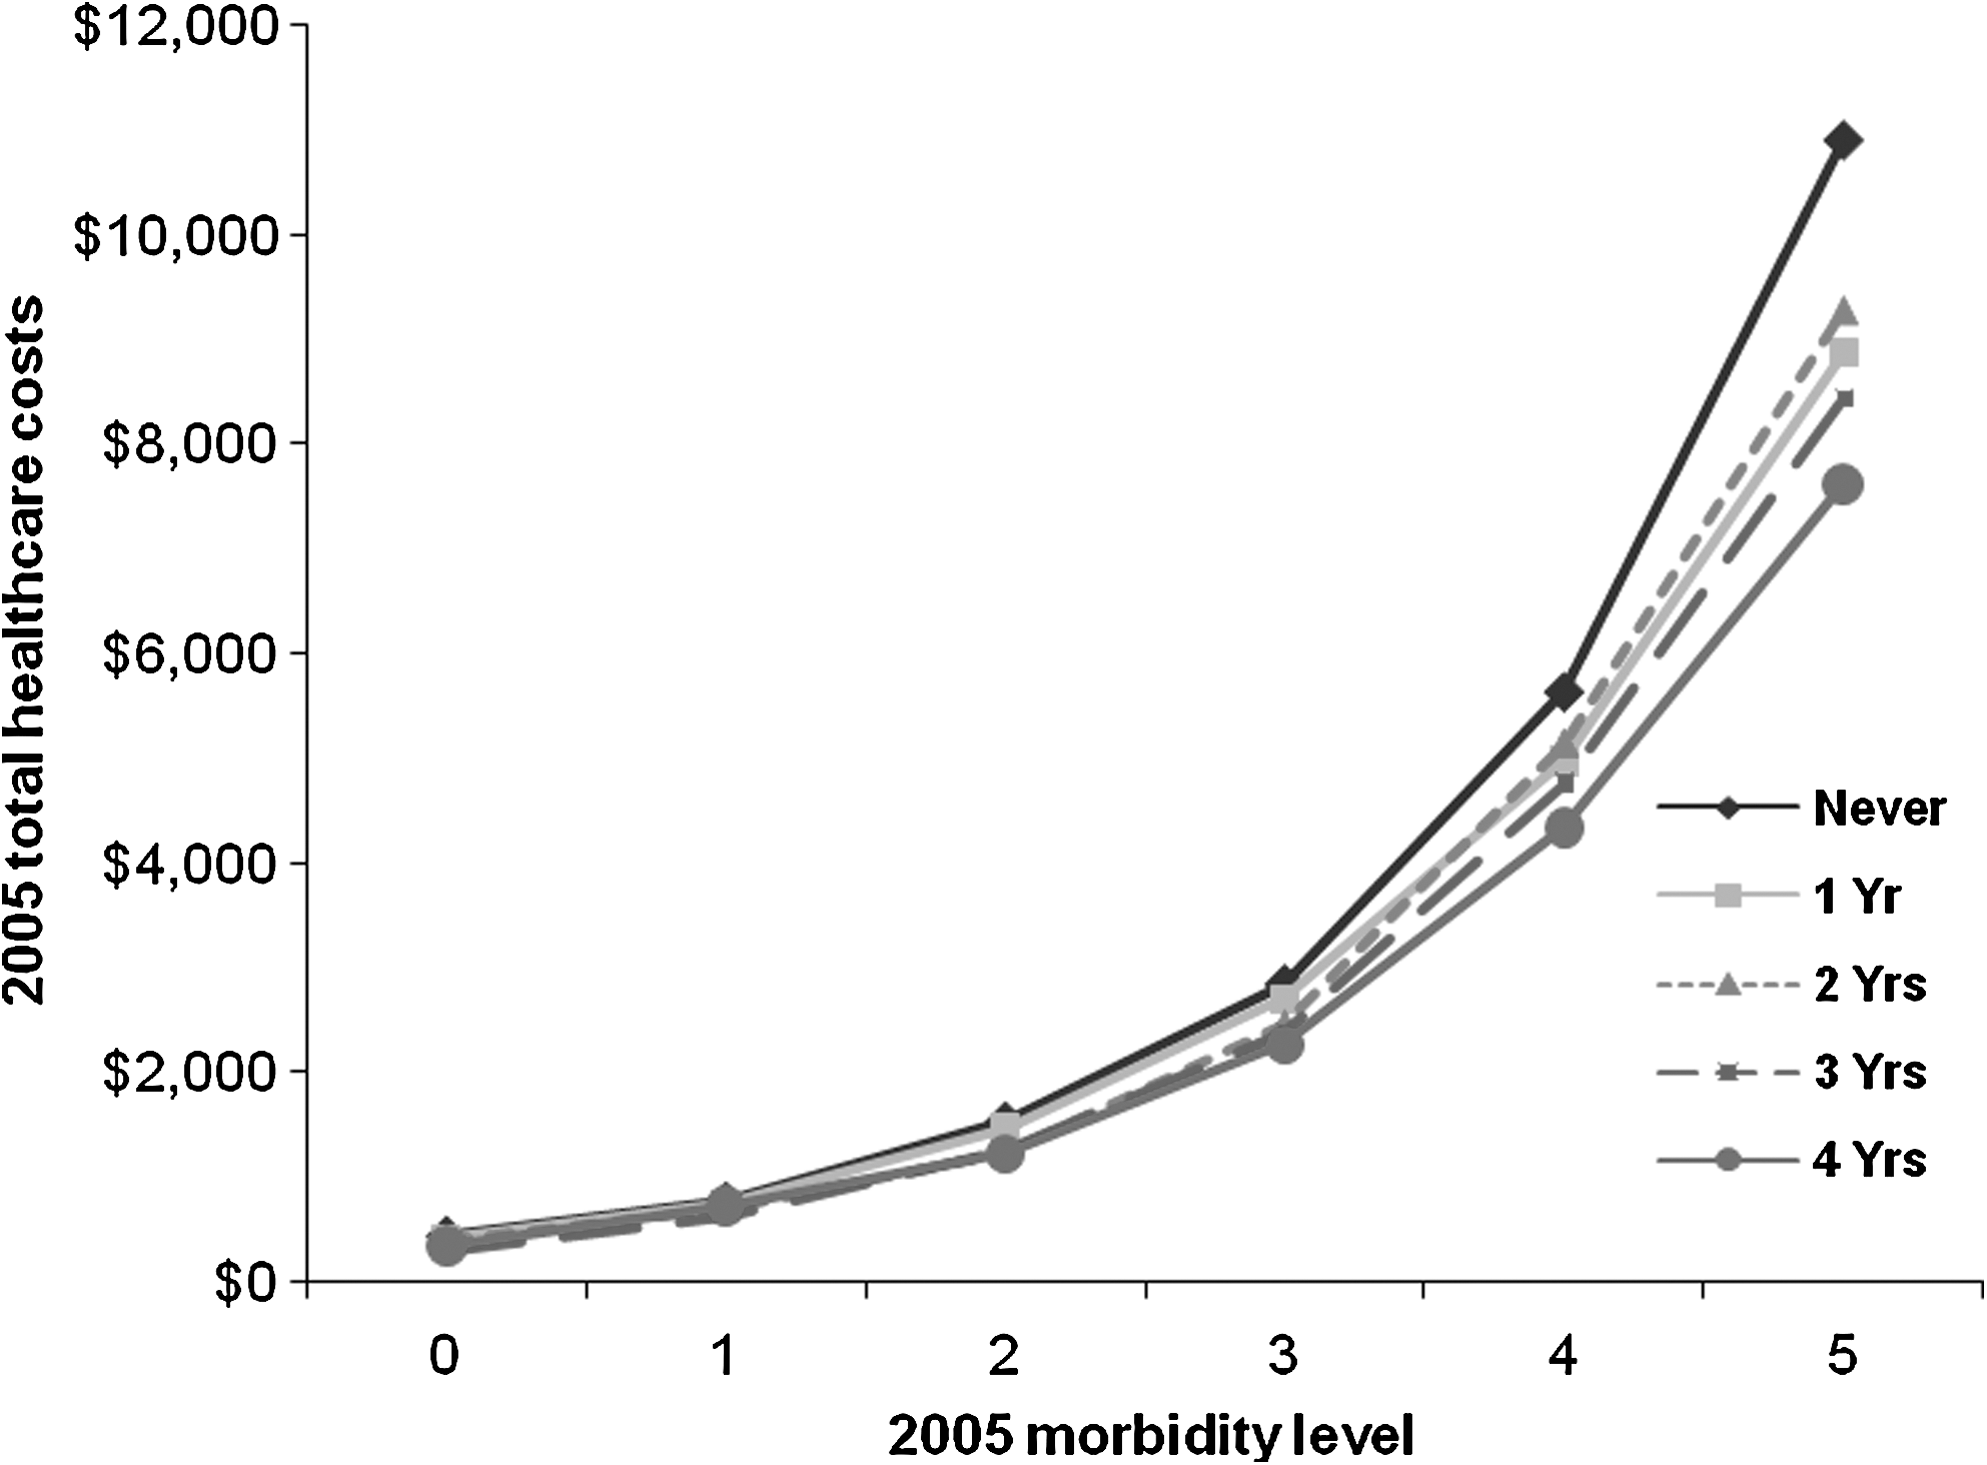
In order to determine if a relationship existed between cost and level of participation we compared the total 2005 health care expenditures on the full sample based on the consistency with which someone participated in HealthPass over the 4 years of data (ie, never, 1 year only, 2 years, 3 years, or 4 years). Figure 2 plots these costs by degree of participation. Figure 2 indicates a dose-response-like relationship of program participation to total expenditures (P < 0.0001). Figure 3 plots these costs against the morbidity values and indicates a significant main effect for morbidity (higher morbidity higher cost, F(5,150139) = 509.79, P < 0.0001) and a years of participation by morbidity interaction such that greater economic benefit was realized as morbidity increased (F(20,150139) = 6.48, P < 0.0001).

Health care utilization
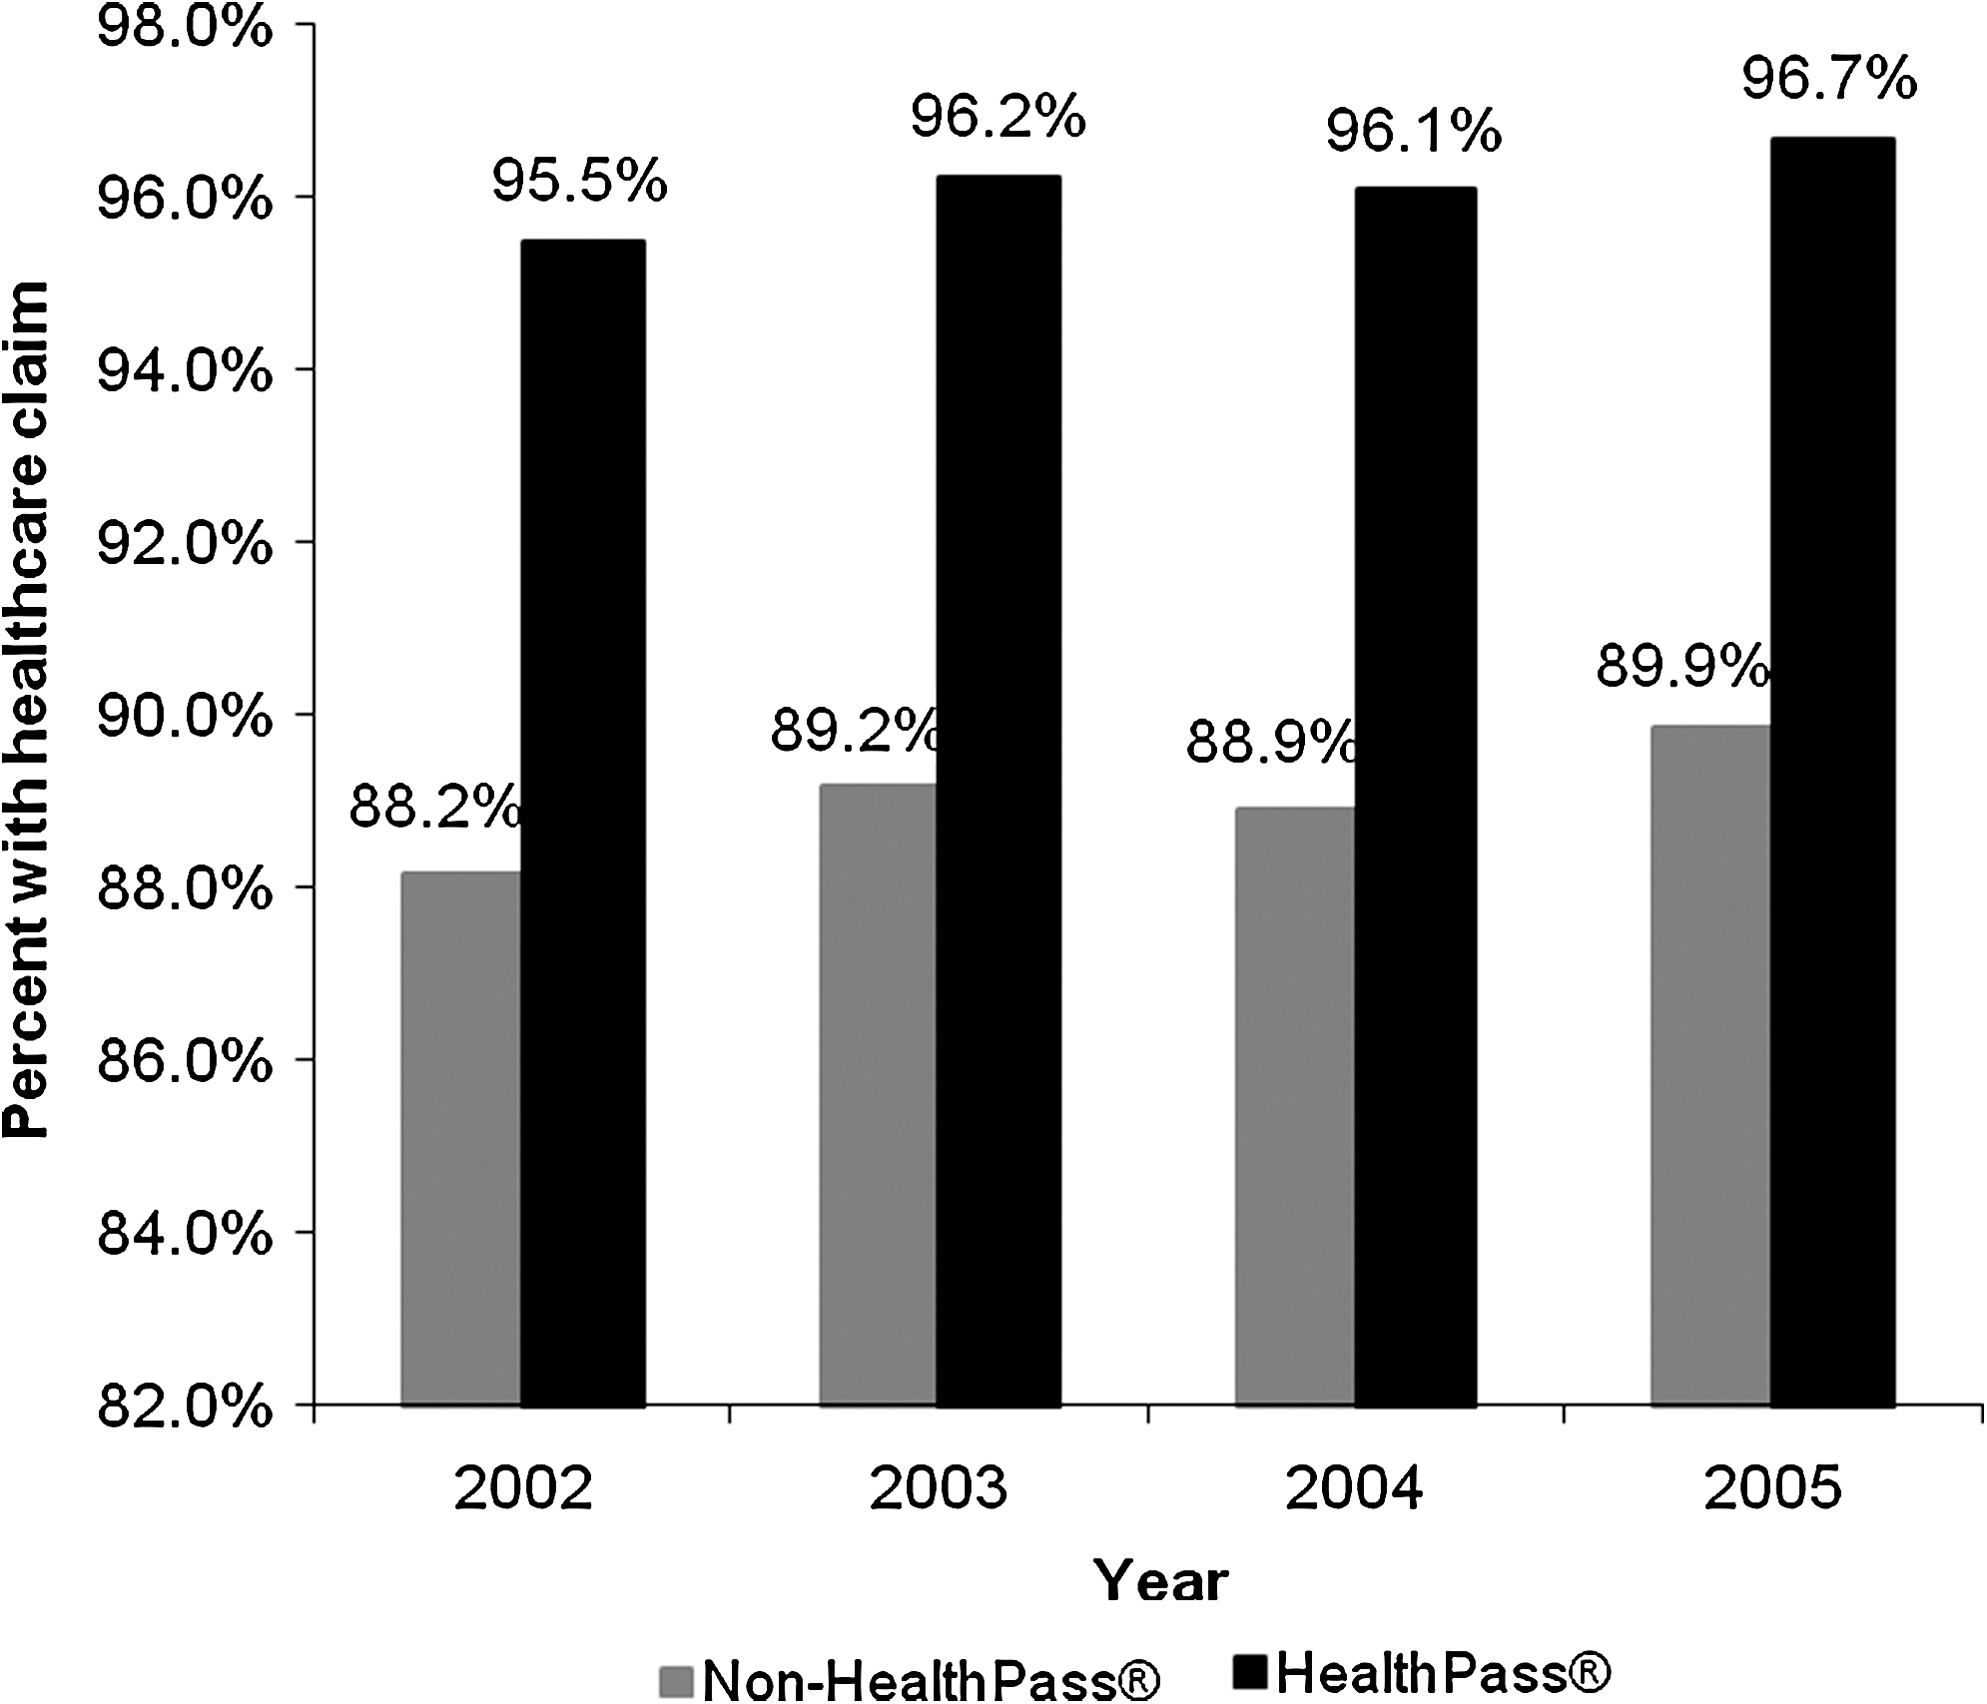
When defined as having made “at least one claim” during the calendar year, HealthPass participants were consistently more likely to have made a claim in any given year (Fig. 4, P < 0.0001 for all years tested by chi-square test). However, nonparticipants were significantly more likely to make a claim for the inpatient category (P < 0.0001 for all years), while participants were more likely to make a claim for medical services and pharmacy categories (P < 0.0001 for all years). The groups did not differ on outpatient claims (P > 0.30).
When examining the number of claims made, similar to the health care expenditures, the actual utilization data indicated that nonparticipants made more claims for inpatient and pharmacy services (P < 0.0001 for all years) compared to participants, who made more claims for medical services (P < 0.0001 for all years). The outpatient claims were nonsignificantly different between the two groups (P > 0.10 for all years). Additionally, participants and nonparticipants differed in their total inpatient days and average per hospitalization length of stay (LOS). HealthPass participants consistently had fewer annualized inpatient days and shorter LOS per admission on average relative to nonparticipants (P < 0.001 for all years). The actual utilization data per 1000 members is displayed in Table 7.
Total number of services include inpatient, outpatient, medical, and pharmacy services.
indicates significant difference between HealthPass participants and nonparticipants, as tested by 1-way analysis of variance, P < 0.05.
Finally, we examined the number of claims made after adjusting for sex, age, and baseline morbidity levels. On average, HealthPass participants made significantly fewer claims relative to nonparticipants for any given year (Fig. 5, P < 0.0001 for all years) and by cost category (P < 0.05 for all years, except for medical services in 2003, which is nonsignificant), as well as fewer total inpatient days and shorter average LOS per admission (P < 0.0001 for all years).

Discussion
There remains an ongoing need to demonstrate the economic value of primary and secondary prevention and the promotion of wellness in population health management. To that end, we retrospectively evaluated a large database of HMSA members over a 4-year period, some of whom participated in their HealthPass wellness and disease prevention program and others who did not. Our findings support the economic and utilization benefit of such programming for those who participated. Return on investment values ranged from 1.16 to 2.83 based on several sample selection criteria and statistical predictive methodology. These findings are noteworthy in several ways. First, those with the highest morbidity (and therefore need) were the most likely to participate year over year and, therefore, the findings cannot be attributed to a healthier participation cohort. Despite higher morbidity scores, program participants consistently had lower overall health care expenditures relative to nonparticipants. This relationship held most true for those at the highest end of the morbidity spectrum, suggesting that more than illness burden was contributing to cost and utilization patterns.
Second, using predictive modeling to evaluate the relationship of participation to costs, we developed a model based on a 2-year baseline health care cost “run in” to predict subsequent costs in the year following program participation. From the existing trend line, we compared the predicted expenditures to actual expenditures and found a $350 differential. This divergence from the existing trend line was not seen in the nonparticipants, whose health care costs continued on the predicted trajectory. Further, there was a significant relationship between duration of participation and cost such that the more consistent one's participation, the lower one's total adjusted health care costs.
Third, claims patterns differed for participants and nonparticipants in a manner that did not simply reflect a reduction in utilization by participants. Specifically, a greater proportion of program participants sought health care services, when defined as having made “a claim,” but service use (ie, claims) was typically less frequent on average and less costly. More specifically, the increase came in the category of “medical” services, possibly reflecting seeing the doctor regularly. Significantly lower utilization was found for “high end” services like inpatient, LOS per admission, and outpatient claims, suggesting perhaps less complicated presentations and courses when seeking these types of services. While no firm causal conclusions can be drawn from these findings, one speculative hypothesis might be “rightsizing” of utilization such that program participants appear to be making better and more appropriate use of health care resources.
As with all research, the study described here has some notable limitations. This study was a retrospective cohort analysis without the benefit of random assignment to the treatment/comparison groups. As such, selection bias is clearly a relevant threat to internal validity. Given the demonstrable cohort differences in demographics, health care costs, and morbidity, the groups clearly represent very different individuals in terms of their use of health care resources. Because participants and nonparticipants differed significantly on several key variables, we employed a propensity score matching procedure and covariate adjustments to minimize the preexisting observed differences. While this might be considered an imperfect solution relative to the internal validity achieved through randomization, it may represent the most practical solution when attempting to evaluate programming of this sort that has been implemented in a real-world context. Cohort differences may also have implications for future program development and recruitment. For instance, women were much more likely to participate in the program, and future program modifications might take such differences between the sexes into account when devising services, program features, incentives, or brand identity that appeals to both sexes' unique needs and interests.
Unfortunately, another related limitation is a relative paucity of data for the nonparticipants, which limits our ability to detail how the two samples may have differed in terms of ethnicity, education, and psychological, attitudinal, or behavioral constructs that may mediate utilization and claims patterns. Given the cohort differences noted, it is quite likely that there are a number of unidentified differences that are not represented here. Finally, at the time of this study we only had 1 year's worth of postparticipation follow-up claims data and, therefore, we were unable to determine the longer term economic benefit that accrued to participants relative to nonparticipants. Taken together, these data do not allow us to speculate about the reasons for decreasing “high end” costs in the participant group that are partially driving the cost offset and ROI even though such declines were not seen for the nonparticipants even after statistical adjustment for demographics, morbidity, and previous total cost values.
Several significant and related challenges face population health management. The first is the magnitude of the problem that health care faces in terms of costs and an aging population. The relevance of behavior in optimizing health and well-being coupled with the developmental implications of a growing aged population far exceeds the current resources and delivery models that are in place for both wellness and disease management. The second is defining a clear evaluation methodology with strong internal validity that can be adapted to the constraints of the complex context within which these interventions must ultimately be tested (eg, time-series methodology). The third challenge is one of scalability or the ability to provide high-quality services to address the magnitude of the problem (there is a paucity of available expertise and resources at all levels of care to meet the demand). Face-to-face and even telephonic services will always have a place in the continuum of care, but given the growing demands of an aging population, new and novel methods of service delivery that are economically feasible must be developed in order to address the needs of the most people.
High technology in the form of Web interventions, online health information, telemedicine, mobile messaging, and mobile telemetry, among others have been cited as potential solutions to these challenges. 25 They are occasionally offered as freestanding interventions, but are more often coupled with other services such as face-to-face counseling, home visits, and/or telephonic support, and are part of a continuum of care approach. Such technology, thoughtfully applied, can foster greater participation in self-care across the health spectrum as the industry moves toward a patient-centered model of care. What remains to be seen is how best to deliver content through these mediums in a manner that represents a true intervention, as opposed to simply providing via a novel medium the same old health information and content that has been demonstrated to be necessary, but insufficient to change health behavior.
Footnotes
Author Disclosure Statement
Hawaii Medical Services Association, a wholly-owned subsidiary of Hawaii Medical Services Association (HMSA). HMSA is an independent licensee of the Blue Cross Blue Shield Association. HealthMedia, Inc. is owned by Johnson & Johnson.
Ms. Ireland serves on the Customer Advisory Board of HealthMedia, Inc.
Drs. Schwartz, Strecher, and Juarez, and Ms. Ireland, Mr. Nakao, and Ms. Wang have no known affiliations that would pose a conflict of interest.