
Abstract
The objective of this study was to evaluate the improved effectiveness of a disease management treatment protocol incorporating comprehensive lipid profiling and targeted lipid care based on lipid profile findings in patients with ischemic heart disease (IHD) or congestive heart failure (CHF) enrolled in a managed care plan. This retrospective cohort study, conducted over a 2-year period, compared outcomes between patients with a standard lipid profile to those evaluated with a comprehensive lipid profile. All adult members of the WellMed Medical Management, Inc. managed care health plan diagnosed with IHD or CHF, and continuously enrolled between July 1, 2006 and June 30, 2008, were included in the study. Cases were defined as those who had at least 1 comprehensive lipid test (the VAP [vertical auto profile] ultracentrifuge test) during this period (n=1767); they were compared to those who had no lipid testing or traditional standard lipid testing only (controls, n=289). Univariate statistics were analyzed to describe the groups, and bivariate t tests or chi-squares examined differences between the 2 cohorts. Multivariate regression analyses were performed to control for potential confounders. The results show that the case group had lower total costs ($4852.62 vs. $7413.18; P=0.0255), fewer inpatient stays (13.1% vs. 18.3% of controls; P=0.0175) and emergency department visits (11.9% vs. 15.6% of controls; P=0.0832). Prescription use and frequency of lipid measurement suggested improved control resulting from a targeted approach to managing specific dyslipidemias. A treatment protocol incorporating a comprehensive lipid profile appears to improve care and reduce utilization and costs in a disease management program for cardiac patients. (Population Health Management 2012;15:46–51)
Introduction
Heart and vascular diseases can be prevented or mitigated by modifying risk factors that cause the disease. Aggressive lowering of cholesterol after a cardiac event produced a 31% reduction in the rates of fatal and nonfatal heart attack. It also has been shown to reduce all causes of death by 21%. The use of cholesterol-lowering drugs can reduce the likelihood of a fatal, heart-related event by 24%–42%. 4 Two major trials (FATS and HATS) demonstrated as much as a 90% level of risk reduction using combination therapy, including statins, colestipol, and/or niacin. 5,6
Lowering plasma cholesterol, particularly the low-density lipoprotein (LDL) component, has been the primary target for clinical intervention. Although elevated LDL is highly correlated with risk of heart disease, reducing LDL is often inadequate to reduce risk. The risk factors identified through the traditional lipid panel identify only 40% of premature cardiovascular disease 7 ; the Framingham study found that 80% of the study subjects who had a cardiac event had lipid levels similar to those who were event free. 8 Dyslipidemias leading to cardiovascular disease result from complex gene–environment interactions and their expression is highly individual.
The various subclasses of high-density lipoprotein (HDL) confer varying degrees of protection. HDL2 participates in reverse cholesterol transport and may provide a better measure of protection than total HDL. 9 Cholesterol subparticles and LDL pattern density and size values reveal, with greater accuracy, atherosclerotic changes earlier. Results from a large, population-based, prospective study suggest that more complete characterization of LDL particles may improve our ability to predict ischemic heart disease (IHD) events in men. 10 Routine lipid profiles do not detect many of these dyslipidemias. 7
Recognizing the limitations of traditional lipid testing, new comprehensive lipid profiling tests are being developed and evaluated. This study evaluated the improved effectiveness of disease management (DM) programs for managed care members with either IHD or congestive heart failure (CHF). The VAP (Vertical Auto Profile) test developed by Atherotech, Inc., was used in combination with an aggressive lipid-lowering protocol in the WellMed DM program. This test provides not only the standard profile results, but also LDL density (ie, Pattern A buoyant vs. Pattern B dense), intermediate-density lipoprotein, HDL subtypes, very-low-density lipoprotein density, and Lp(a). 9 The increased clinical detail provided by this test allows for more accurate assessment of clinical lipid risk and can result in more appropriately targeted treatment.
In cooperation with primary care physicians and their clinics, WellMed physicians used results from the VAP test with a treatment protocol using combination statin and Niaspan medication therapy, individually targeted for the specific dyslipidemias found. Based on LDL and HDL subclasses, the VAP test can target individuals with otherwise normal LDL levels for combination therapy. This could be of interest to managed care organizations that are looking to provide better care to their members with cardiovascular disease, while maintaining a cost-effective approach to treatment.
Specific aims
A retrospective cohort study was conducted to examine the impact of a DM program that incorporates a comprehensive lipid test on clinical and economic outcomes. We sought to explore the impact of incorporating the VAP test into the treatment protocol of a DM program on lipid control, service utilization for cardiovascular disease episodes, and direct medical costs. The study also sought to develop a multivariate model examining the extent to which treatment guided by periodic comprehensive lipid profiling leads to improved lipid control.
Methods
Design
The study cohort comprised 1767 members (cases) who had a diagnosis of cardiovascular disease and who met the following criteria: • Enrolled with WellMed continuously for at least the 2-year period commencing July 1, 2006 (and still living as of June 30, 2008) • Enrolled in WellMed cardiovascular DM for at least the 1-year period commencing July 1, 2007 • Had at least 1 VAP test in the 1-year period commencing July 1, 2007
All cases were patients of medical groups that were both owned and managed by WellMed. These WellMed-owned groups contracted to have their lipid testing done with the VAP test.
The comparison group (controls=289 members) were members of 3 large multisite medical groups that were managed, but not owned, by WellMed. These groups did their own contracting for lipid testing. The controls met the same diagnostic, enrollment, and DM inclusion criteria but did not have a VAP test during the study period.
Seven of 10 of the top diagnosis-related groups (DRGs) for cases and controls in the first year were the same for cases and controls. Examination of the Charlson comorbidity index showed the controls to have a higher risk score based on comobidities. The mean scores for the cases and controls were 2.0 and 2.5, respectively. Also, there was no statistically significant difference in the Risk-Adjusted Factor (RAF) scores (see following section) between cases and controls.
This study was determined to be exempt from review by the Thomas Jefferson University (TJU) Institutional Review Board.
Data collection
WellMed identified members who met the eligibility and exclusion criteria and provided the research team (TJU) with data files providing the following information: • Demographics: age, sex, member months enrolled with WellMed, and members' RAF severity scores. The RAF is a clinical severity score developed and used by the Centers for Medicare and Medicaid Services and is based on the principal inpatient diagnostic cost groups system.
10
• Program enrollment history: DM program type (IHD or CHF) and date of DM program enrollment • All hospitalizations: date of admission, length of stay, DRG, and total cost • All emergency department (ED) utilization: date of visit, diagnosis (International Classification of Diseases, Ninth Revision) and cost of visit • Overall Costs of Care: total claims (inpatient [IP], outpatient, pharmacy, and labs) paid by year (July 2006–June 2007 and July 2007–June 2008) • VAP test utilization (cases only): dates and findings for each test • Other lipid test (non-VAP) results (controls and some cases) • Pharmacy utilization: dates of prescriptions, with drug name, dosage, number of days supplied, amount paid, and whether prescription was new or a refill.
Statistical analyses
Cases and controls were compared on demographics (age, sex, RAF severity score, and member months with WellMed), costs (total, ED, and IP), utilization (occurrence and numbers of ED visits and IP stays, and IP length of stay) and LDL level. For costs and utilization, comparisons were made for the total time of the study (2 years) and for each year of the study. Comparisons were made on the types and counts of lipid-related prescription drugs, and compliance and persistence with prescription utilization (lipid treatment drugs). Unpaired t tests were used for comparisons of means, chi-square tests for counts, and paired t tests were used for changes in costs and utilization from the first to second study years.
Linear regression models, controlling for demographics, enrollment in the IHD and CHF DM programs, first LDL reading in the study time frame, Charlson comorbidity index, and RAF were used to examine the impact of status as a case or control on total claims costs, and total cardiac-related ER costs and IP costs. A linear regression model was used to examine the relationship between number of VAP tests received during the 2 years of the study and final LDL score. Logistic regression models for the occurrence of an ED visit or IP stay were developed using the same independent variables.
Results
Demographics
Cases were significantly older and averaged more member months in DM than controls. These differences, however, were small (1.8 years and 1.2 months, respectively). Differences in sex and in the RAF severity score were not significant (Table 1).
Chi-square, ** t test. CHF, congestive heart failure; IHD, ischemic heart disease; RAF, risk adjustment factor.
All cases and controls were in some DM program (both types). The majority of subjects were in one type of program (cases: 78%, controls: 68%); however, a higher percentage of controls were in 2 programs (cases: 22%, controls: 32%). Looking at specific programs, 90% of the cases and 80% of the controls were in the IHD program; 32% of cases and 45% of controls were in the CHF program.
Total claims costs
Total claims costs were higher for controls than cases in the first year of the study and this gap widened and became statistically significant in year 2 (Table 2). The regression model (Table 3) showed that age, claims costs in the first year, RAF score, and status as case or control were significantly associated with claims costs in the second year. This suggests that status as a case or control has an effect on cost in year 2 that is distinct from the other variables in the model. Cases had lower costs.
Chi-square, ** t test. ED, emergency department; IP, inpatient; LOS, length of stay.
CHF, congestive heart failure; ED, emergency department; IHD, ischemic heart disease; RAF, risk-adjusted factor.
Hospital utilization and cost
Most cases and controls (87% and 82%, respectively) had no hospital stays during this time frame. A significantly higher percentage of controls than cases had a hospital stay sometime during the 2 years of the study (Table 2). However, a logistic regression showed no association between status as a case or control and the occurrence of a hospital stay. Age, RAF score, enrollment in the IHD program, and enrollment in the CHF program were significantly associated with the outcome.
For the total time frame of the study and for each specific year, the control group had higher percentages of IP stays and longer stays than cases. Mean IP costs were higher for controls, but not significantly (Table 2). Using the same regression factors as for total claims costs, similar results were seen (Table 3).
ED utilization and cost
Cases and controls were compared on whether they made a visit to the ED in the 2-year period of the study. As with IP stays, a large majority of both groups (cases: 88%, controls: 84%) had no ED visits during this time frame. Although the percentages in Table 2 are suggestive of a higher occurrence of a visit among controls, this difference was not statistically significant at the P=0.05 level (P=0.08). In a logistic regression, controlling for the same variables as in the IP model, there is no association between status as a case or control and the occurrence of an ED visit. There were no significant differences between cases and controls in the distribution of counts of ED visits. Neither the comparison of unadjusted costs using the t test (Table 2) nor the linear regression model found a significant association between costs and status as a case or control (Table 3).
Pharmacy utilization
There was a significant difference between cases and controls in the distribution of prescription types for control of lipids. The percentage for each type of drug from the total number of prescriptions among cases and controls for the 2 years of the study was examined. Some of the major differences were for Advicor (11.9% of prescriptions for cases vs. 1.7% for controls), Gemfibrozil (2.6% vs. 6.0%), Lovastatin (19.5% vs. 25.9%), Niaspan (13.0% vs. 5.7%), and Simvastatin (12.4% vs. 21.2%).
There was a significant difference in the average number of drug types used by cases and controls for control of lipids (Table 4). Cases averaged more types used during the 2-year period of the study. Also, there was a significant difference in the distribution of the counts of drug types used between cases and controls. Over 66% of the cases, who were prescribed drugs for lipid control, used more than one type of drug during the 2 years of the study; less than half (49%) of the controls did so. Cases were more likely to have used drugs containing niacin (Niaspan or Advicor) than controls (36% versus 14%).
Chi-square, ** t test; MPR, medication possession ratio.
Prescription persistence and compliance with statin use
Persistence was defined as the duration of time from initiation to discontinuation of therapy. Discontinuation was marked as a gap of at least 10 days between the end of one prescription and the filling of the next. Compliance was measured 3 different ways: (1) total days covered during the 2-year study period, (2) proportion of days covered during the same time frame, and (3) the medication possession ratio (MPR). The MPR was similar to the proportion of days covered; however, the time frame extends from the fill date of the first prescription to the final day filled for the last prescription.
A significant difference was noted between cases and controls in persistence with therapy. Cases, on average, stayed on therapy longer before the first gap in therapy than controls. Similarly, cases did slightly, but nonsignificantly, better on all 3 compliance measures than the controls (Table 4).
Relationship between number of VAP tests and final LDL, HDL2, and HDL3 scores
Table 5 shows the changes in LDL and HDL from first recorded lipid panel to last panel for both cases and controls. Both cases and controls showed significant decreases in LDL levels from first to last test, while improvement (increased level) in total HDL was seen only among the cases. The results from the VAP test also allowed us to examine 2 components of total HDL: HDL2 and HDL3. Cases showed significant improvement for both.
HDL, high-density lipoprotein; LDL, low-density lipoprotein.
Regular monitoring with the VAP test should be related to better control of lipids. Linear regression models were developed to examine the association between the number of VAP tests administered during the 2 years of the study and the final recorded LDL, HDL2, and HDL3 scores for the cases. The model controlled for age, sex, RAF score, and enrollment in CHF or IHD DM; it showed a statistically significant inverse association between the test count and LDL level (more tests were associated with lower levels) and a significant direct association with HDL3 (more tests were associated with higher levels). The association with HDL2 was not significant (Table 5).
Effectiveness of VAP test at finding dyslipidemias
One of the advantages of the VAP test is its ability to provide measurement of multiple lipid components not available in the traditional lipid panels. Taking the 3 main measures from WellMed's treatment protocol (LDL level, LDL density pattern, and HDL2 level), we examined how often the VAP test detected dyslipidemias that would have been missed using traditional methods (Fig. 1). There were 5903 VAP tests administered to the cases during the 2 years of the study. The protocol first looks at LDL level, then LDL density pattern, and finally HDL2 level. Of the 5903 tests administered, 66% showed high (>70 mg/dl) levels of LDL and 34% showed levels at goal. Of the 2015 tests showing LDL levels <70 mg/dl at goal, 70% showed abnormal patterns (B or A/B small dense LDLc). Finally, of the 612 tests showing low LDL and pattern A (more buoyant, less dense), 59% showed low HDL2. Of the original 5903 tests, 5640 (95%) showed some form of dyslipidemia.
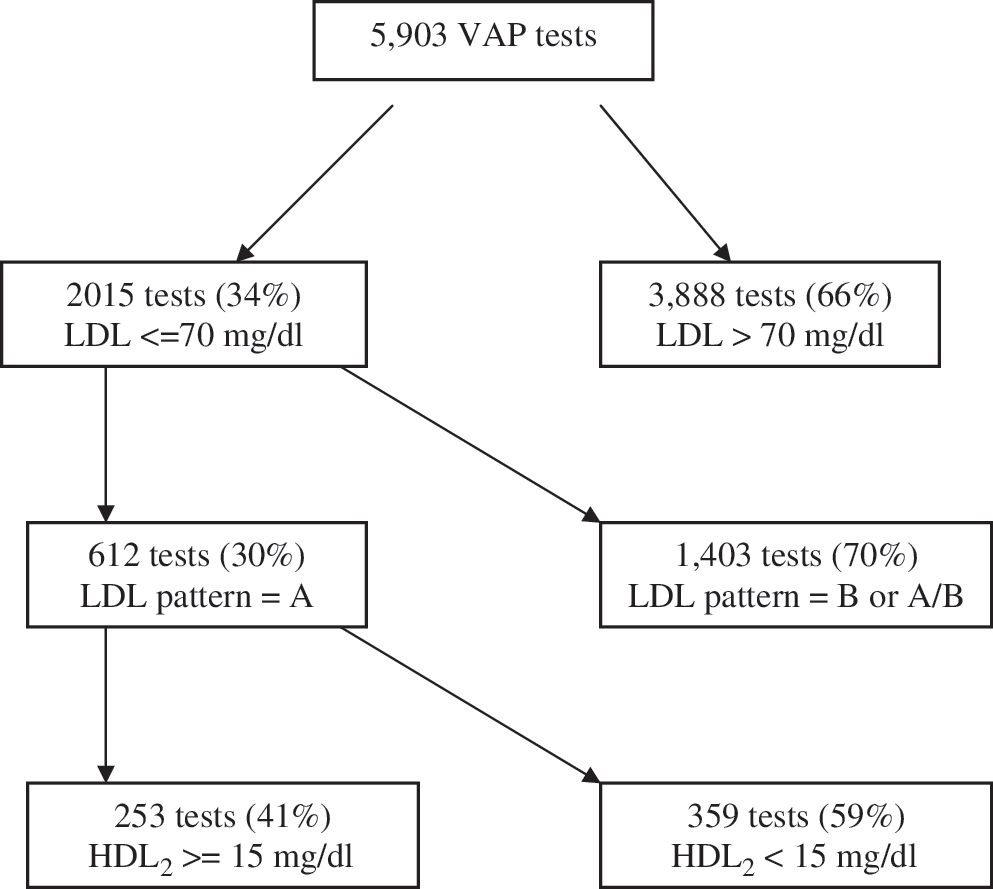
Dyslipidemias detected by the VAP test following the WellMed Protocol.
Discussion
Previous studies have shown that coordinated management and aggressive control of lipids after a cardiac event substantially reduce the occurrence of a second event, and targeting therapies toward specific subclasses of lipids can decrease the risk of an event. However, very little has been done to examine the impact of combining aggressive, targeted management with comprehensive lipid profiling in a DM setting. WellMed Medical Management, Inc. used this information to design a lipid treatment plan using a commercial lipid test (VAP) that WellMed felt identified higher residual lipid risk patients by looking at lipids beyond total LDL; specifically, small dense LDL class B/AB and HDL2. Interventions are targeted on the basis of subclass, level, and pattern of the lipids present. As part of this treatment for their very high-risk patients, if they had small dense LDLc or low HDL2, the clinician was encouraged to utilize add-on Niaspan or to change to fixed-dose Advicor. Initially, this level of management was provided to DM members from physician groups in WellMed's network; it was then offered to non-WellMed groups for whom WellMed performed DM. The existence of programs under WellMed management during the same time period, some of which used the VAP test/aggressive protocol and some which did not, provided a natural experiment to evaluate the effectiveness of the protocol.
Generally, the analyses show a positive impact of the WellMed approach, using care protocols guided by VAP test findings, on the outcomes of patients in IHD and CHF DM programs. Overall, claims costs were lower in the second year of the study for the cases; this result held after controlling for cost incurred in the first year, disease severity, and other potential confounders. The occurrence, number, and length of stay for IP events during the 2 years of the study also were lower for cases than controls. There were fewer ED visits for the case group, but the lack of statistical significance makes it difficult to draw any firm conclusions about this outcome.
The VAP test can identify multiple dyslipidemias, allowing a provider to prescribe therapy specific to the dyslipidemia present. The results, particularly those pertaining to prescription drug usage, suggest a more targeted and progressive therapeutic approach being used for the cases compared to the controls. Cases were more likely to have been prescribed multiple types of drugs and were more likely to be prescribed drugs containing niacin than controls. Along with the established benefit of increasing HDL levels, recent results from Taylor et al and the ARBITER 6-HALTS trial demonstrated that the use of extended-release niacin, when combined with a statin, significantly reduced plaque buildup in the carotid artery. 12 Brown et al also showed that LDL size and density were correlated with stenosis and that significant improvements were seen with the use of Simvastatin plus niacin. 13 Aggressive use of drugs containing niacin is an important part of WellMed's protocol for treating dyslipidemias. The VAP test enhances their providers' ability to identify the appropriate patients for this treatment.
Other results also point to improved management through the use of the VAP test: among cases, mean LDL, total HDL, HDL2, and HDL3 levels all improved significantly between the first and last panels taken during the 2 years of the study. On average, the final recorded LDL and HDL3 scores for the cases improved with increasing numbers of VAP tests given during the 2 years of the study. Using the VAP test allowed detection of more cases with dyslipidemia than would have been identified with the standard lipid panel. Increasing frequency of monitoring with the VAP test, combined with adjustments to therapy, led to lower LDL and higher HDL3 levels among these cases. HDL2 also improved but this improvement was not strongly associated with the number of VAP tests given. Figure 1 shows the large number of cases for whom therapy would not have been adjusted if the WellMed treatment protocol had not been used.
The results also suggest that significant savings can be achieved when a comprehensive lipid profile is used in conjunction with a treatment protocol based on the levels of the various lipid components. In year 2 of the study, the average claims costs were approximately $2500 higher for controls than for cases. The cost of the comprehensive lipid profile is comparable to standard profiles, takes 1 hour to run, and eliminates the need for 7 separate Current Procedural Terminology (CPT) procedures. Prospective studies should be performed to more definitively evaluate outcome benefits and costs using comprehensive lipid testing and management.
There were several limitations to this study. The study subjects were not randomized into study groups. Status was determined by the group practice/s to which they belonged. Although comparable on several factors, other differences resulting from practice and location could have influenced the results. The case and control groups may have comprised patients at different stages/progression of both their disease and treatment; however, the RAF scores were similar for both groups. The Charlson comorbidity index showed higher risk scores for controls; however, regression analyses, which included and controlled for this variable, did not change the outcomes presented. Both groups were continuously enrolled for the 2 years of the study and showed similar enrollment periods prior to the study. The control group was smaller than the case group, which could have reduced the possibility of detecting significant differences. Finally, because of the selection criterion of not having had a VAP test, there was limited data available on the controls' lipid levels. This constrained our ability to compare cases and controls on the lipid component-specific outcomes of lipid-modifying therapies.
Despite these limitations, this study suggests that significant improvements in cardiac management and clinical and economic outcomes were achieved by a care management protocol incorporating periodic comprehensive lipid profiling in a managed care population already enrolled in a cardiac DM program. Future studies using prospective and randomized controlled designs are needed to further assess the impact of comprehensive lipid profiling on care management, and to better understand which aspects of therapy appear to be most influenced by lipid findings and lead to the greatest improvement in health and economic outcomes.
Footnotes
Author Disclosure Statement
This research was supported by a grant from Atherotech, Inc. Other than the grant funds provided for the research, the authors have no other relationship to Atherotech, Inc. Although drafts of the manuscript were provided to Atherotech, Inc. for review, final decisions on inclusion or exclusion of material and the decisions on where or whether to publish were made solely by the authors.
The data for this study were collected and provided by WellMed Medical Management, Inc. Ms. Henry, and Drs. Piefer and Rapier are employees of WellMed Medical Management, Inc., which collected and supplied the data used for this investigation. Drs. McAna and Couto, and Mr. Goldfarb disclosed no current or foreseeable conflicts of interest other than their employment.