
Abstract
The objective of this study is to estimate a dose-response impact of disease management contacts on inpatient admissions. Multivariate regression analysis of panel data was used to test the hypothesis that increased disease management contacts lower the odds of an inpatient admission. Subjects were 40,452 members of Illinois' noninstitutionalized Medicaid-only aged, blind, or disabled population diagnosed with asthma, coronary artery disease, chronic obstructive pulmonary disease, diabetes, and/or heart failure. All members are also in the state's Illinois Health Connect program, a medical home strategy in place for most of the 2.4 million Illinois Medicaid beneficiaries. The statistical measure is the odds ratio, which is a measure of association between the monthly inpatient admission indicator and the number of contacts (doses) a member has had for each particular disease management intervention. Statistically significant contacts are between 8 and 12 for heart failure, between 4 and 12 contacts for diabetes, and between 8 and 13 contacts for asthma. Total inpatient savings during the study period is estimated to be $12.4 million. This study shows the dose-response pattern of inpatient utilization improvements through the number of disease management contacts. (Population Health Management 2012;15:352–357)
Introduction
The CCM paradigm's basis for health care delivery is the member–provider partnership involving care collaboration and self-management education and support. 2 CCM's focus on the individual's self-management of chronic conditions is the conceptual prototype for Illinois' disease management program, Your Healthcare Plus, offered through the Illinois Department of Healthcare and Family Services and implemented by McKesson Health Solutions.
Disease management emerged as an application of the CCM in the mid-1990s as a strategy to help mitigate health care costs, particularly the most costly health care services of inpatient care. 3,4 Although a consensus definition of disease management remains ambiguous, 3,5 disease management programs do share primary objectives to improve the quality, consistency, and comprehensiveness of cost-effective care for people with chronic illnesses. State Medicaid programs differ in selection of disease management participants and vary in organizational and structural designs. For instance, the diagnosis codes used to identify conditions, the conditions themselves, or benefit designs (eg, fee for service, managed care) can vary. The shared focus driving all disease management programs is improving the enrollee's ability to self-manage medical conditions as supported by their medical home. Thus, disease management programs endeavor to shore up enrollee health in conjunction with the medical home to avoid costly, unnecessary inpatient admissions by enrollees. Disease management program strategies include practices that focus on creating a positive sustainable change in the member's behavior via educational and internal motivations for goal achievement. 6 –8 Such practices would include the use of motivational interviewing techniques, establishing a trusting relationship, and goal setting that meets the member where they are and addresses their specific needs. Goals are established in collaboration with participants and their medical homes. The basic Medicaid benefit package and service access do not change.
Billions of dollars have been spent in the United States on the development and implementation of such programs. 9 As many as 38 states have engaged in disease management programs for a portion of their Medicaid population 10 and many self-insured employers have offered disease management programs to their employees. The results from many of these initiatives have been mixed. 11
Previous Medicaid evaluations include, but are not limited to, a review study that examined 44 disease management programs from a financial perspective 12 as well as studies specific to Medicaid programs in Florida, 13,14 Indiana, 15,16 New York City, 17 Tennessee, 18 and Washington. 19
Previous dose-response literature in the disease management domain includes a recent study that found that inpatient admissions decreased by the greatest extent after 4 or more contacts. 20 Others also found that the overall dosage summary measures were related to improved glycosylated hemoglobin and low-density lipoprotein testing. 21
Disease management programs have continued to evolve in response to the increasing chronic disease burden and rising health care costs of the American public. Many states have segmented or stratified their Medicaid population in an attempt to identify individuals who demonstrate the highest cost burdens, target members for disease management interventions, and find which strategies work in improving care and cost-effective, appropriate utilization.
The key contribution of this study is to estimate a dose-response effect for disease management contacts designed to improve care for individuals and improve cost-effective, appropriate utilization among Illinois' most chronically ill Medicaid-only recipients.
Methods
Subjects
On July 1, 2006, the state of Illinois implemented a disease management program, Your Healthcare Plus, which included the adult aged, blind, and disabled Medicaid-only population living in the community (noninstitutionalized). In fiscal year 2007, the entire Illinois aged, blind, and disabled population under disease management represented 4.41% of the state's Medicaid program enrollees, but accounted for more than 18% of the state's Medicaid expenditures as calculated by Illinois administrative claims analysis.
Subjects were selected from administrative claims diagnoses incurred between July 2005 and June 2009 for the aged, blind, and disabled Medicaid population living in noninstitutionalized settings. Additionally, subject inclusion criteria required having been diagnosed with 1 of the following 5 chronic conditions: asthma, coronary artery disease (CAD), chronic obstructive pulmonary disease (COPD), diabetes, and CHF. The total number of subjects eligible for the intervention was 40,452. Of that number, 15,231 received the intervention at some point between July 2006 and June 2009.
Intervention
In July 2006, registered nurses began calling identified members with 1 or more of the 5 chronic conditions (asthma, diabetes, CHF, CAD, or COPD) for program enrollment. Interventions focused on changing the individual's behavior. Members were not randomized into an intervention or control group. For those members who chose to enroll, Illinois Medicaid and McKesson Health Solutions customized a self-management intervention plan that included risk stratification, formal education sessions during which nurses taught specific disease management skills to members, 24-hour access to nurse counseling, and sources of symptom advice (a telephone line, printed action plans, and workbooks). In addition, enrollees received individualized assessment letters and reminders (for medication compliance and vaccination). Physicians received alerts about signs and symptoms of decompensation and notifications of gaps between member-reported practice and guideline recommendations.
Participating members received multiple nurse contacts throughout the course of the intervention. A contact is any staff and member personal interaction related to the member's condition. Examples of contacts up to and including the month of measurement will be described and include (1) staff-member assessments (initial, biannual, and annual), (2) staff-member monitoring/education calls, and (3) staff-member symptomatic calls. Doses were defined as the number of cumulative contacts of any kind that a member had up to and including the month of analysis.
Scheduled member assessments
The nursing staff-member assessments (initial, biannual, and annual) included gathering member self-reported information on areas such as medication use; adherence and barriers; biometric data, such as current weight and recent tests performed; immunizations; knowledge of their chronic condition(s) and symptoms; current condition self-management practices; use of a medical home; and recent emergency department or inpatient utilization. Assessments always were conducted by a registered nurse (RN). Although most assessments were done telephonically, some were conducted face-to-face at a mutually agreed upon location. An assessment could have been completed in a single session, or in more than 1 session in the case of an incomplete assessment that required a follow-up session to gather the remaining information. Upon completion of the assessment, an individualized care plan was created. Assessments occurred initially and at 6-month intervals thereafter to update member status data and to update/revise the care plan and member goals.
Scheduled member monitoring/education calls
The staff-member monitoring/education contacts were planned (scheduled) sessions that occurred in the interim periods between assessments. Activities typical of this contact type included addressing the member's care plan problems and addressing any other pressing member concerns. The staff employed motivational interviewing to facilitate needed behavior changes so that members could effectively self-manage their chronic condition(s).
Depending on the member needs, condition-specific education was provided that may have included understanding of the health condition(s), medication use, lifestyle, and how to recognize symptoms of decompensation and appropriate actions. To support the member communications with providers, mock scenarios may have been playacted.
Although the primary staff were RNs, other program staff included social workers, community health workers, and behavioral health specialists.
Unscheduled member symptomatic calls
The staff-member symptomatic calls were ad hoc or unscheduled contacts that occurred in addition to the scheduled monitoring/education contacts already described. These contacts occurred when a member reported actual symptoms; staff followed up on the status by contacting the member the following day to assure appropriate steps had been taken. This contact type also was used to address other member-reported issues that were appropriate for follow-up prior to the next scheduled contact. Examples include follow-up with the member after a visit to a provider, or advice when a member wants to discuss current symptoms or other more urgent needs.
Research design
Multivariate regression analysis of panel data was used to evaluate the intervention and test the hypothesis that increased disease management contacts lower the odds of an inpatient admission.
The panel or longitudinal data structure comes from observations for many units of measurement across multiple time periods. For this analysis, the unit of measurement is the individual Medicaid member, with each member measured for each calendar month between July 2005 and June 2009 for the months they were eligible for Medicaid. For example, if a member was continuously eligible between July 2005 and June 2009, then this member would have 48 observations (1 for each month). If a member is eligible only in the first and fourth year, then only those months are included for that member.
The intervention started in July 2006. As such, the 12 months of data for everyone for the period between July 2005 and June 2006 will not contain any disease management contacts. Given the panel data structure of 1 observation for each member for each month of their Medicaid eligibility, a member can switch from a nonintervention month to an intervention month. That is, if a person were continuously eligible for the entire 48 months and began receiving contacts in month 37, then only months 37–48 would be months with an indicated contact. Once a member starts receiving contacts, every subsequent month will be indicated as a month of contact because the contacts in each month are the cumulative number of contacts a member has had up to that point.
The dependent variable was the dichotomous indicator of whether the member had an inpatient admission in a given month—not the total number of admissions but merely the presence of any admission (1=presence of an admission, 0 otherwise). For each monthly observation, an indicator of whether an inpatient admission occurred during that month is calculated. The dichotomous formulation of this variable allows for a logistic regression to be estimated and odds ratios to be calculated. It was possible for a member to have multiple inpatient admissions in a given month. Of the 55,647 inpatient admissions by the study group after being referred to the intervention, 20.3% were secondary admissions for any reason within a given month. As such, these estimates may be understated because reducing a member's number of inpatient admissions in a given month from 2 to 1 will still result in an indicator that an inpatient admission occurred during that month and no reduction will be estimated with the logistic regression.
The independent or explanatory variables include (1) a referral indicator showing whether a member had been referred to a particular disease management program (ie, asthma, diabetes, CHF, CAD, COPD); (2) the cumulative number of contacts (doses) for each particular intervention a member has had including doses squared and cubed; (3) a high-risk indicator for members identified as having cancer, end-stage renal disease, human immunodeficiency virus, hemophilia, traumatic brain injury, or a previous organ transplant; (4) age/sex grouping; (5) the predictive model acute index and chronic index scores prior to each member being referred into a disease management program calculated by the predictive modeling company MEDai (MEDai, Inc., Orlando, FL); and (6) a time variable. The MEDai predictive model achieved the highest ranking in terms of being able to predict future costs in the latest Society of Actuaries review of predictive models. 22
Multivariate regression analysis allowed for simultaneous estimation of several explanatory variables influencing a member either at the same or different times. That is, if a member had both CHF and asthma, the number of contacts related to each condition were used as explanatory variables. There would be 1 explanatory variable for the cumulative number of CHF contacts up to that month as well as an explanatory variable for the cumulative number of asthma contacts up to that month if a member participated in both programs.
To calculate the dose-response effect, a cubic representation was chosen to allow for a flexible functional representation and to allow for a quadratic as a special case. Contact or dose variables were calculated for each condition (eg, the number of asthma contacts, the number of asthma contacts squared, and the number of asthma contacts cubed were calculated). The coefficients of each of these 3 variables were then estimated in the regression analysis and used to estimate the odds ratio for each level of contact.
Return on investment
In addition to looking at condition-specific results from a clinical perspective, this study's results can be evaluated at the program level from a business perspective by estimating the program's return on investment. The 2 necessary pieces for estimating the program's return on investment are:
• Program Savings: member claim costs eliminated by standard disease management
• Program Cost: direct cost of standard disease management
Program savings can be estimated by first applying the odds ratios to proportions of the study population exposed to each level of intervention to estimate population attributable risk percentages. 23 Using the population attributable risk results, the number of expected inpatient admissions for the intervention cohort in the absence of disease management can be calculated. By subtracting the number of actual inpatient admissions, the number of eliminated, or saved, admissions is calculated.
Results
Descriptive statistics
Descriptive statistics for the study population are displayed in Table 1. The range of contacts was from 1 to 19 for asthma, 17 for CAD, 27 for CHF, 20 for COPD, and 18 for diabetes.
DM, disease management; IP, inpatient.
Multivariate regression results
The dose-response impact is considered statistically significant (rejecting the null hypothesis that the dose variable odds ratio is 1.0) if Pearson's chi-square test P value is 5% or less. The odds ratios of having an inpatient admission at various dose levels for all programs are shown in Figures 1 and 2. The figures display these results for each condition graphically, whereas Table 2 presents the odds ratios and levels of significance for each level of contact.
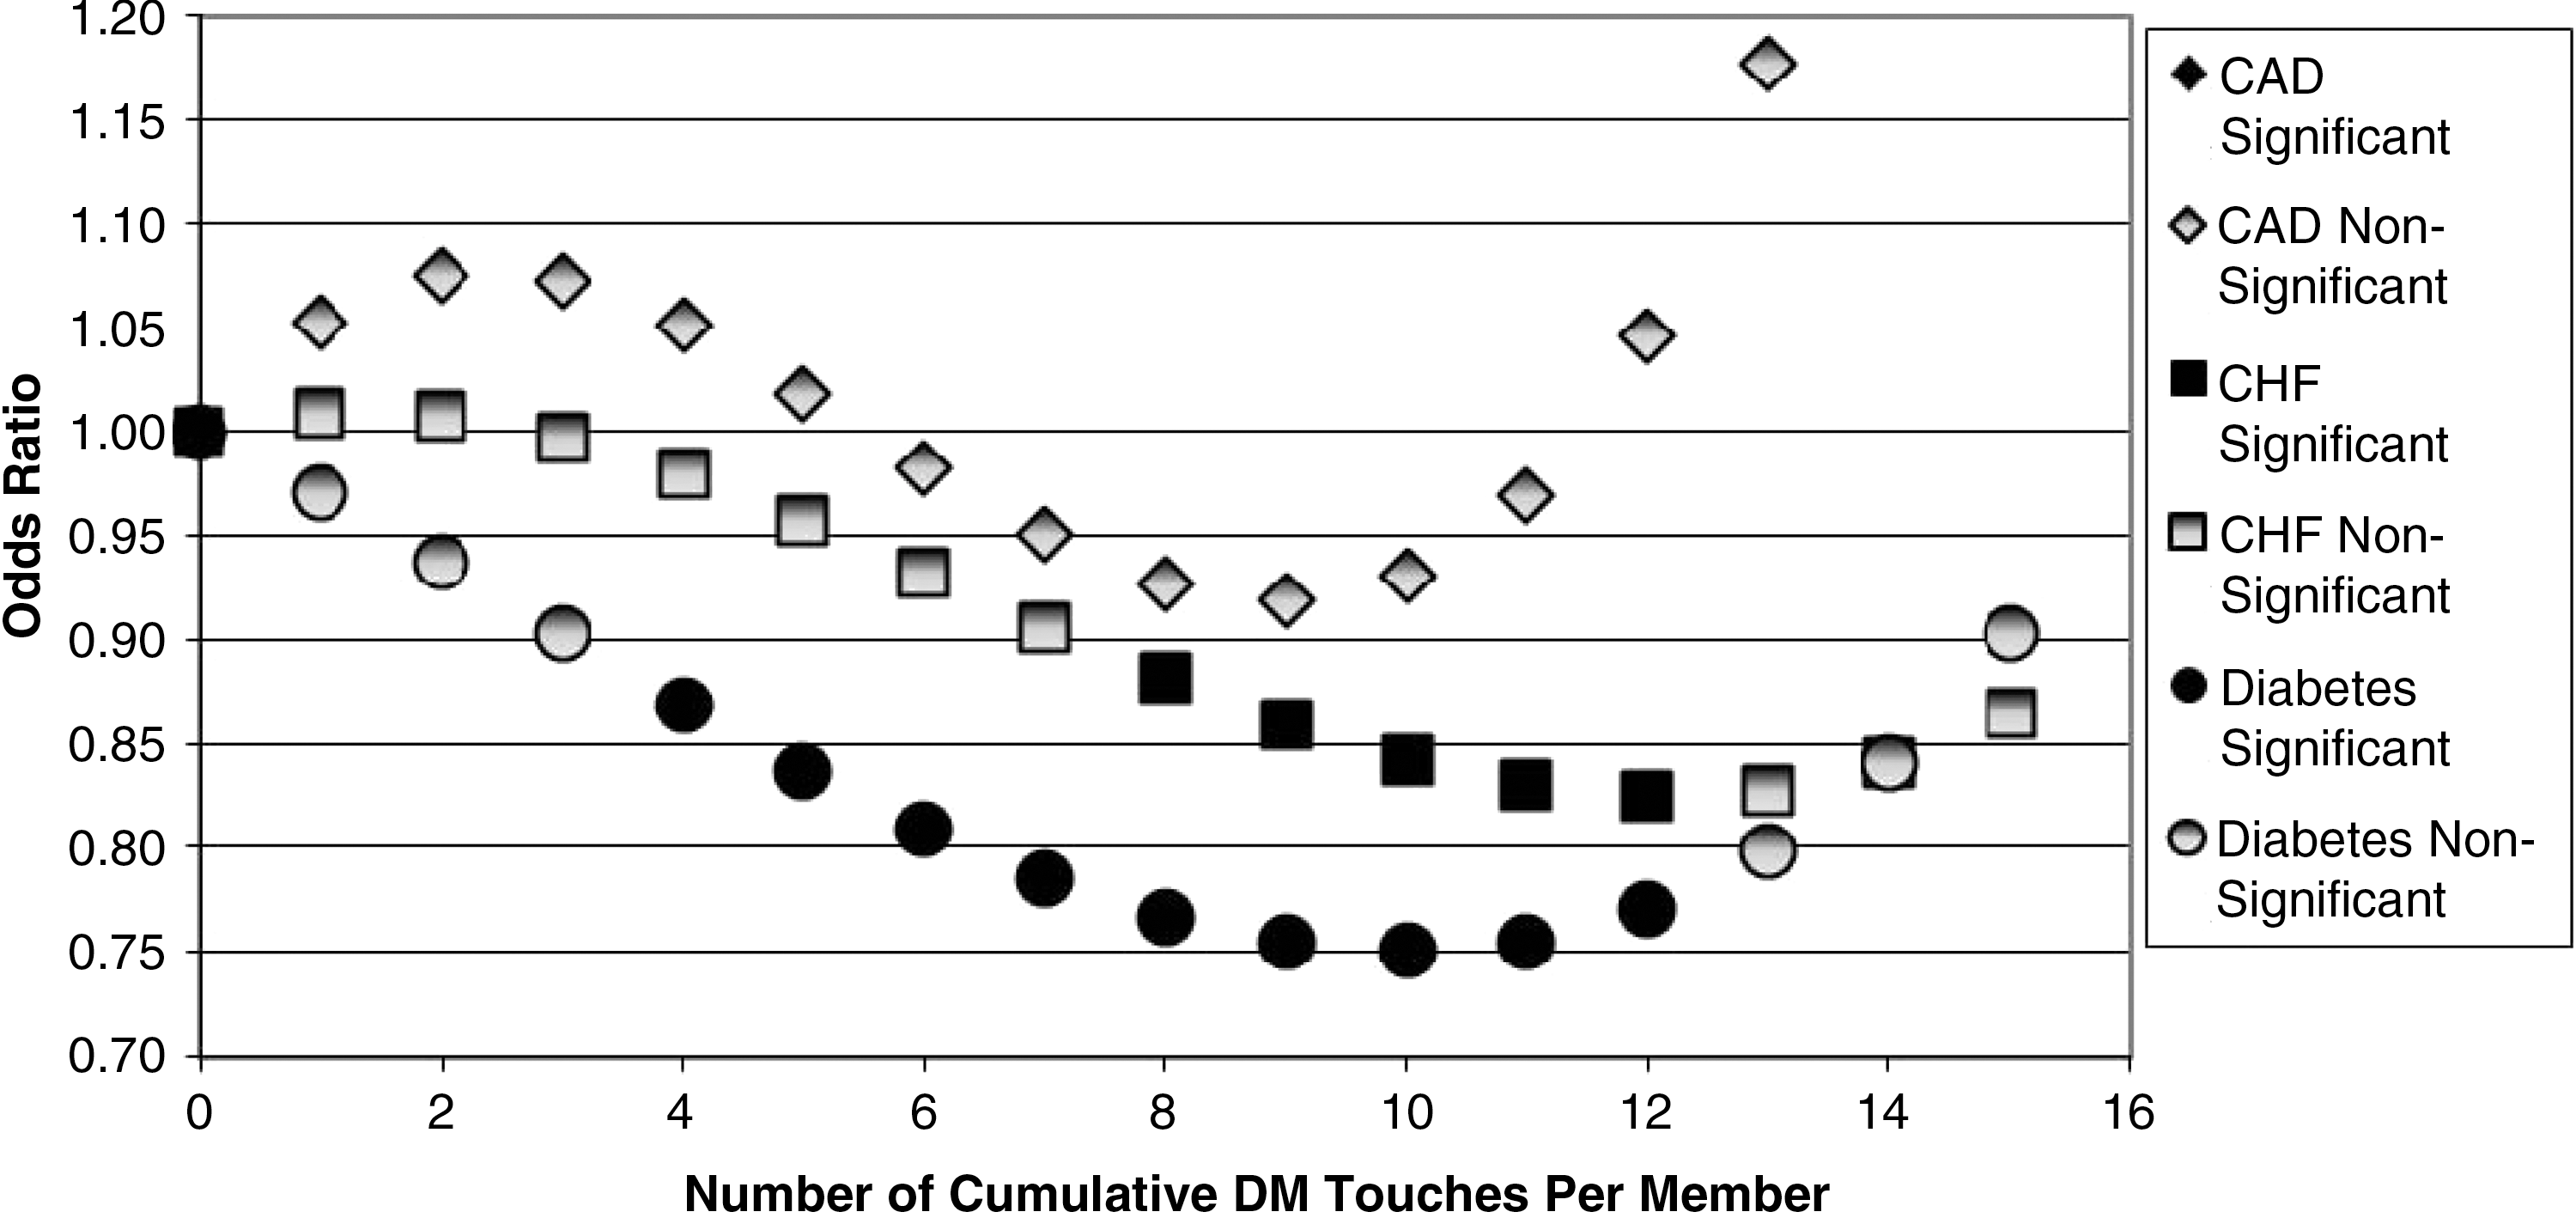
Dose-response impact for congestive heart failure (CHF), coronary artery disease (CAD), and diabetes. DM, disease management.
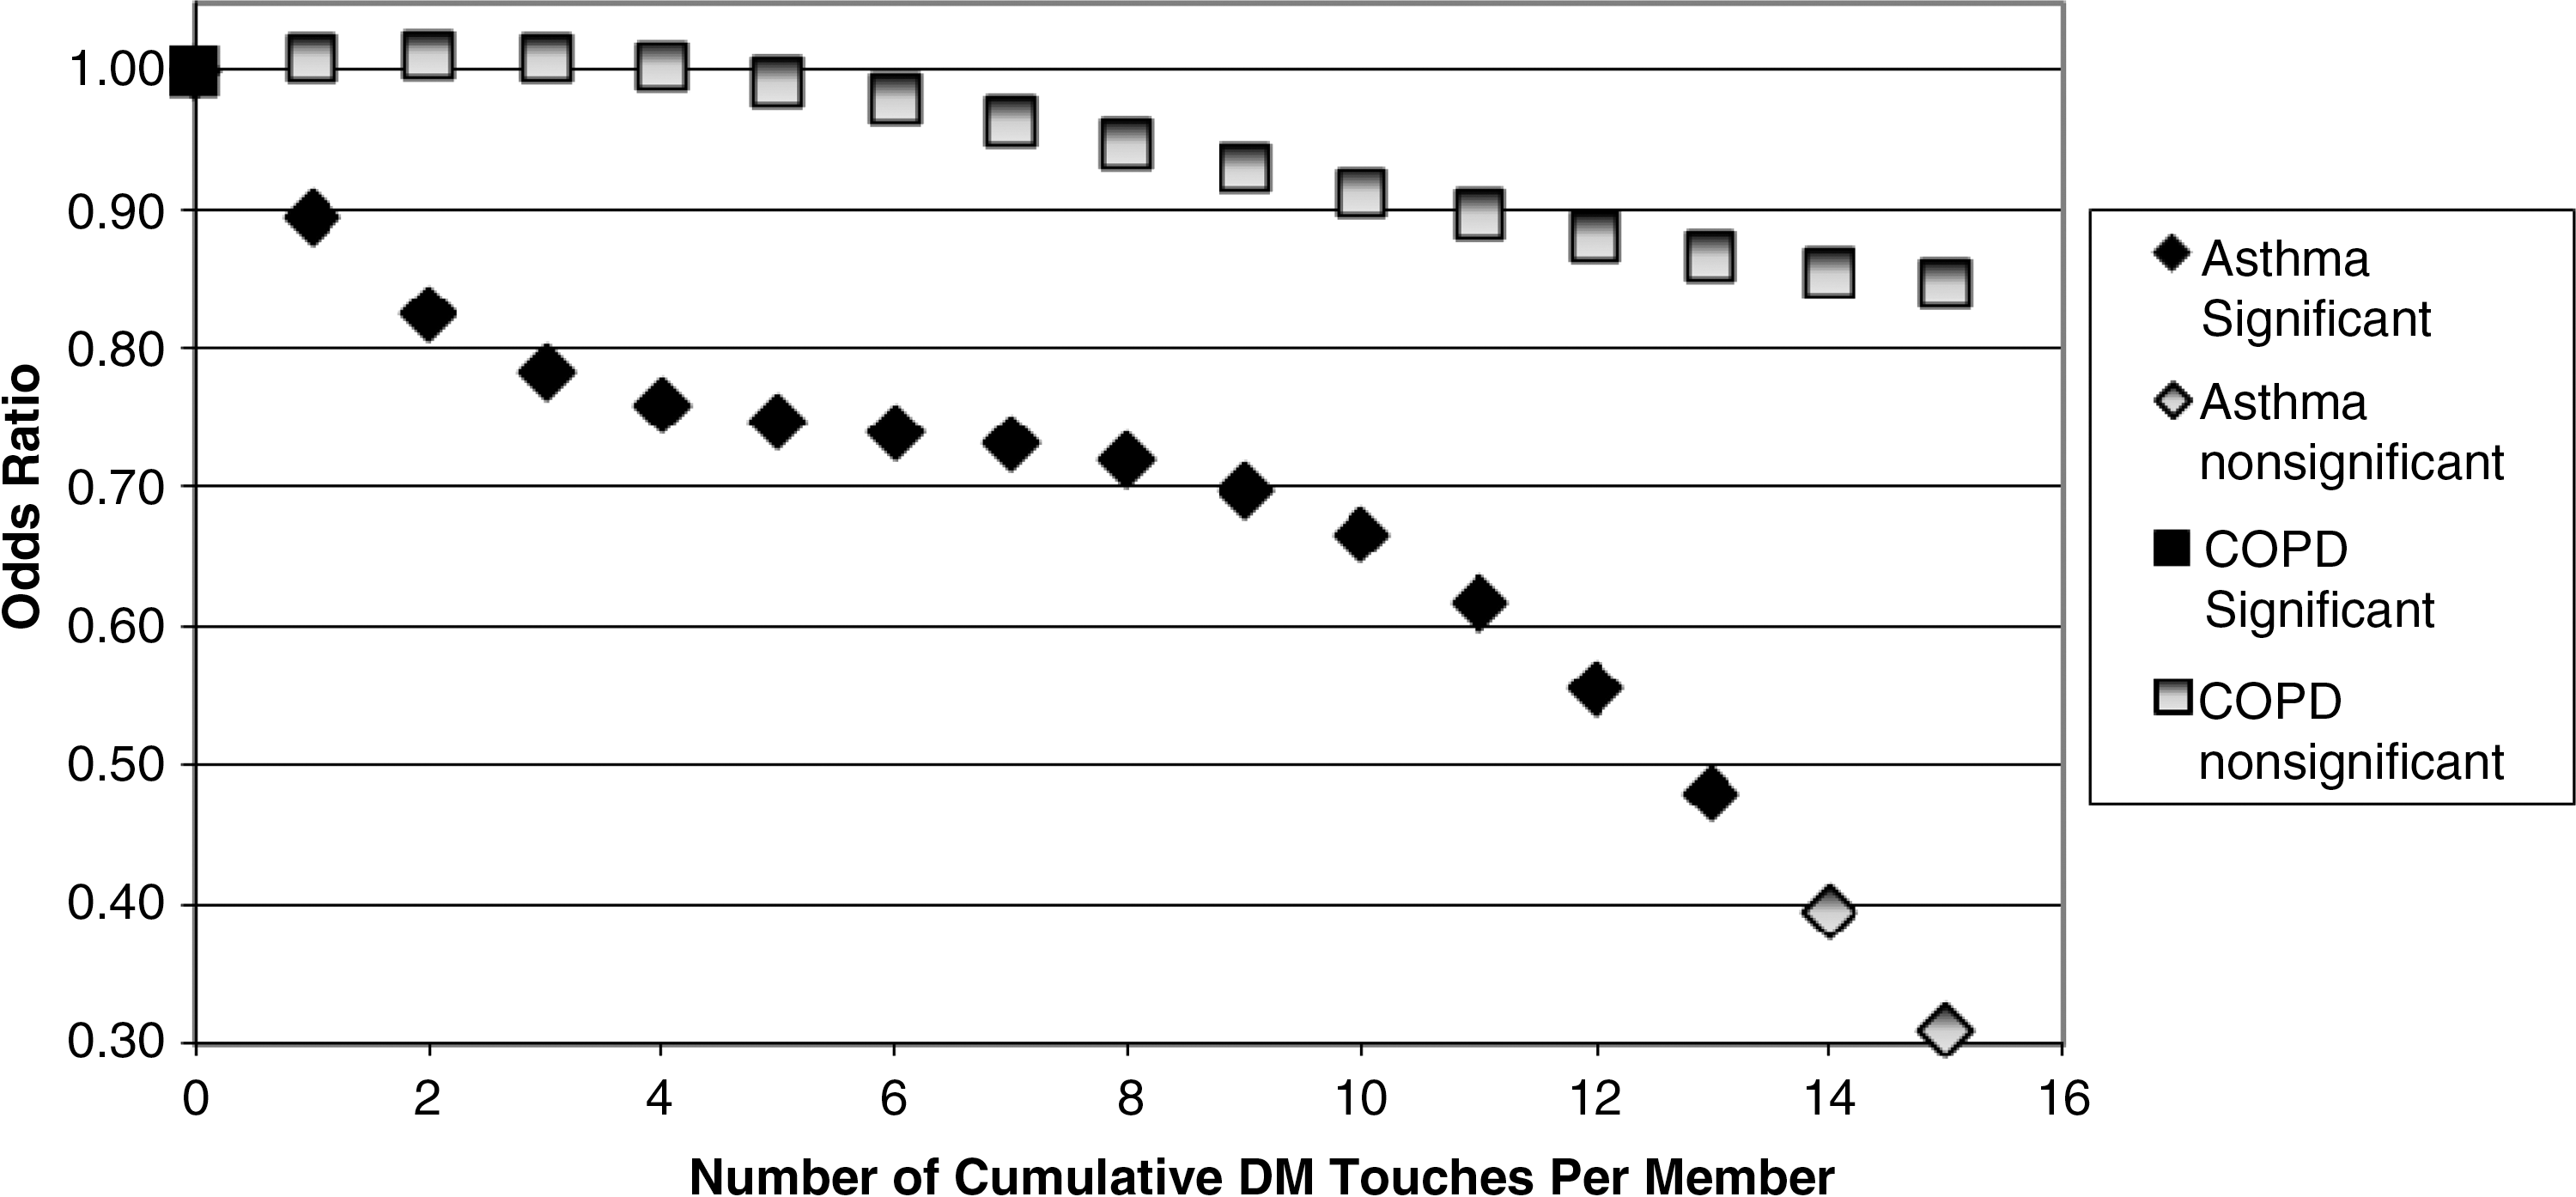
Dose-response impact for asthma and chronic obstructive pulmonary disease (COPD). DM, disease management.
P≤0.10; ** P≤0.05; *** P≤0.01.
CAD, coronary artery disease; CHF, congestive heart failure; COPD, chronic obstructive pulmonary disease
Results by diagnosis
Coronary artery disease
The CAD dose-response impact on inpatient admissions did not show any statistically significant impact at the 5% level. Although the CAD intervention impact was not supported in this study, results were still directionally positive in the 6 through 11 dose range. This lends itself to future study with additional years of study data to determine if significant impact can be achieved for this intervention.
Congestive heart failure
The CHF dose-response impact on inpatient admissions provided statistically significant impact at 8 through 12 doses. At these levels, there was a significantly reduced likelihood of inpatient admissions. Maximum impact, in terms of lowest odds ratio, was shown at 12 doses with a P value of 0.04 and a corresponding odds ratio of 0.82.
The CHF disease management intervention showed that it takes a longer period of time and numerous contacts before a significant impact can be achieved. By showing patience with this intervention, inpatient admissions can be reduced by nearly 20%.
Diabetes
The diabetes dose response impact on inpatient admissions provided statistically significant impact at 4 through 12 doses, all of which showed a reduced likelihood of inpatient admissions. Maximum impact was shown at 10 doses with a P value of 0.004 and a corresponding odds ratio of 0.75. Along with asthma, the diabetes intervention showed the most significant impact in terms of P value and odds ratios. After 11 doses, dose marginal effectiveness started to decrease, with inpatient admissions being reduced by an estimated 25%.
Asthma
The asthma dose-response impact on inpatient admissions provided statistically significant impact at dose 1 and dose 8 through dose 13, all showing reduced likelihood of inpatient admissions. Maximum impact was shown at 13 doses with a P value equal to 0.02 and a corresponding odds ratio of 0.48. The asthma intervention impact was similar to diabetes. However, asthma showed these results much earlier in the intervention. Odds ratios dropped below 0.80 after just 3 doses and reached 0.70 after just 9 doses.
Chronic obstructive pulmonary disease
The COPD dose-response impact on inpatient admissions did not show any statistically significant impact at the 5% level. Although the COPD intervention impact was not supported in this study, results were still directionally positive in the 5 and above dose range. This lends itself to future study with additional years of study data to determine if significant impact can be achieved for this intervention.
Program return on investment
Total inpatient savings as a direct result of the disease management program during the study period is estimated to be $12.4 million. This is calculated by multiplying the average cost of actual inpatient admissions ($6079 per admission paid) by the number of admissions avoided. A total of 2047 admissions were avoided based on the odds ratio and attributable risk for the population for each contact level.
The direct standard disease management program cost during the study period was approximately $6.8 million, resulting in an estimated program return on investment of 1.84 (savings of $12.4 million divided by cost of $6.8 million).
Discussion
Disease management staff have cited that the most difficult challenges in disease management programs stem from the populations' burden of illness, habitual negative patterns of health behaviors, and years of barriers to access to care; these factors contributed to participants making unfortunate decisions and mismanaging their own health care. Because of the multifarious nature of human behavior, which is complicated by complex situations and chronic health issues, a multipronged approach is required to have a positive impact on health outcomes and behaviors. This approach must focus on supporting and motivating the individual member as well as on supporting and motivating a health care delivery system that has been penalized financially for caring for this population in lieu of other populations with private insurance and/or Medicare.
Therefore, successful disease management programs also must work with providers to support improvements in the quality of care delivered. By facilitating better adherence to evidence-based clinical guidelines and promoting coordinating efforts and communication avenues between the multiple providers invested in the member's care, 1,2 disease management programs will increase savings and quality of care.
This study has shown that there are statistically significant reductions of inpatient hospitalizations for members diagnosed with asthma, CHF, and diabetes, but no statistically significant impact on members with CAD or COPD. Using the Illinois disease management model, the data show that the number of contacts needed to reach statistical significance for reducing hospital utilization varies by condition. In practice, this means that when designing disease management programs, varying levels of contacts can be prescribed depending on the condition. For instance, asthma reaches a statistically significant low odds ratio after 8 contacts whereas diabetes requires 4 contacts. This may be related to the varying level of complexity of each disease and the willingness of participating members to modify behaviors.
There are known challenges to working with the Medicaid population. Among these is the ability to maintain contact over time, largely because of population mobility and eligibility churn. Every effort was made to maintain contact; efforts included using community health workers to locate members, and gathering updated member demographic data from provider offices and clinics as well as from any hospitalization, whereby demographic data were obtained via utilization management sources.
Limitations
One limitation of this study may be its ability to be generalized. This study was specific to a state Medicaid population and the feasibility of translating it to either another Medicaid population or a commercially insured population is unknown but suggests areas for future research. However, given the success of disease management in both commercial and Medicaid populations, there is a high likelihood that the results may be generalized. Another limitation is the quasi-experimental study design. Because randomization was not possible, observing differences between months of no intervention and months subsequent to intervention are compared. There may be selection bias resulting from members choosing to participate that may not be controlled for with the observable variables. Even though members agree to participate, the level of contacts is determined by the nurse through risk assessment. Apart from an experimental design, the magnitude of this potential bias cannot be known.
Footnotes
Disclosure Statement
Dr. Berg, Mr. Donnelly, and Ms. Warnick are employed by McKesson Corporation; McKesson Corporation administered the intervention for the State of Illinois. Ms. Miller and Dr. Medina are employed by the State of Illinois.