
Abstract
The objective of this study was to examine the impact of PepsiCo's health and wellness program on medical cost and utilization. The authors analyzed health plan and program data of employees and dependents 19–64 years of age, who had 2 years of baseline data (2002 and 2003) and at least 1 year of data from the intervention period (2004 to 2007), resulting in a sample of 55,030 members. Program effects were measured using a difference-in-difference approach based on a multivariate regression model with an individual-level random effect. In its first year, the program was associated with a relative increase in per member per month (PMPM) cost ($66, P<0.01); a relative reduction in PMPM costs of $76 (P<0.01) and $61 (P<0.01) was seen in the second and third year, respectively. Over all 3 years, the program was associated with reduced PMPM costs of $38 (P<0.01), a decrease of 50 emergency room visits per 1000 member years (P<0.01), and a decrease of 16 hospital admissions per 1000 member years (P<0.01). The disease management component reduced PMPM costs by $154 (P<0.01), case management increased PMPM costs by $2795 (P<0.01), but no significant effects were observed for lifestyle management over the 3 intervention years. The implementation of a comprehensive health and wellness program was associated with a cost increase in the first year, followed by a decrease in the following years. These results highlight the importance of taking a long-term perspective when implementing such programs and evaluating their effectiveness. (Population Health Management 2013;16:1–6)
Introduction
To our knowledge, there is no published evidence on the long-term effects of comprehensive health and wellness programs, even though some of their individual components have been the subject of research. Some evidence suggests that lifestyle modification programs reduce health risk, absenteeism, and medical costs in as little as 1 year. 7 –11 Conversely, research on disease management has been largely unable to detect conclusive evidence for cost savings. 12 –15
To improve the understanding of the long-term impact of health and wellness programs, the authors measured the effect of HealthRoads, PepsiCo's employee wellness program, on medical care cost and utilization over a 3-year period starting in 2004. A difference-in-difference approach was used to estimate program- and component-specific effects in each of the 3 years following implementation.
This study contributes to the literature in several respects. First, with 2 years of baseline and 3 years of follow-up data, it is one of the few studies to examine worksite programs based on longitudinal data. 16 –19 Second, having longitudinal data for a large sample allowed the estimation of year-specific measures of program effects. Third, the authors used 2 years of baseline data to control for regression to the mean more rigorously than existing studies. Finally, this study is one of the few to examine potential synergies between disease management and lifestyle modification. 5
Methods
Program description
PepsiCo offers HealthRoads to the employees and dependents in its self-insured health plans, a continuum of care management services and health promotion activities that include a self-administered health risk appraisal (HRA), case management, disease management, lifestyle management, and a nurse advice line. Eligibility for case and disease management is based on a combination of claims and HRA data; eligibility for lifestyle management is based on HRA data and direct referrals; and any adult can access the nurse advice line or HRA. Eligible members are contacted by mail, e-mail, and telephone, and incentives are offered to increase awareness, encourage ongoing engagement, and promote behavior change.
Data sources
The authors analyzed the health plan enrollment and claims data of all US-based PepsiCo employees and their adult dependents between the ages of 19 and 64 years who enrolled in a self-insured plan covering the period between September 2002 and August 2007. Program eligibility and participation data were obtained from the respective vendors and linked to the claims and enrollment data. Over the 5-year study period, annual enrollment ranged from 145,574 to 158,981 members. Given that 3 of the 5 program components (ie, HRA, lifestyle management, nurse advice line) were implemented in 2004, the 2 years between September 2002 and August 2004 were treated as the baseline period and the 3 years between September 2004 and August 2007 were considered to be the intervention period.
Analytic sample
Members who were participating in case management, disease management, or both during the baseline period were excluded because they would not contribute to the identification of the program effects. In order to control for regression to the mean, the authors included only those members with 2 complete years of baseline data and at least 1 year of intervention data. Member years also were excluded if less than the full 12 months were available in an intervention year, because of possible seasonal variation in cost and use. A sensitivity analysis revealed that dropping partial member years did not substantively influence the findings. The final analytical sample consisted of 55,030 members for a total of 256,112 member years.
Cost and utilization
Following Disease Management Association of America (now the Care Continuum Alliance) guidelines, 20 the authors measured medical cost as per member per month (PMPM) cost, including both medical claims and prescription drug claims. To reduce the influence of outliers, annual cost was truncated at $100,000 per member per year. 20 Costs are reported in 2001 dollars based on Producer Price Indices for physician services, medical facility services, and prescription drugs. 21 Emergency room (ER) visits and inpatient (IP) hospital admissions are reported per 1000 member years.
Treatment and comparison groups
An intent-to-treat approach was used to define treatment and comparison groups in order to minimize bias resulting from the hypothesized tendency of more motivated members to engage and adhere more readily in program interventions compared to their less motivated counterparts. The treatment group was defined as having been identified as eligible for case management, disease management, and lifestyle management based on HRA results or claims data, regardless of whether program staff succeeded in engaging identified members to participate actively. Given that it takes time to change the status of chronic conditions or lifestyle, the authors considered that, once identified, members were eligible for disease management and lifestyle management for the rest of the study period. Completing an HRA was not considered to be an intervention because it was used merely to determine eligibility for other program components. The comparison group was defined as those members who were not eligible for case management, disease management, or lifestyle management. As all adult members were eligible for the nurse advice line, there were no corresponding control members for nurse line, and they were excluded from the main analysis. The secondary analysis that included 724 members (1.3% of all members) using the nurse advice line in any of the intervention years did not change the main conclusions (data not shown).
Covariates
The impact of health status on cost and utilization was controlled for using DxCG scores provided by PepsiCo's healthcare data vendor, Thomson Reuters. This score captures a member's predicted medical cost based on current diagnoses and services relative to a national benchmark. Additionally, the analysis controlled for baseline cost and utilization, calendar years, age, sex, and comorbidities, which include asthma, coronary artery disease, congestive heart failure, chronic obstructive pulmonary disease, depression, diabetes, and cerebrovascular disease.
Analytic approach
Program effects were estimated by comparing changes in medical costs and utilization between the second baseline year and each of the intervention years for eligible and ineligible members, adjusting for covariates and secular trends in cost and utilization. Individual-level random effects were included to protect against bias from unobserved differences in motivation and preferences that influence engagement, adherence, and ultimately program outcomes. 22 –24 This approach was based on the premise that, after controlling for individual health risk, the cost and utilization trends would be similar for eligible and ineligible members in the absence of the programs.
A linear mixed model was estimated in the following form:
where i indexes individual and t indexes intervention year. Yit refers to the cost or utilization for member i in year t. Baseline1i and Baseline2i refer to the baseline cost or utilization in the first baseline and the second baseline year, respectively. Year is the time fixed effect, where the first intervention year is omitted in the model. Programit indicates whether member i was eligible in Year t. In order to estimate differential effects of programs during different time periods, interactions between Year and Program were specified in the model. The programs were only allowed to have an effect on the current or following years in the analysis. For example, the second year's intervention could only have an effect on the outcome of the second and third intervention years. Xit represents individual characteristics of member i in Year t, including sex, age groups (19–29, 30–44, 45–64, 65+), DxCG scores, and a set of dummy variables for various comorbidities. A random effect at the individual level is captured by ui, which accounts for unobserved variation across individuals in cost and utilization. ɛit is the individual time-specific error term. In addition to the terms listed above, interactions between program components and quadratic terms of continuous variables were used when appropriate based on Akaike's information criteria. 25 In addition, the statistical significance of the interaction between disease management and lifestyle management was tested when appropriate. The estimated effects of the program in multiple years were based on linear combinations of the effects of each year's intervention on the outcomes of different study years. Using this approach, the cumulative effect of 3 years of continuous intervention on cost and utilization was calculated.
Results
Descriptive results
There were 55,030 members in the final analytic sample. Per the inclusion criteria, all members included were in the 2 baseline years, 97.0% (n=53,375) of members were observed in the first intervention year, 88.3% (n=48,604) were tracked through the second, and 80.1% (44,073) through the third intervention year. A total of 1655 (3.0%) members did not have the necessary 12 months of data for the first intervention year, but had full-year data for either the second or third intervention year. As illustrated in Table 1, eligible members were less likely to be female, but more likely to be older than 45 years of age and employees. At baseline, eligible members had more chronic conditions and a higher average DxCG score, but slightly fewer ER visits and IP admissions.
CAD, coronary artery disease; CHF, congestive heart failure; COPD, chronic obstructive pulmonary disease; ER, emergency room; IP, inpatient.
Any condition refers to any of the 5 specified conditions.
As shown in Figure 1, members ineligible for any of the program components had the lowest PMPM costs during the intervention period, followed by eligible members for lifestyle management, disease management, and case management. The secular cost trend in the 2 baseline years showed a similar pattern.
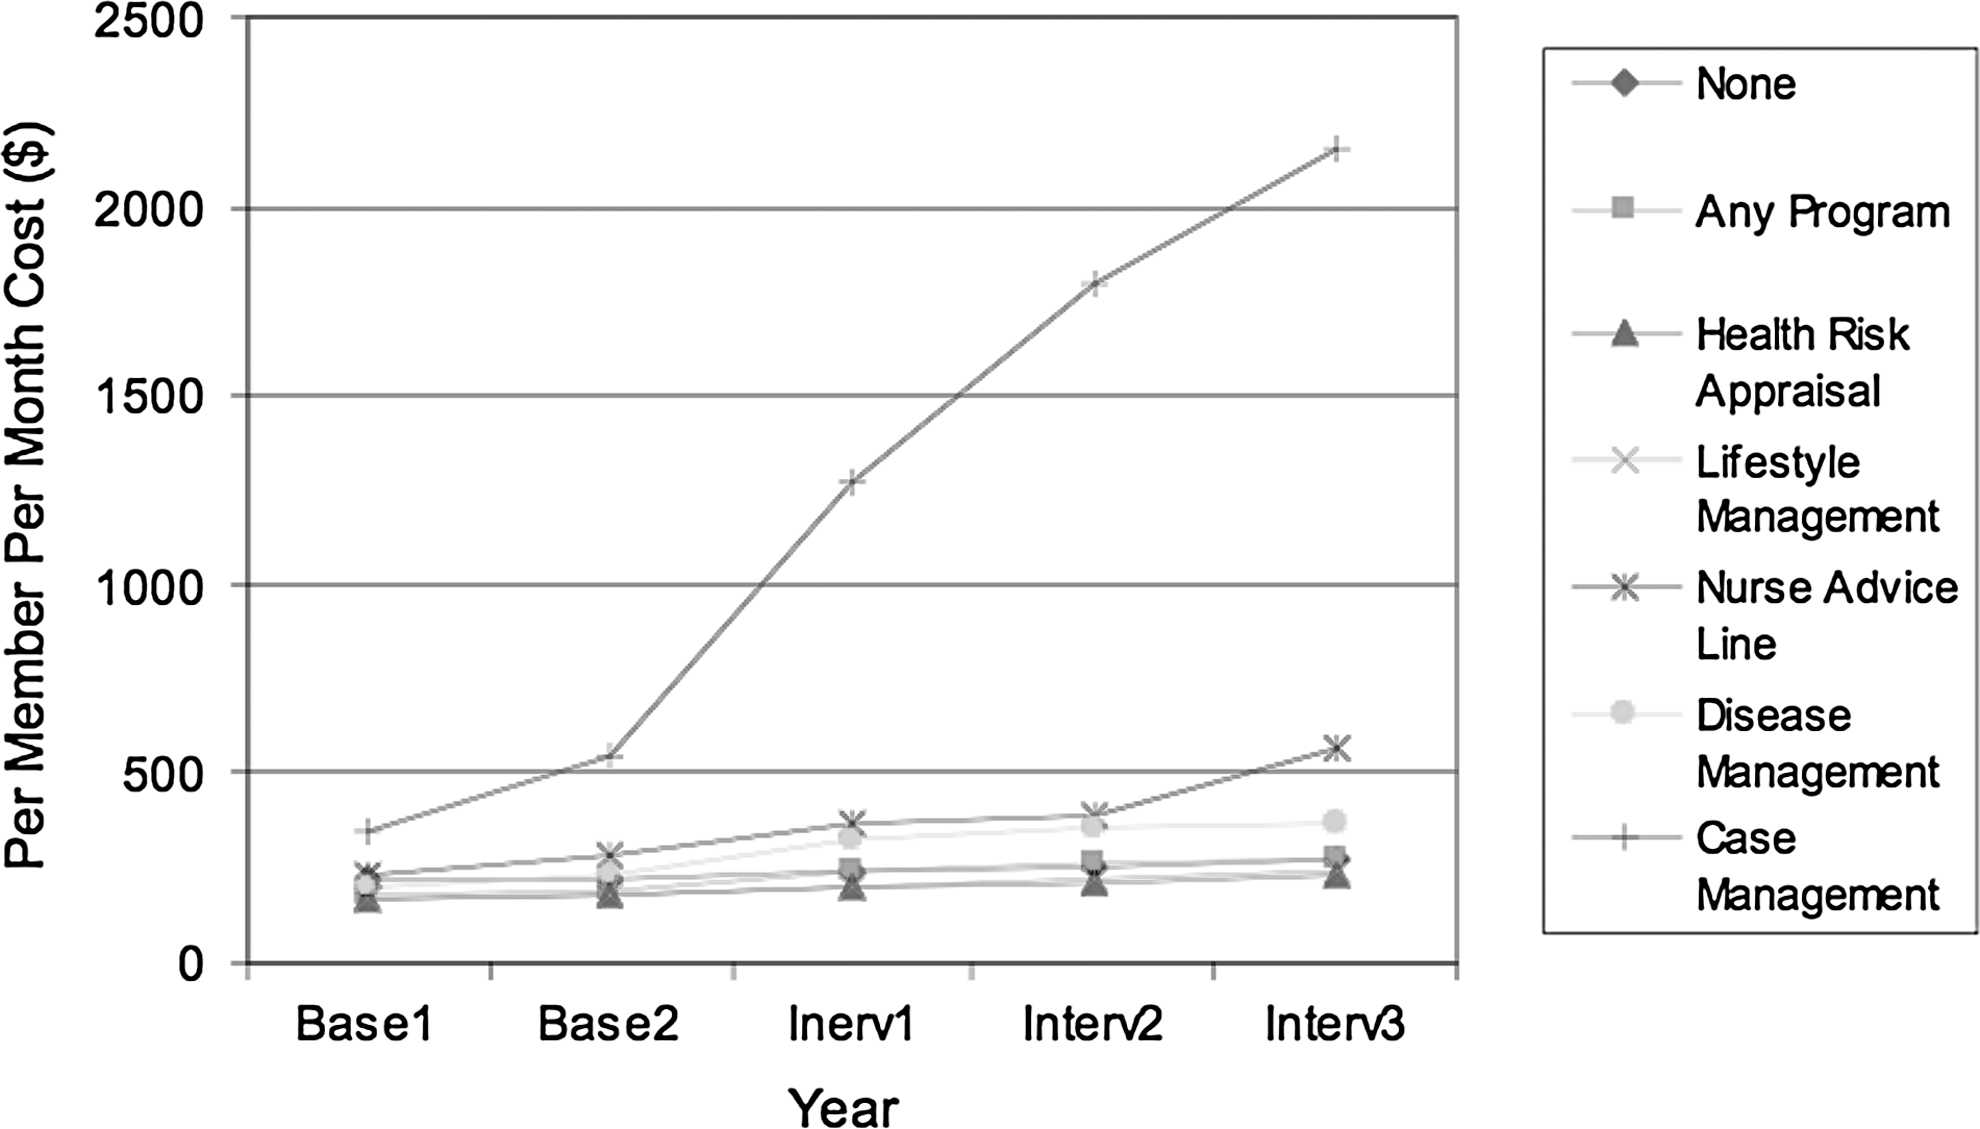
Unadjusted cost trend by program component.
The proportion of members eligible for any program component increased from 26.9% to 49.3% over the course of the 3 intervention years (Table 2); roughly three quarters of these were eligible for lifestyle management. There was little overlap between programs except that 1.8%=8.6% of the analytic sample was eligible for both disease management and lifestyle management during the 3 intervention years (data not shown). Approximately half of the eligible members actively engaged in the programs with the exception that only about 20% of members eligible for disease management participated. The DxCG scores of both eligible members and participants increased over time but participants had higher DxCG scores than eligible members. As expected, case management eligible members or participants had much higher DxCG scores than those in disease management or lifestyle management.
Categories are nonexclusive (ie, members may be eligible for more than 1 program).
Percent of total analytic sample.
Any program component includes case management, disease management, and lifestyle management.
Multivariate results
Compared to ineligible members, eligible members had larger trends in PMPM costs and utilization in the first year, but had smaller trends in overall PMPM costs and utilization by the end of the third year. Table 3 shows the estimated difference in differences for 1 or more program components (referred to as “any program”) in a given treatment year on outcomes in that and subsequent study years (outcome year). Relative to the ineligible members, eligible members experienced a greater cost increase in the first treatment year as well as a larger increase in IP admissions. However, eligible members had a larger cost decline in the second and third outcome years. Similarly, treatment in the first year was associated with significantly larger reductions in ER visits and IP admissions in the second outcome year but not the third outcome year. PMPM cost trends in the treatment group also were significantly higher for the second and third treatment years. Similar patterns were observed for individual program components such as case management and disease management, but not for lifestyle management (data not shown).
Difference between changes between the outcome year and second baseline year for eligible and ineligible members.
Estimated effects are significantly different from zero, P<0.05.
Estimated effects are significantly different from zero, P<0.01.
ER, emergency room; PMPM, per member per month.
Table 4 shows the estimated cumulative difference in differences over time for each of the program components. The results suggest a clear trend toward lower cost and hospital and ER utilization over time for members who were eligible for any program and for disease management individually. Over 3 intervention years, any program and disease management were associated with significantly larger reductions in PMPM costs, ER visits, and IP admissions. Compared to ineligible members, those eligible for case management experienced a significant relative increase in costs and IP admissions but with a relative decrease in ER visits. No significant cumulative effects were observed for lifestyle management over 3 intervention years.
Difference between changes between the outcome year and second baseline year for eligible and ineligible members.
Estimated effects are significantly different from zero, P<0.05.
Estimated effects are significantly different from zero, P<0.01.
ER, emergency room; PMPM, per member per month.
Interactions between disease management and lifestyle management contributed to the overall model fit for medical costs but not for utilization. The authors found that being eligible both for disease management and lifestyle management was associated with a significantly larger PMPM cost increase by the end of the third year ($107.5). As a result, members eligible for both program components showed only a nonsignificant cost decrease trend compared to ineligible members by the end of the intervention period (data not shown).
Discussion
We estimated the effect of PepsiCo's comprehensive health and wellness program on medical care costs and utilization of its employees and their dependents over time. To our knowledge, this is the first published evaluation of this novel program type using longitudinal data. We found that costs increased in the first year of intervention but then declined over time, resulting in an overall reduction of direct medical cost by year 3 of program implementation. Cost savings were driven largely by reductions in both ER visits and IP admissions that declined in years 2 and 3 after an initial increase in the first year after implementation. This trend suggests that larger cost savings may be possible if the members were followed for a longer period of time.
Our findings are consistent with a growing body of evidence that health and wellness programs and disease management programs do not reduce cost in their initial year. An earlier analysis of ours had shown that a comprehensive health and wellness program of 2 employers increased cost in its first year. 5 Several evaluations of disease and care management programs in various Medicare populations consistently failed to show early savings 12 and a recent systematic review of the disease management literature found little convincing evidence for cost savings. 15 Those findings have cast doubt on the assertion that disease management can help contain medical cost growth. Our study, however, suggests that savings might be possible with longer program duration, as the disease management component accounted for most of the health and wellness program's savings.
Unexpectedly, lifestyle management did not generate cost savings by the third intervention year, even though there is a solid body of evidence that lifestyle management can lower direct medical cost 8 –10 and that this effect becomes more prominent over time. 11,18 We also found members eligible for the case management program continued to have higher costs than the reference group, even after adjusting for observable differences in risk. Members eligible for case management tend to be high-risk patients with complex and ill-defined medical problems, and cost and utilization in this outer tail of the distribution are notoriously difficult to predict. Despite the obvious conceptual rationale for comprehensive programs, we found that being eligible for lifestyle management and disease management was associated with a relative cost increase. More evidence is needed to confirm this finding and investigate how these 2 program components interact with each other.
Because the purpose of our study was to evaluate the program effect, we adopted an intent-to-treat approach. That is, we used those who were eligible for the program rather than those who actively engaged as the treatment group and the ineligible members as the comparison group. This approach reflects program effects in a real-world setting because participation will never be complete. The approach also should reduce selection bias, as members who actively engaged probably are more motivated to improve their health.
Our results should be considered in light of the following limitations. First, our findings are not fully protected against residual bias as unobservable differences in risk could have driven the results, even though we controlled for individual risk with DxCG scores and other covariates. Second, the difference-in-difference approach is based on the assumption that trends are similar for the treatment and comparison groups in the absence of the intervention. Our results indicate that during the 2 baseline years, the treatment group had a larger cost increase trend than the comparison group, which may have biased our estimates toward the null. Third, we were unable to obtain information on eligibility criteria, incentives for participation, and program fees, as these are proprietary. In the absence of information on program costs, we only evaluated the benefit side of a cost-benefit equation and were unable to estimate the return on investment.
Overall, this study supports the assumption that the cost savings resulting from comprehensive health and wellness program interventions are achievable but only become apparent by the third year of implementation. Our findings highlight the importance of long-term evaluations to estimate the effect of such programs, as well as the need for payers to take a long-term investment view when considering such programs. The inability to realize short-term savings might discourage payers with a focus on immediate returns on investment from adopting health and wellness programs, even though long-term savings could be achievable. This creates a challenge for health and wellness program developers to improve the value of their products in the short term, either by evidence-based strategies to get members to engage early and sustainably accelerate the program's impact or by reducing start-up costs with innovative pricing models.
Footnotes
Acknowledgment
The study was funded by PepsiCo Inc.
Disclosure Statement
Ms. Exum is an employee of PepsiCo Inc., the funder of this study. Drs. Liu, Harris, Serxner, and Mattke, and Ms. Weinberger, disclosed no conflicts of interest with regard to the research, authorship, and/or publication of this paper.