
Abstract

The symposium included didactic presentations, a panel discussion, and a breakout group session during which presenters and attendees were afforded an opportunity to raise questions and brainstorm additional solutions. Highlights and key messages of the symposium are summarized herein.
Diabetes Education is a collaborative process through which people who have diabetes, or are at risk for diabetes, gain the knowledge and skills needed to modify behavior and successfully self-manage the disease and its related conditions. Interactive and ongoing, diabetes education involves the person with diabetes (or family member/caregiver) and a diabetes educator or team of educators. Diabetes education aims to achieve optimal health status and better quality of life while reducing the need for costly health care services. Importantly, diabetes education is best provided by qualified diabetes educators.
Diabetes Educators are multidisciplinary health care professionals (primarily nurses but also dietitians, physicians, pharmacists, and allied health professionals) who make a positive difference in the lives of people with diabetes by providing diabetes self-management education/training (DSME/T); engaging in essential collaboration with endocrinologists, medical internists, and primary care physicians; and improving outcomes (ie, diabetes control, cost savings) by contributing to positive behavior change and improved self-management. Uniquely prepared to provide DSME/T, diabetes educators are found in most health care settings—from traditional hospital-based education programs to employer-based programs, community pharmacies, doctors' offices, health food stores, and disease management companies.
Founded in 1973, The American Association of Diabetes Educators (AADE) is a multidisciplinary association of health care professionals dedicated to integrating self-management as a key outcome in the care of people with diabetes and related chronic conditions. In order to advance the mission of the association and meet its strategic goals, AADE devotes resources to initiatives that focus on and ensure the following: Inclusion of diabetes educators in any team-based care provided for people with diabetes Fair reimbursement for providers of self-management education Integration of practice guidelines in clinical practices Increased patient access to diabetes education through an increased number of accredited DSME/T programs Increased research specific to the art and science of diabetes education Expanded utilization of diabetes education registries
Diabetes Education and Health Care Reform
Many of the top priorities of health care reform in the United States—prevention, chronic care management, reduction of racial and ethnic disparities, health information technology to support patient and physician decision making, transitions of care and care coordination, and patient-centered care with improved access to primary care—dovetail with the aforementioned AADE initiatives.
Diabetes prevention
An estimated 57 million Americans have prediabetes, which occurs on a continuum with diabetes. 1 If untreated, prediabetes generally will evolve into type 2 diabetes within a few years. Studies show that it is possible to stop or reverse the progression of diabetes, or substantially delay its onset. Specific strategies to achieve and maintain normal blood glucose levels most commonly involve educating an individual with prediabetes about how to make healthy lifestyle changes.
Using evidence-based approaches that incorporate prevention and self-management skills into patient education, diabetes educators are equipped to develop the necessary personalized education plan for each individual with prediabetes. The education plan may incorporate risk reduction and other prevention-related elements of the AADE7 Self-Care Behaviors: Healthy eating Being active Monitoring Taking prescribed medications Problem solving Reducing risk Healthy coping
Chronic care management
The most prevalent and threatening chronic disease in the country today, diabetes costs the United States $218 billion annually and contributes to more than 230,000 deaths each year. 2 Currently, 24 million Americans are diagnosed with diabetes; 90%–95% of them have been diagnosed with type 2 diabetes. Only 7% of the estimated 57 million Americans who have prediabetes are aware of their condition. 3
Multiple projects and efforts have been aimed at reducing hospital readmissions and fostering meaningful use. The Department of Health and Human Services-funded “Measure Development and Endorsement Agenda” includes measures for patient/provider communication, medication management (appropriateness and adherence), transitions (accountability, success/failure rates), having a medical home, appropriate and timely follow-up, effective care planning, and care coordination. 4
AADE is working to define the roles of different providers involved in the delivery of DSME/T, from community health workers to advanced health care providers. The National Committee for Quality Assurance and AADE are working together on performance measures that link diabetes educator interventions to improved outcomes.
Reduction of disparities
AADE emphasizes community outreach for DSME/T and coordination of care that includes community efforts. AADE's position statement on cultural sensitivity and diabetes education 5 recommends a model of care that focuses on the patient's cultural, ethnic, and socioeconomic variations and that matches interventions with individual patients served or with target populations.
Technology
The stated goals of “meaningful use” of the electronic health record (EHR) are to improve quality, safety, and efficiency; reduce health disparities; engage patients and their families through electronic communications; improve care coordination; ensure adequate privacy, security, and protection for personal health information; and improve population and public health through data collection and longitudinal quality data analysis.
AADE advances this goal by advocating for standardized data collection using the AADE7 System, 6 a diabetes education EHR with the ability to track outcomes. The dual aims of this system are (1) to utilize technology for information sharing among all parties involved in the care of people with diabetes, and (2) to provide population management data to health care providers, especially those associated with emerging models such as the patient-centered medical home (PCMH) and accountable care organizations (ACO).
Diabetes-Related Research
To better understand its economic impact, a study of federal spending on diabetes was undertaken in 2007. Results revealed that $79.9 billion more is spent on persons with diabetes ($1 of every $8 dollars in federal health spending) than on persons without diabetes. 7
A 2007 American Diabetes Association study estimated the indirect costs of diabetes including: increased absenteeism ($2.6 billion) and reduced productivity while at work ($20.0 billion) for the employed population; reduced productivity for those not in the employed population ($7.5 billion); and lost productive capacity resulting from early mortality ($26.9 billion). 8
In partnership with an actuarial firm (Solucia), AADE recently investigated the value of diabetes education in 3 domains: (1) behavior change, (2) clinical outcomes, and (3) economic (resources)/financial (dollars). The working hypothesis was that patients who participate in diabetes education have better clinical outcomes compared to those with similar risk profiles who do not participate in diabetes education. The data source was a substantial national claims database representing 20 million Medicare and commercial health plan members.
The results of Study Phase 1 (2009) showed that, in general, diabetes education does bend the cost curve in both commercial and Medicare populations (ie, the claims of patients who participate in diabetes education are lower than those of a matched cohort of patients who do not participate in diabetes education) (Fig. 1).
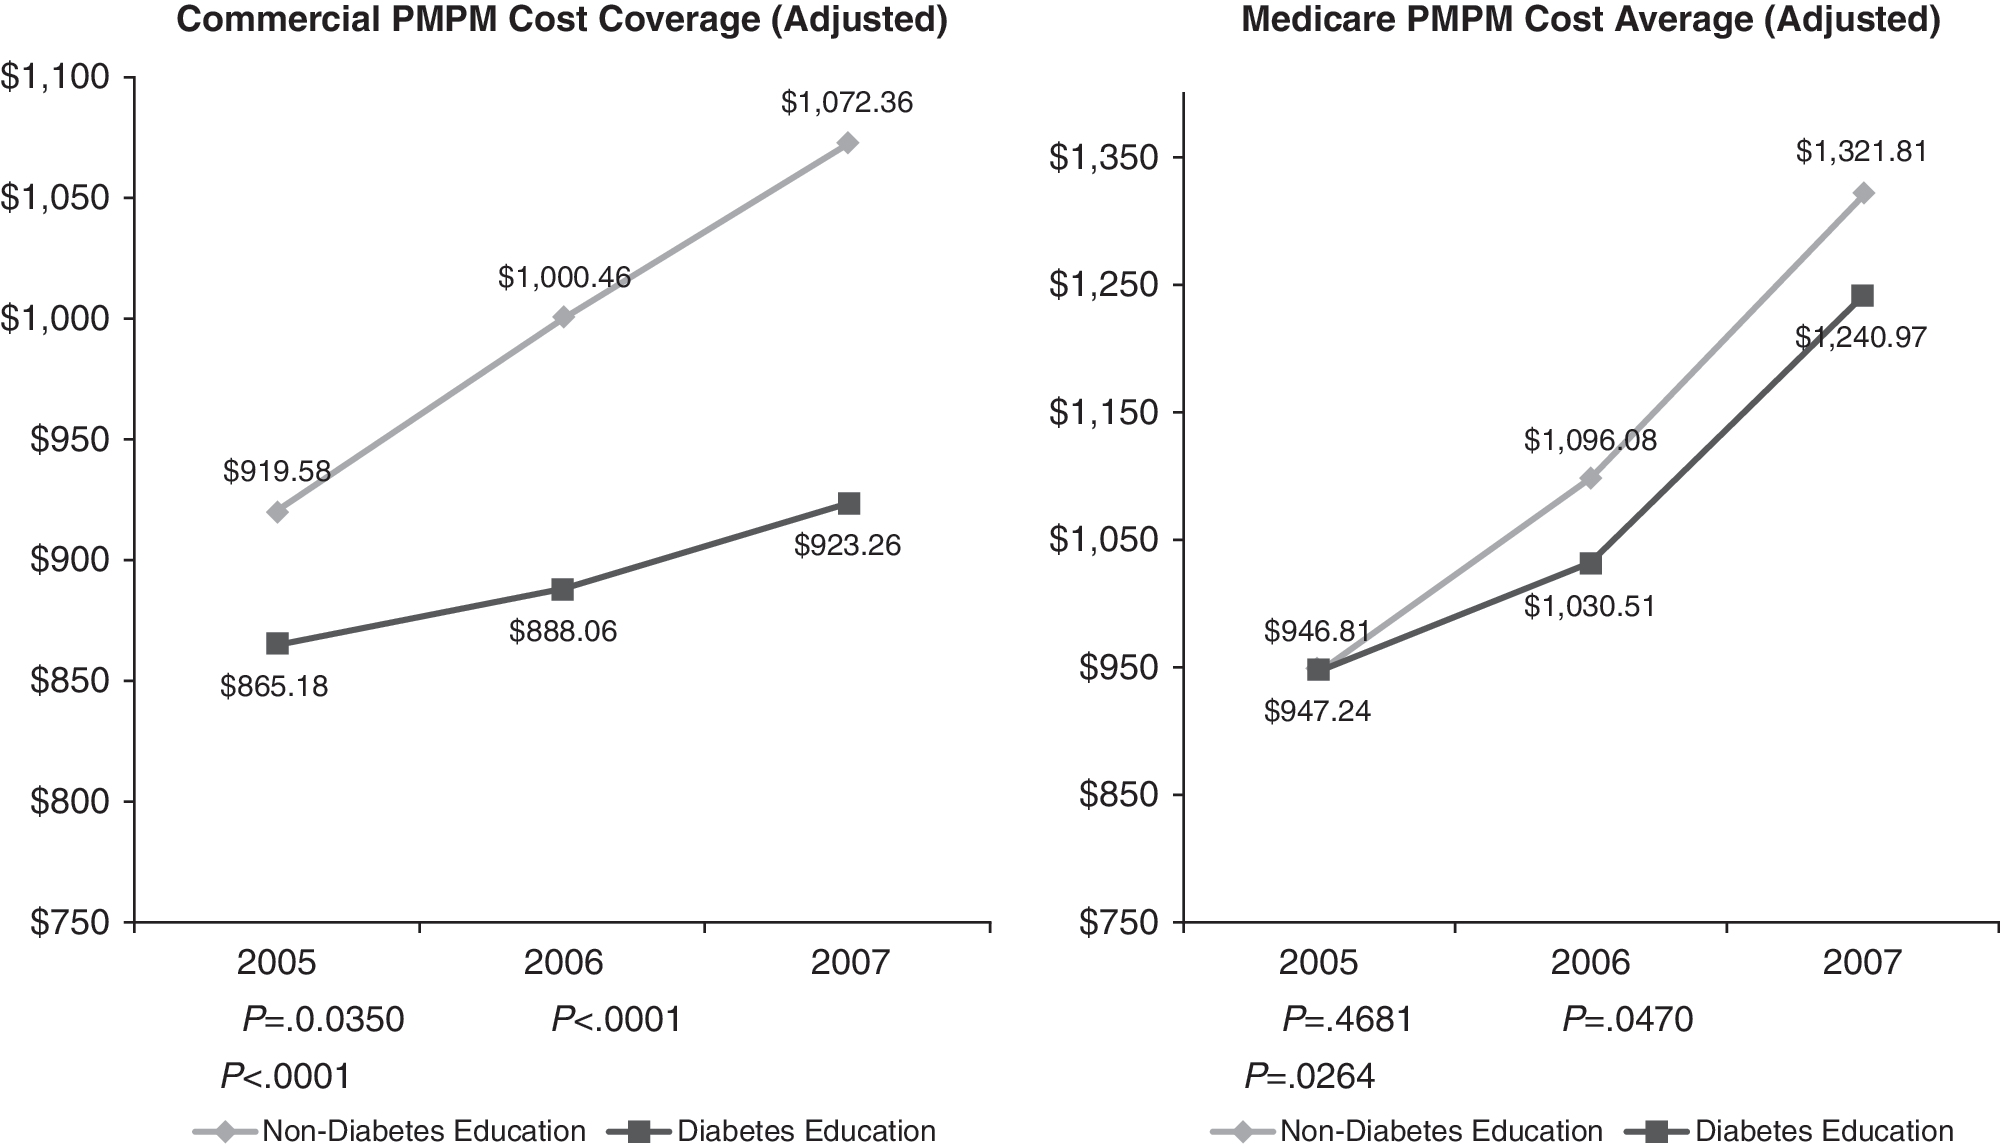
Results of study phase 1 results: costs of members with diabetes. “Value of Diabetes Education” study conducted by Solucia Consulting for the American Association of Diabetes Educators, 2009. PMPM, per member per month.
Study Phase 2 (2010) focused on diabetes education that is provided by diabetes educators only. Medicare pays for 1 hour of individual education and up to 9 hours of group DSME/T in the first year; 2 hours of group education is covered in subsequent years. One additional year of claims data was analyzed for patients continuously enrolled over the 4-year period.
A dose-response analysis looking at compliance with medications sought to answer the question, “Is more diabetes education better than less?” Preliminary (unpublished) results show that, although the number of provider encounters increased, diabetes education (by diabetes educators) reduced the cost of diabetes care over a 4-year period. In particular, hospital readmissions decreased. Moreover, the increased diabetes education was associated with increased compliance with prescribed medication regimen.
These results are consistent with those from the Study Phase 1 (ie, diabetes educators contribute to improved outcomes). Similarly, people with diabetes who receive education are likely to show lower utilization patterns compared to the control group. People with repeat diabetes education encounters are more likely to adhere to diabetes standards of care. People with diabetes who received ≥ 2 years of diabetes education demonstrate a higher level of adherence to medication regimens than those who did not receive diabetes education.
Promotion of Patient-Centered DSME/T
PCMH and ACO are 2 widely discussed models with complementary approaches to the health care delivery system. The PCMH model emphasizes the creation of a strong primary care foundation for the health care system. The ACO model emphasizes the alignment of incentives and accountability for providers across the continuum of care. Both of these models focus on meeting the needs and preferences of patients.
AADE efforts to help promote patient-centered DSME/T include: Advancing the promotion and provision of education in nontraditional places. Advocating for inclusion of diabetes education on coordinated care teams because patient education and assistance with self-care expand the reach of physicians and help reinforce their recommendations. Advocating for patient involvement as partners in the delivery of DSME/T. Ensuring that patients with diabetes receive well-coordinated diabetes education and care during transitions across all providers in all settings.
Currently, 90% of diabetes care is delivered by primary care providers (PCPs), often without the involvement of a qualified diabetes educator. 9 PCPs typically provide advice on risk reduction rather than training in diabetes self-management. 10 In all diabetes-related primary care visits, only 14.3% include diet or nutrition counseling, 10% include exercise counseling, and a mere 3.6% include weight reduction counseling. Moreover, fewer than 33% of Medicare beneficiaries use the Medicare benefit for DSME/T. 11
In addition to other efforts directed at providing patient-centered DSME/T, AADE is advocating for 2 diabetes education delivery models: (1) the traditional, hospital-based model (ie, outpatient/ambulatory) and 2) the nontraditional, community-based model (ie, where patients live and work— churches, pharmacies, physician practices, YMCA/HA).
For some time, data compiled by the Dartmouth Atlas have demonstrated that costs are inversely related to quality (ie, the more a state spends on health care, the less measurable quality is achieved). 12 The 2003 Medicare Claims data also reveal that the more specialists there are in a region, the higher the spending. Conversely, greater numbers of general practitioners in a region are associated with less spending. 12
While the details of health care reform continue to be debated, one thing is eminently clear. A robust system of primary care is the foundation upon which everything else is built. This renewed emphasis on primary care is being driven by the urgent need to slow the rate of medical inflation and improve value for the health care dollar. Unquestionably, primary care is critical to increasing value.
In recent years, PCMH has emerged as the central model of primary care design, with the major impetus coming from the states (ie, Medicaid programs) and commercial payers. The Patient Centered Primary Care Collaborative, an advocacy organization made up of providers and large employers, reports that there are 27 multi-stakeholder and other PCMH pilot programs operating in 18 states. Moreover, 44 states and the District of Columbia have passed over 330 laws pertaining to PCMH and/or have PCMH activity. The Centers for Medicare and Medicaid Services is actively involved in PCMH demonstration projects also.
PCMH Defined
Adopted in February 2007, the following Joint Principles of the PCMH were written and agreed upon by 4 PCP organizations (the American Academy of Family Physicians, the American Academy of Pediatrics, the American College of Physicians, and the American Osteopathic Association): (1) an ongoing relationship with a personal physician, (2) physician-directed medical practice, (3) whole person orientation, (4) coordinated care across the health system, (5) promote and ensure quality and safety, (6) enhance access to care, and (7) payment recognizes the value added by PCMH services.
The hallmarks of a PCMH include:
Superb access to care
Easy access to appointments with patient selection of date and time
Short waiting times at appointments
E-mail and telephone consultations available
Off-hour services available.
Patient engagement in care
While there is no single “right way,” PCMH providers assure that: Patients have the option of being informed and engaged partners in their care Practices provide information on treatment plans, preventive and follow-up care reminders, access to medical records, assistance with self-care, and counseling.
Clinical information systems
More than information technology in isolation, clinical information systems for PCMH must support: High-quality care Practice-based learning and quality improvement Maintenance of patient registries Monitoring of adherence to treatment Easy access to laboratory test results Generation of patient reminders Clinical decision support and information on recommended treatments.
Care coordination
PCMH providers coordinate specialist care and assure that systems are in place to prevent the kinds of errors that occur when multiple physicians are involved. Follow-up and support are provided, particularly with respect to mental health conditions.
Team care
Team care is vital to the PCMH. Integrated, well-coordinated team care depends on the free flow of communication among physicians, nurses, case managers, and other health professionals including behavioral health specialists in order to ensure that therapies are received as prescribed and that duplication of tests and procedures is avoided.
Patient feedback
PCMH patients routinely provide feedback to doctors. Many PCMH practices take advantage of low-cost, Internet-based patient surveys to learn from patients and inform treatment plans.
Publicly available information
Patients have accurate, standardized information about physicians to help them choose a practice that will meet their needs. Pilots programs often have fallen short in this area (eg, prospective patients do not understand the difference between a PCMH and a traditional primary care practice).
While inclusion of nurse practitioners in PCMH is broadly endorsed by most medical professional organizations representing various specialty groups, there continues to be heated debate in the specialist community because of concerns that the increased focus on primary care may shift the status and remuneration of specialists.
Health policy experts and legislators must understand that the “medical home” is fundamentally different from usual care, and a PCMH cannot be created and sustained without a meaningful change in payment to PCPs. The contrasts in care are listed in Table 1.
PCMH, patient-centered medical home; HIT, health information technology.
Ecology of Primary Care Practices
We have entered an era of change in the ecology of medical care. Currently, most visits for common serious conditions are made to a PCP whose practice infrastructure is likely to be a small, relatively independent practice. The typical practice consists of 2–5 clinicians, with fewer than 3 nonclinician nursing and clerical staff per PCP. Most practices have a hierarchical management structure, with physician-owners and office managers providing oversight. 13, 14
Such physician practices are permeated with stress and overwork. Most practices work on the margins of financial viability with little time for self-reflection, and little or no training in quality improvement and organizational management. This is the reality; now these practices are being asked to become PCMHs. 15, 16
Project evaluators for “TransforMed,” the largest national demonstration project of primary care transformation performed to date, 17 concluded that “ … primary care practices in the US need external resources to successfully undertake the magnitude of redesign envisioned in the PCMH.” 18 In other words, the model can be disseminated, but only with adequate time and resources. A potential payment model for PCMH is under consideration. Options include fee for service (FFS), payment for case management (above and beyond FFS), a pay-for-performance incentive, and support for preventive care outreach.
The well-studied Geisinger Model offers incentives to PCPs who achieve certain diabetes outcomes and provides a health system-subsidized case manager in every practice. In addition, the health system manages preventive care services centrally (ie, the health system identifies patients who are not up-to-date with cancer screening and immunizations, and writes and/or calls patients encouraging them to obtain these services or to come in for visits).
8 “Easy” Steps
Applying the PCMH model to diabetes care from the PCP's perspective
1.
Although it is an enormous and constant challenge, the supply of appointments must be sufficient. In addition to extending the capacity of telephone and/or e-visits, practices might consider advanced access or open-access scheduling (ie, keeping appointments frozen until 24 hours before the date). For example, Jefferson Family Medicine Associates (JFMA) lowered its “no-show” rate from 23% to 14% overnight by instituting such a system. JFMA schedules 150 patients per day—and each patient calls within 24 hours of the visit date.
2.
Data elements in a diabetes registry include patient identifiers (eg, name, birth date), intermediate outcomes (eg, hemoglobin A1c [A1c], low-density lipoprotein [LDL], high-density lipoprotein, triglycerides, microalbumin, creatinine, blood pressure), process measures (eg, eye exam, foot exam), immunizations (eg, influenza, pneumonia), and other therapies (eg, angiotensin-converting enzyme, angiotensin receptor blocker, aspirin).
3.
4.
5.
Meaningful use accredited EHRs have reminder capacity. Stand-alone primary care EHR products also issue automatic reminders. Insurance companies use software that can issue reminders (eg, NaviNet).
6.
7.
Can every practice afford a case manager? Probably not, but most practices can probably find a partner—a hospital (ACO), an insurer (by showing that the practice's patients are costing them money), an employer (particularly when 1 or 2 large employers dominate in a region), or the state or federal government (eg, Medicaid or Medicare pilot programs).
8.
PCMH Transformation—A Work in Progress
With 75 thousand patients, JFMA has the distinction of being the largest single site practice in the country. JFMA uses Diabetes Information to Support your Heath (DISH), a multidisciplinary group-visit model, to manage the care of patients with diabetes.
During DISH visits, typically held every Friday, each patient receives individual attention (a “visit”) and a group experience with a certified registered nurse practitioner/certified diabetes educator, a pharmacist, resident physicians, medical assistants, and a case manager.
Recently, a Masters of Public Health student conducted an evaluation of DISH as a capstone project. Patients in DISH (n = 52) were compared with matched controls (n = 236). The patients in DISH are predominantly female, African American, at least 45 years of age, obese, below 200% of the Federal poverty level, and taking oral antidiabetic medications.
A1c values declined 76.9% in the DISH group, while the comparison group's values declined 54.3%. Similar differences were noted in blood pressure and LDL comparisons (Fig. 2).
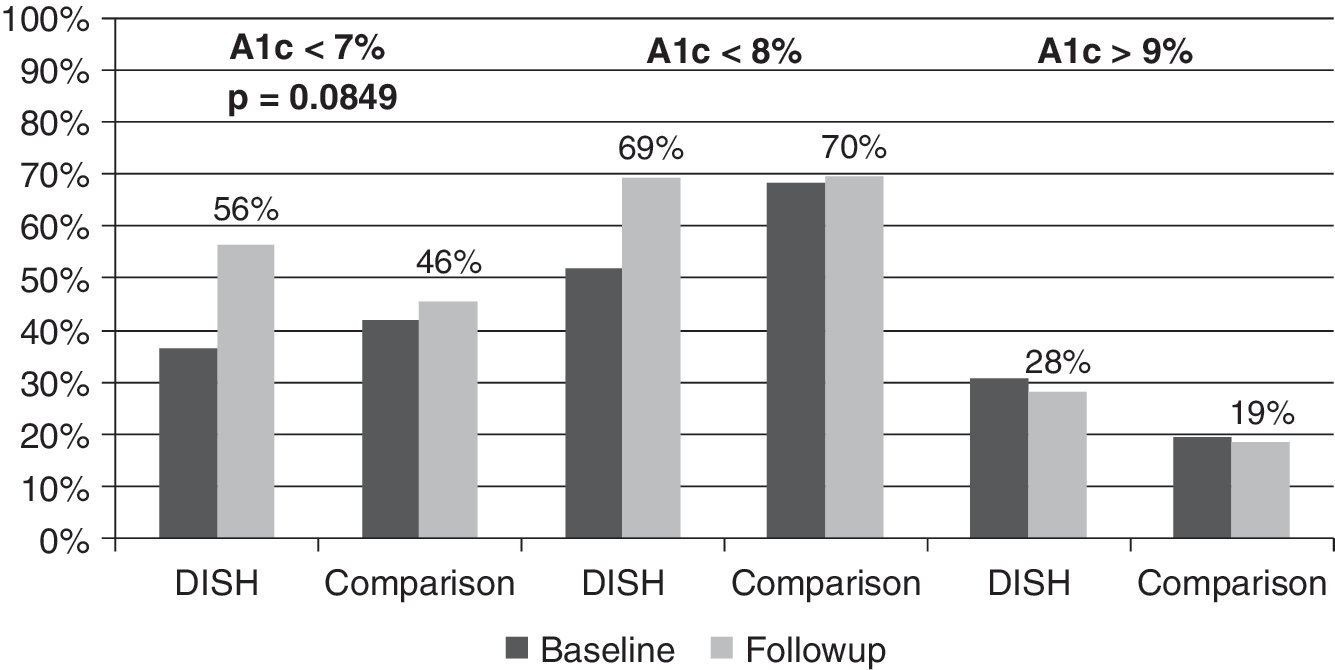
A1c values in DISH and comparison groups. DISH, Diabetes Information to Support your Health.
In addition, JFMA hired a quality coordinator. Using the Independence Blue Cross–Keystone Health Plan East Practice Quality Assessment Score as a measure, some physician performances fell short of the peer average score at baseline. Within a year, 100% of physician performances were at or above the peer average score (Fig. 3).
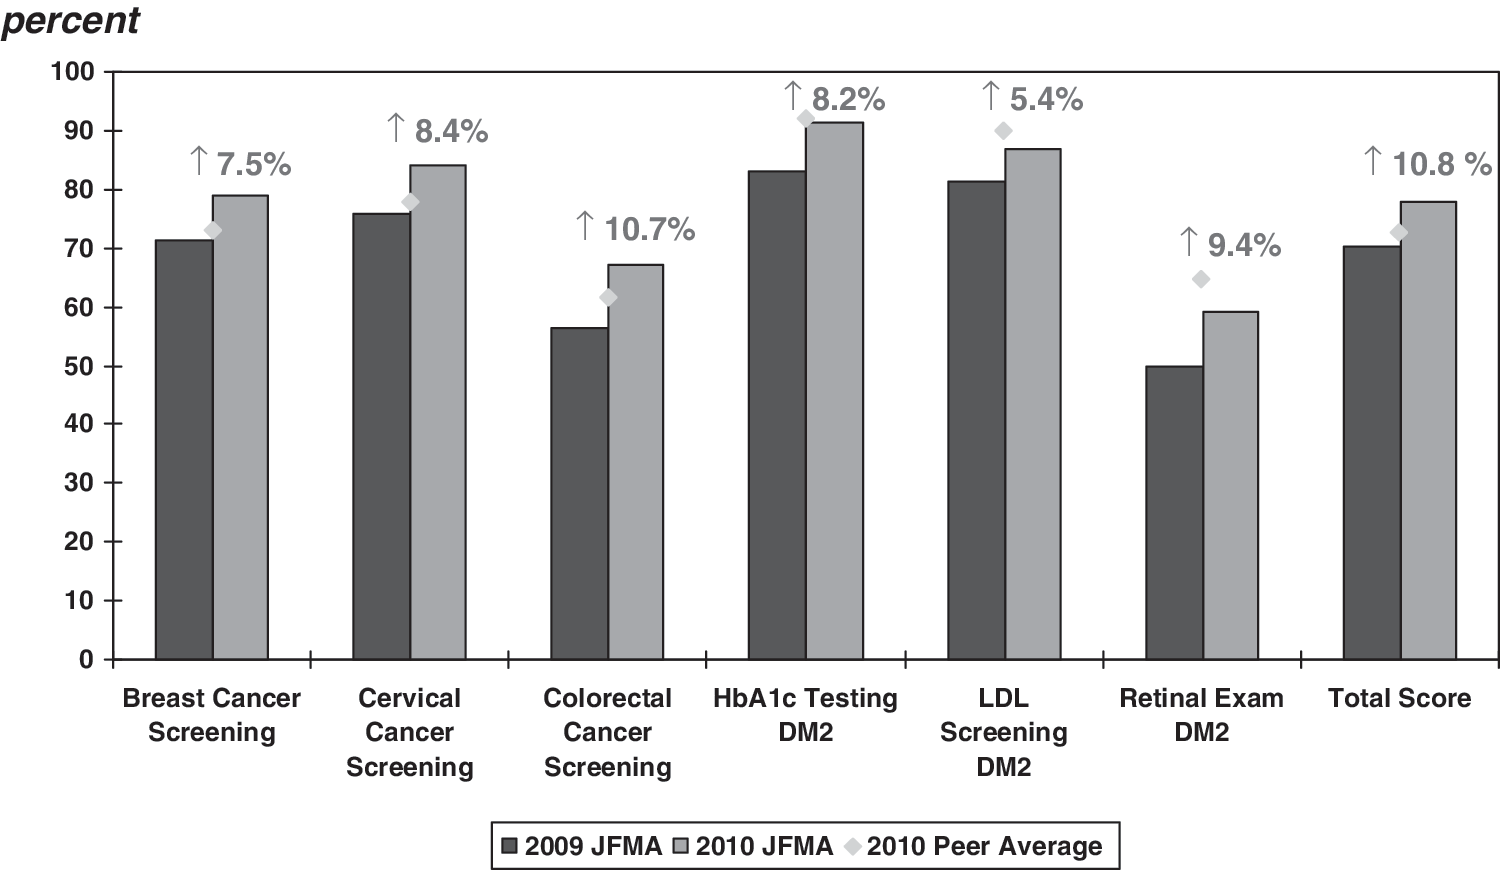
JFMA practice quality assessment scores. JFMA, Jefferson Family Medicine Associates; DM2, type 2 diabetes mellitus; LDL, low-density lipoprotein.
The characteristics of a quality practice include leadership that demands performance, a culture of quality and pride in the service provided, a willingness to try new things, a commitment to measuring what you do, appropriate use of technology, and investment in necessary change.
“Pearls of Wisdom” for Practice Transformation
Make up your mind to improve and understand that you must be relentless. Improving quality is hard work.
Recognize that success is not just about money. Create a value-driven practice that puts outcomes first, and be willing to invest.
Measure the right things; for example, patients who achieved target A1c (rather than how many A1c's were done), percent of eligible patients successfully screened, and percent of smokers who quit.
Report your results. If there is no EHR, measure and report just a few outcomes (eg, audit the medical records of 5 patients with diabetes, 5 women older than age 50, and 5 men older than age 50).
Be willing to try lots of things because no single idea will address every obstacle to care. Among the things we have tried at JFMA are: Using resident “moonlighters” to contact and encourage patients with diabetes to get their eyes examined and their blood work checked. Implementing a DISH group visit project. Using medical assistants to track test results and perform foot exams. Initiating open-access scheduling Incorporating quality care coordinators and pharmacists into the practice. Using CareNow mental health services to reach out to people who do not come in for visits and to case manage high utilizers.
Finally, people make a “home,” not technology. Value your entire team. Create a joyful practice and have fun trying new things. Measure to see if what you do works. Those in solo practices can compare results with physicians in someone else's practice or find ways to partner with a hospital or a group practice.
Now is our time and, perhaps for the first time since the 1990s, the country is watching.
Moderator
Panelists
We need a system to identify predictors and guidelines that flow from evidence. Measurement tools must be applied sensibly.
Patient-centered health research is vital to health reform because it can help us narrow the variation that currently exists in health care delivery. In situations where the right thing to do is well established, physicians from high- and low-cost cities make the same decisions, but in cases where the science is less clear, some physicians order the maximum possible amount of testing and procedures and some order the minimum. In one uncertain case after another, “more” is not necessarily “better.”
The disparate growth in per capita Medicare expenditures over time is obvious when we look at Medicare expenditures for 2 different communities with identical socioeconomic status in the same region: El Paso, Texas (national average) and McAllen, Texas (same outcomes but higher costs). Why does this happen when we have guidelines?
For an answer to this question, researchers looked at the quality of the evidence used by the National Comprehensive Cancer Network, which established 10 guidelines for specific malignancies: breast, prostate, lung, colorectal, melanoma, lumphoma, kidney, pancreas, bladder, and uterus. 19 When the evidence was categorized into (I) high-level evidence (ie, randomized controlled trials with uniform consensus), (IIA) lower level evidence with uniform consensus, (IIB) lower level evidence without uniform consensus, and (III) any level of evidence with major disagreement, there was a preponderance of “III's.” Regardless of the specific malignancy, guidelines are being driven by expert opinion rather than data. Similar research has shown this to be true of other guidelines, such as those for cardiovascular conditions.
Using a cellular biology analogy, the evidence is in the extra cellular space and disease management resides in the cell's nucleus while decisions regarding funding are made by low-affinity receptors. The result—reflected clearly in current practices—is that the identified gaps in the evidence are slow to diffuse into the academic community and individuals who should be included (ie, providers, patients) are not involved.
The obvious policy issue is the need to generate new data on what works best for whom under what circumstances, and quite a bit has been accomplished toward this end since the American Recovery and Reinvestment Act of 2009 earmarked $1.1 billion for patient-centered health research; namely: The Federal Coordinating Council for Comparative Effectiveness was established. An Institute of Medicine (IOM) Report was commissioned. Reports from IOM and the Council were delivered (June 30, 2009). Requests for applications from the National Institutes of Health (NIH) and Agency for Healthcare Research and Quality (AHRQ) were announced and are under review. Recently enacted health reform legislation allocates $200–$300 million per year for 10 years. NIH ($400 million) and AHRQ ($300 million) grants are dedicated to comparative effectiveness research (CER). Patient-Centered Outcomes Research Trust Fund—Contributions to this fund will include general revenues, amounts from the Medicare Trust Funds phased in at $2 per beneficiary annually, and amounts from a $2 fee per-covered-life assessed annually on insured and self-insured health plans. Five years after enactment, total funding for the Institute will reach nearly $600 million.
The IOM Committee on Comparative Effectiveness Research Prioritization defines and describes CER as follows: “The generation and synthesis of evidence that compares the benefits and harms of alternative methods to prevent, diagnose, treat, and monitor a clinical condition or to improve the delivery of care. The purpose of CER is to assist consumers, clinicians, purchasers, and policy makers to make informed decisions that will improve health care at both the individual and population levels.”
The guiding principle of CER is the concept of the value of information (VOI). VOI is the difference between the value of the outcome given the decision one would make in the absence of additional information and the value of the outcome of the decision that one would make as additional information became available as a result of research.
VOI can be calculated by using specific inputs:
Choice to be made: identification of the relevant set of alternatives to be compared.
Value of outcomes: construction of an outcome measure to compare benefits across interventions.
Potential findings of research: characterization of how the additional research might change the uncertainty of the outcomes of an intervention.
Probability of a change in choice: prediction of the probability that clinical choices will change in response to research results.
CER Methods
CER methods include systematic reviews of existing research, decision modeling with or without cost information, retrospective analysis of existing clinical or administrative data, prospective nonexperimental studies including observational epidemiologic studies and registries, and experimental studies including randomized controlled trials (RCTs).
Table 2 compares and contrasts efficacy and effectiveness trials. RCTs are more likely to be efficacy trials while patient-reported outcomes are more likely to be effectiveness trials.
FDA, Food and Drug Administration; RCT, randomized controlled trial; QoL, quality of life
Introduced in 1967, the concept of pragmatic clinical trials begs the question, “Should one prefer the goal of immediate applicability with a sacrifice of true understanding, or the more distant goal
Researchers may choose a pragmatic design if the study outcome is relevant to patients and if the outcome has little mechanistic importance. This design is often applied in heterogeneous populations with comorbidities. Outcomes are chosen on the basis of clinical relevance and generalizability to the population.
Adaptive trials are those that can change based on prospective rules and the accruing information. Sample sizes, randomization, and accrual rates are typically adaptive. Other adaptive elements include drop/reenter arms or dose groups, combination therapies, stop early for success or terminate early for futility, response to subpopulations, and adaptive borrowing of information. All phases of development can be combined seamlessly.
All methods have a role in CER, and the nature of the research question and the identity of the decision maker will influence best practices. There is an inevitable trade-off between internal validity and feasibility, generalizability, cost, and time. Individuals and organizations that insist that all interventions need validation by RCT need to do a bit of reality testing. A British Medical Journal article, titled “Parachute Use to Prevent Death and Major Trauma Related to Gravitational Challenge: A Systematic Review of Randomised Controlled Trials,” aimed to dispel this lofty notion. 21
To date, the IOM has culled 23,000 nominations for CER projects, and diabetes is one of the primary research areas. The first round of NIH funding will focus on systematic reviews to identify research gaps and to determine the direction of future projects. Donald M. Berwick, MD, MPP, the administrator for CMS, is expected to make the Medicare database available for data mining aimed at determining what works for whom. The list of potential nonexperimental studies and epidemiological trials is practically inexhaustible. The following are some examples: Compare the effectiveness and cost-effectiveness of conventional medical management of type 2 diabetes in adolescents and adults versus conventional therapy plus intensive educational programs or programs incorporating support groups and educational resources. Compare the effectiveness of comprehensive care coordination programs, such as the medical home, and usual care in managing children and adults with severe chronic disease, especially in populations with known health disparities. Compare the effectiveness of ACOs and usual care on costs, processes of care, and outcomes for geographically defined populations of patients with 1 or more chronic diseases. Compare the effectiveness of different benefit design, utilization management, and cost-sharing strategies in improving health care access and quality in patients with chronic disease (eg, cancer, diabetes, heart disease). Compare the effectiveness (including resource utilization, workforce needs, net health care expenditures, and requirements for large-scale deployment) of new remote patient monitoring and management technologies (eg, telemedicine, Internet, remote sensing) and usual care in managing chronic disease, especially in rural settings. Compare the effectiveness of traditional behavioral interventions versus economic incentives in motivating behavior changes (eg, weight loss, smoking cessation, avoiding alcohol and substance abuse) in children and adults. Compare the effectiveness of strategies to enhance patients' adherence to medication regimens. Compare the effectiveness of different disease management strategies for activating patients with chronic disease. Compare the effectiveness of shared decision making and usual care on decision outcomes (treatment choice, knowledge, treatment preference concordance, and decisional conflict) in children and adults with chronic disease (eg, stable angina, asthma). Compare the effectiveness of patient decision-support tools for informing diagnostic and treatment decisions (eg, treatment choice, knowledge acquisition, treatment preference concordance, decisional conflict) for elective surgical and nonsurgical procedures, especially for patients with limited English language proficiency, limited education, hearing or visual impairments, or mental health problems. Compare the effectiveness of alternative redesign strategies (eg, use of decision-support capabilities, EHRs, and personal health records) for increasing health professionals' compliance with evidence-based guidelines and patients' adherence to guideline-based regimens for chronic disease.
The Integrated Benefits Institute (IBI) is a national, nonprofit membership organization with more than 550 corporate sponsors, 85% of which are employers. IBI's mission is to demonstrate the business value of a healthy workforce through independent health and productivity management (HPM). HPM research advances this goal by developing measures, models, and tools and by providing a forum for sharing ideas and experience.
In response to a variety of new employer realities, more companies are being led by employers who focus on the whole employee – from identifying risks to managing conditions. These companies tend to be more successful in both human and financial terms. Because of their vested interest in improving the value of the health benefits they purchase, companies have begun to seek more control over their employee wellness programs.
At the policy level, health care reform measures look beyond the cost of health care to the value of a healthy workforce. Attempting to control claims costs in separate program silos is a “dead end.” The best strategies are those that aim to improve workforce health, reduce lost time, and enhance productivity.
IBI research conducted a series of surveys with chief financial officers (CFOs) to understand how they view investments in health and productivity (Fig. 4).
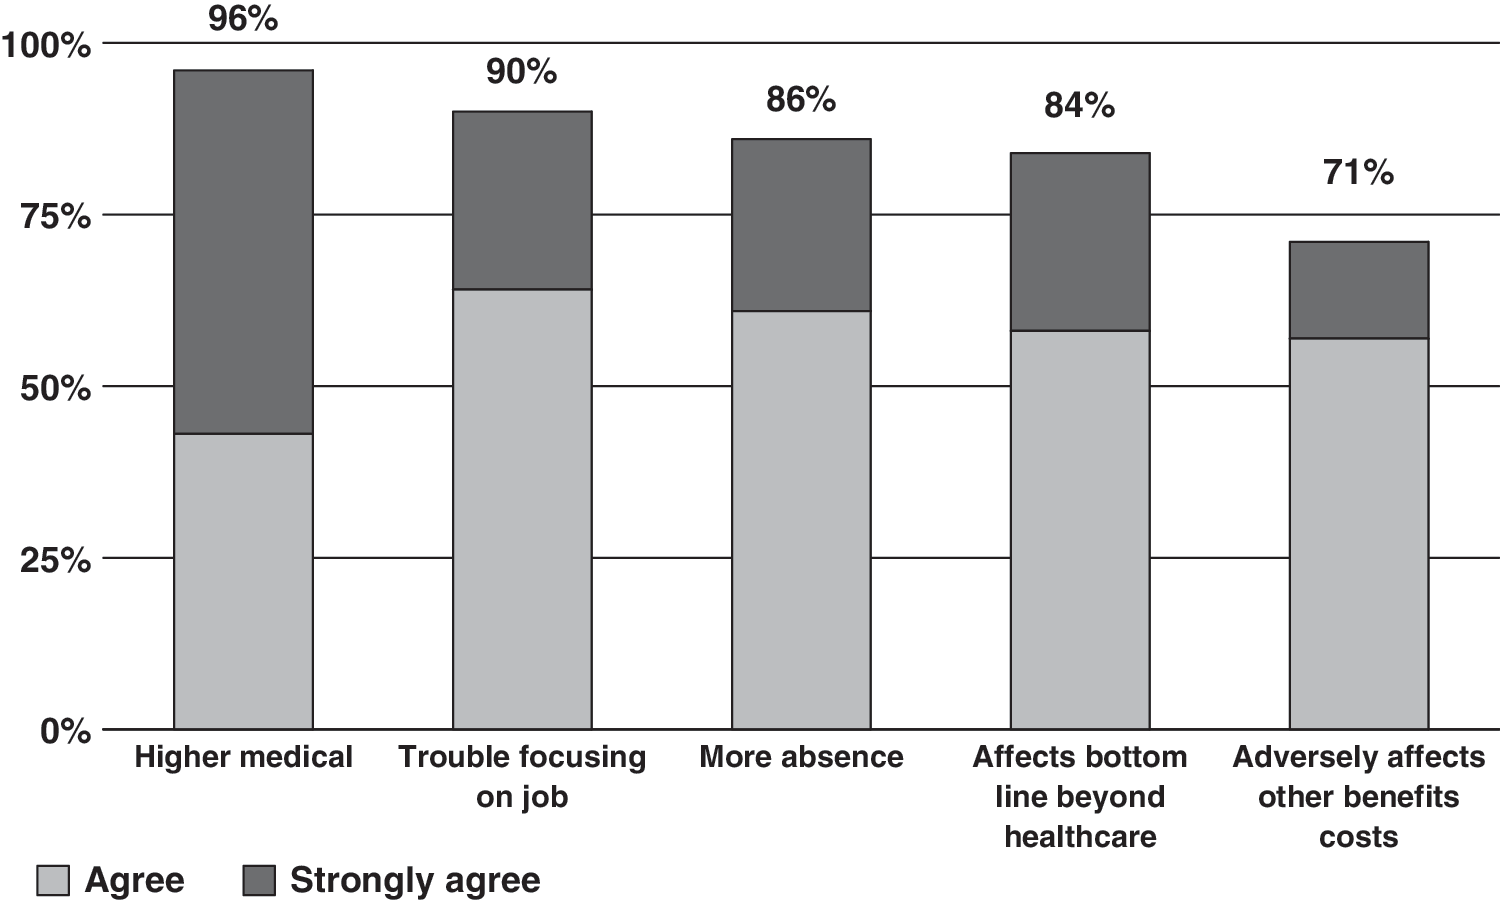
CFO perceptions of the impact of ill health. CFO, chief financial officer. Used with permission from The Business Value of Health: Linking CFOs to Health and Productivity. IBI, 2006.
When CFOs were asked how much they think employee health is related to the bottom line, 61% responded, “Strongly linked,” and only 5% responded, “Weakly linked.” However, when asked about the connection between the health benefit program and the company's financial performance, only 25% of CFOs perceived a strong link.
Are CFOs getting sufficient information? Regarding employee absence, responses indicated that only 51% ever receive reports on the occurrence of employee absence, and a mere 22% receive reports that translate absence data into financial terms. Even less information is communicated with respect to presenteeism. Responses indicated that only 22% ever receive reports on the occurrence and a mere 8% receive reports on the financial impact of presenteeism.
IBI helps employers to measure lost productivity and the effect of employee absences on their businesses. Lost productivity costs are a function of the employer's ability to replace workers, the time value of worker output, and the degree of teamwork involved. The cost of absence is computed in terms of the daily wage.
Replacement of an absent employee decreases capacity. In certain positions, team member work is affected. For example, when a restaurant's fry cook is absent, he or she is easily replaced, but when a legal assistant is absent, he or she is more difficult to replace, reducing the productivity of attorneys and team members.
A new multiemployer research study, Health and Productivity as a Business Strategy, encompasses 9 employer groups and utilizes 3 unique databases with 1.05 million medical claims, more than 413,000 pharmacy claims, and 346,000 employee self-reports via health risk assessment (HRA). The integrated database enables researchers to map pharmacy claims to medical claims, and self-reports to medical and pharmacy claims. When lost productivity data is included with medical and pharmacy data, it is of great value to employers (Fig. 5).
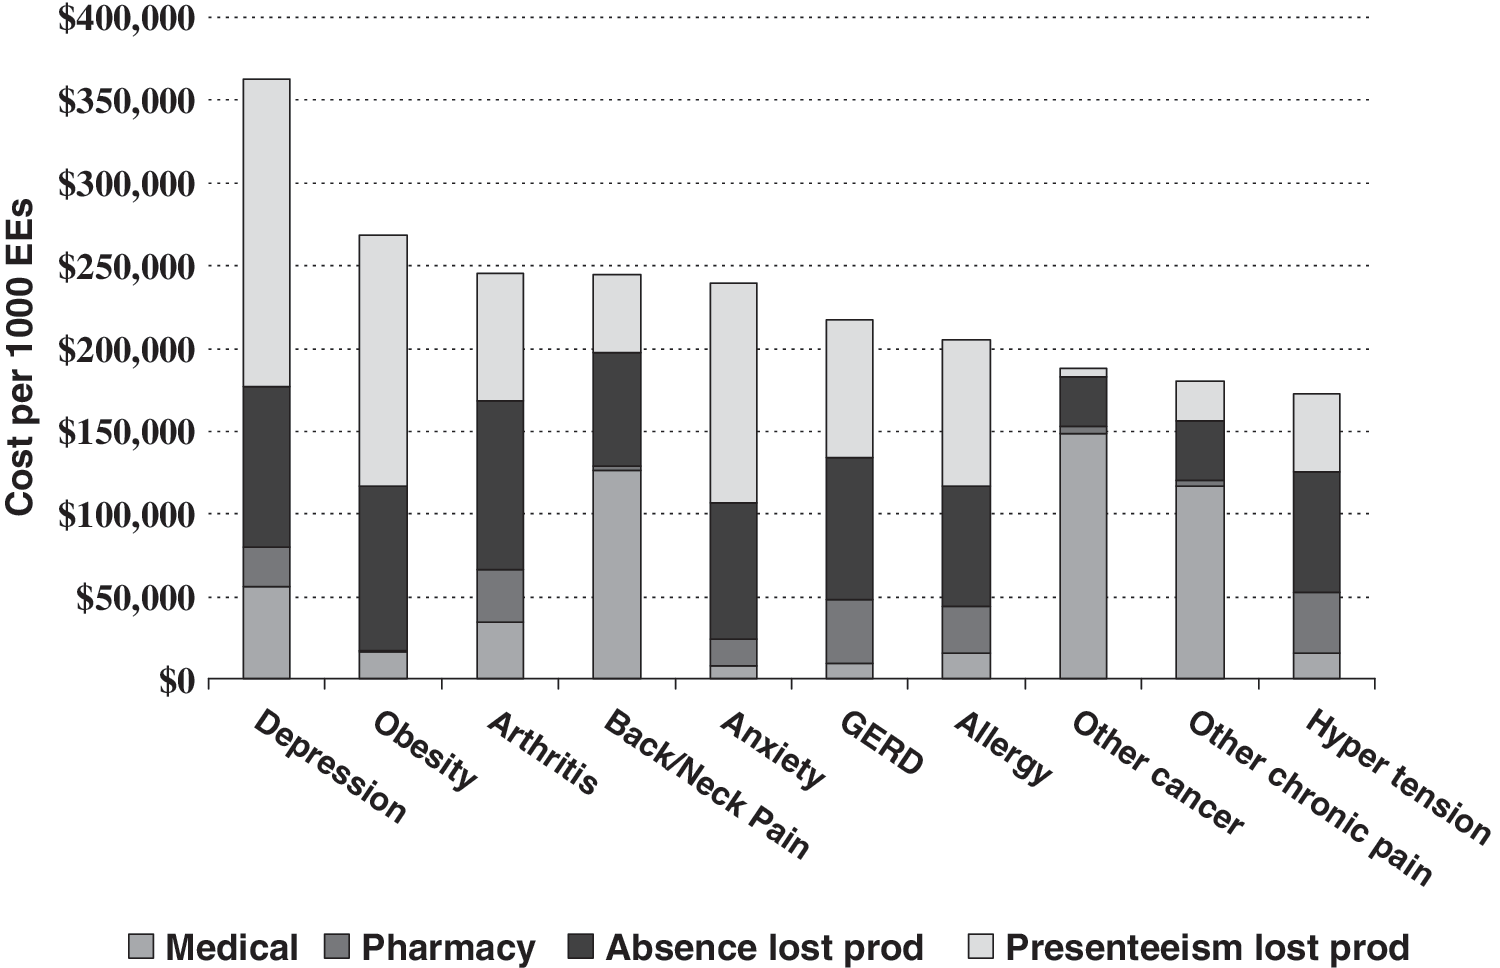
Full costs of select chronic conditions. GERD, gastroesophageal reflux disease.
Although IBI research into the impact of pharmaceutical plan design did not look specifically at diabetes, a study of another chronic condition—rheumatoid arthritis—was conducted. Results showed that if there is a known treatment and it is not recommended, the condition tended to appear earlier. Increased co-payments led to decreases in filling and refilling prescriptions, especially prescriptions for disease modifying drugs (ie, biologics).
A preliminary analysis of IBI's Health and Productivity Questionnaire (HPQ)/HPQ-Select database (self-reported survey data) sheds more light on issues related to diabetes. Self-reported survey data reveal that only 10.6% of respondents have diabetes without having at least 1 other chronic condition. Those who have diabetes only were more likely to be treated than persons with diabetes and comorbidities. Of particular interest to employers, job performance declines as comorbidity increases and persons in treatment have higher job performance.
A 2010 (preliminary) analysis of IBI's Benchmarking Database—the largest occupational database in the United States—clearly demonstrates the impact of diabetes and its complications on the employer's bottom line (Fig. 6). With earlier treatment, complications could be prevented or delayed, driving total costs down.
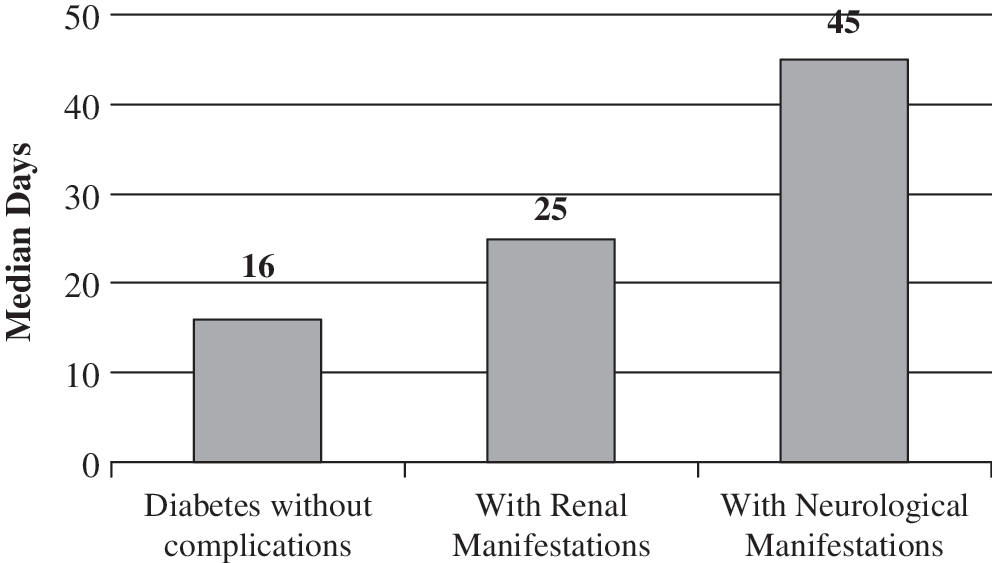
Calendar year lost workdays per active short-term disability claim. IBI Benchmarking Data, 2008.
As the 16th busiest hospital system in the nation and the largest private employer in the state of Delaware, Christiana Care Health System (CCHS) has a vested interest in the health of the population in the region. Mirroring similar systems across the country, its costs have escalated over the past decade, and CCHS is searching for ways to contain cost growth.
A chief premise of value-based insurance design is that costs to the patient should reflect the true value of medical care and services. Services with lower value (eg, cosmetic and other nonessential services) are associated with increased co-pays while cost barriers are eliminated for high-value services including essential medications. Although cost sharing has been an effective tool for containing costs, in essence it is a blunt instrument to decrease utilization and there is a real danger of decreasing appropriate use of high-value services.
Co-payment Elimination Program
Beginning with an 18-month pilot program (March 2009 through September 2010), CCHS implemented a co-payment elimination program. All employees and their dependents with diabetes were eligible, and co-payments were eliminated for all glycemia-related medications and supplies.
The overarching goal was to empower employees to take better care of their disease conditions and focus on staying healthy rather than being concerned about the cost of drugs to treat the condition. Chief aims of the program were to: (1) reduce the cost burden for members with diabetes, (2) increase adherence to medication regimens, (3) provide the opportunity to take additional medications, and (4) improve glycemic control.
Prior to program implementation, a standard 3-tier co-payment structure was in place (ie, 30-day supply of drug: $10/$25/$50 and 90-day supply of drug: $25/$63/$125). The Tier 2 and Tier 3 medications required prior authorization in accordance with pharmacy benefit management step-therapy guidelines.
In order to benefit from the zero co-payment program, employees were required to fulfill certain requirements including online registration; informed consent per the institutional review board; baseline survey completion (demographic data, diabetes complications and related comorbidities, self-reported medication adherence over previous week, cost-related nonadherence over previous year); baseline measurements (height, weight, A1c, LDL, blood pressure); and follow-up survey completion, measurements, and laboratory tests at 12 months.
Participants were identified and notified by BlueCross BlueShield of Delaware on behalf of CCHS. The program was publicized via an internal media campaign (eg, intranet, internal newsletter).
Baseline survey results and participant characteristics
Of 1000 participants invited, 242 registered online and 211 participated in the program. The self-reported data revealed the following comorbidity rates: 63.5% were obese, 57% had hypertension, and 60% had hyperlipidemia. Only 1 in 5 participants reported no comorbidities. The baseline self-reported process measures (ie, eye exam, foot exam, and A1c) were slightly higher than Healthcare Effectiveness Data and Information Set averages and self-reported clinical measures (eg, A1c values) were slightly lower. Cost-related nonadherence was more likely if the respondent was female, younger than 50 years of age, African American, earned less than $50,000 per year, and had a higher number of comorbid conditions.
12-month impact evaluation
An impact evaluation at 12 months revealed that 188 employees had completed all of the required self-reported data. Although there was no claims data for substantiation, participants reported improved adherence and taking more responsibility for their conditions, including blood pressure monitoring. Overall, there was a slight improvement in adherence to oral diabetes medications and the percentage of employees who reported missing at least 1 day of work the previous week decreased from 32% at baseline to 22% (P = 0.028). There was no change in reported insulin adherence.
Sixty percent of participants reported taking advantage of the opportunity to intensify their medication regimen (ie, take additional medications). However, there was no significant improvement in glycemic control.
Key lessons and implications
The bottom line is that, despite increases in self-reported adherence and decreases in reported cost burden, the co-payment elimination program appears to have had minimal clinical benefit. Limitations include uncontrolled pre-post program periods, a small sample size, and selection bias/ceiling effect.
Although the program decreased cost-related nonadherence, glycemic control is difficult to enforce without making difficult lifestyle choices. Adherence is not just about cost. Once cost-related underuse is eliminated, numerous other reasons for nonadherence must be addressed.
Although the clinical changes were not as substantial as anticipated, there is the potential to make a positive change in the health of the CCHS population. Next steps include a controlled analysis of adherence and costs, and implementation of employee disease management/wellness programs with linkage to an HRA. The goal is to impact rather than observe real-life care by strengthening linkages with PCPs and providing necessary financial and logistical support.
We stand on the threshold of a monumental transition—one in which we are moving beyond the traditional reactive system to a well-oriented proactive system. The likely impact of moving large numbers of people into healthier lives is more years of productive life.
Seventy percent of all deaths in the US are related to chronic illness, and health behavior can be linked to more than half of the causes of death 21 (Fig. 7). In simple terms, how we live dictates how we die.
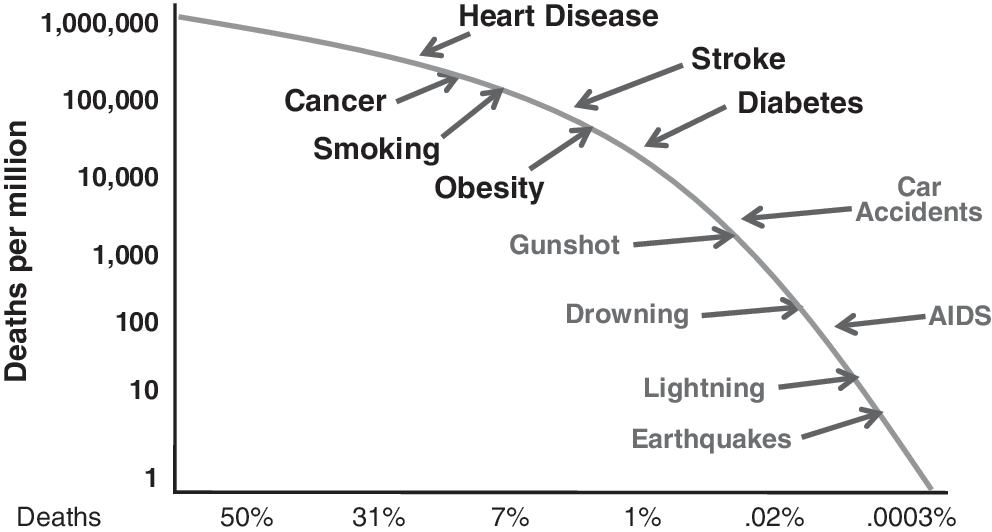
Relative risks by cause of death for persons born in the United States in 2004.
A prime illustration is what we now know about intra-abdominal fat and liver fat—the most critical fat deposits. Even modest weight loss drastically reduces intra-abdominal fat, liver fat, and multiple cardiometabolic risk factors simultaneously. Conversely, even small, incremental increases in a person's basal metabolic index heighten the risk for type 2 diabetes. 23, 24
The medical and pharmaceutical cost burden associated with chronic disease is just part of the story. For every $1 paid out by employers, another $2–$3 is lost from decreased productivity. 25 The full cost of poor health to employers is huge. Studies show that there is an additional productivity loss for each incremental risk factor. Conversely, a decrease in risk factors leads to a decrease in medical and pharmacy expenses as well as improved productivity. 26
The way forward is clear. As a society we must take action to translate knowledge into action. We must make sure that the focus of “health reform” is on “health.” To reduce health risks, we must develop and implement programs and interventions that target: Primary prevention (eg, healthy lifestyles, wellness programs) Secondary prevention (eg, screening, early detection and diagnosis of chronic conditions) Tertiary prevention (eg, earlier application of evidence-based condition management)
A recent study projected that appropriate application of these 3 levels of prevention could have an economic impact of $1 trillion annually. 27
“The Prevention Plan” (TPP)
One solution to reduce the burden of risk and illness is a clinical model of prevention—a high-tech/high-touch “prevention benefit.” U.S. Preventive Medicine's TPP is a bundled clinical model of prevention. It provides employers with tools to engage employees in taking responsibility for their personal health. Tools include assistance with implementing Worksite Wellness (a guide to creating a culture of health including posters and other visuals), and The Prevention Score. The Prevention Score, a scoring system with an HRA component, enables employees to track their progress toward prevention goals. Importantly, it also enables employers to align incentives and rewards with individual employees' health behavior and activity. Employees track progress toward prevention goals.
The “3 C's”— cash, communication, and culture
A cross-sectional study of HRA completion rates was conducted using multiple regression analysis. Of 882,275 employees (124 employers), 344,825 HRAs were completed. The monetary incentive for completion along with communication and organizational commitment were the strongest predictors of HRA completion rates. To achieve a 50% HRA completion rate, employers with a low communication/organization commitment level needed to offer a financial incentive of approximately $120. Employers with a high communication/organizational commitment level achieved the 50% completion rate with far less of a financial incentive—approximately $40. 28
Measurable impact of TPP on employer populations
Participation rates in TPP were evaluated for an eligible population across multiple employer groups. Effectiveness in improving health risks was assessed by looking at the impact of TPP on health risks at the individual and group levels. Health risks of 2606 persons were measured at baseline and after 1 year on TPP.
The cohort showed significant reductions in 10 of the 15 health risks measured; most noticeably, reductions in the proportion of employees with high-risk blood pressure (42.78%), high-risk fasting blood sugar (31.13%), and high-risk stress (24.94%) (Table 3). Of particular interest, an overall health risk transition was observed among the cohort, with net movement from higher risk levels to lower risk levels (P < 0.01). 29
HDL, high-density lipoprotein; TPP, The Prevention Plan.
Impact of wellness and prevention on the bottom line
Workplace wellness programs can generate savings. A recent study demonstrated that, for every $1 invested in a comprehensive wellness program, $6 is saved (ie, medical/pharmacy savings of $3.27 plus absenteeism savings of $2.73). 30
Employers with ongoing, highly effective health and productivity improvement initiatives have demonstrated superior financial performance (ie, yielded 20% more revenue per employee, shown a 16.1% higher market value, delivered 57% higher shareholder returns).
It is time for businesses to move beyond return on investment (ie, financial indicators) to the value of health investment (ie, net savings, shareholder value, indicators of participation, preventive screening, health risks, evidence-based medicine, health care utilization, and productivity in addition to financial indicators).
The battle for better health and against disabling conditions is being fought across the nation and in its workplaces. We already have the tools, technology, knowledge, and evidence base—what we need now is to heighten the priority.
Footnotes
Author Disclosure Statement
Ms. Clarke disclosed no potential conflicts of interest other than her employment with the Jefferson School of Population Health, which received funding from sanofi-aventis to produce this supplement.