
Abstract
The objective was to develop and validate a multilateral index to determine patient ability to pay for medication in low- and middle-income countries. Primary data were collected in 2009 from 117 cancer patients in China, India, Thailand, and Malaysia. The initial tool included income, expenditures, and assets-based items using ad hoc determined brackets. Principal components analysis was performed to determine final weights. Agreement (Kappa) was measured between results from the final tool and from an Impact Survey (IS) conducted after beginning drug therapy to quantify a patient's actual ability to pay in terms of number of drug cycles per year. The authors present the step-by-step methodology employed to develop the tool on a country-by-country basis. Overall Cronbach value was 0.84. Agreement between the Patient Financial Eligibility Tool (PFET) and IS was perfect (equal number of drug cycles) for 58.1% of patients, fair (1 cycle difference) for 29.1%, and poor (>1 cycle) for 12.8%. Overall Kappa was 0.76 (P<0.0001). The PFET is an effective tool for determining an individual's ability to pay for medication. Combined with tiered models for patient participation in the cost of medication, it could help to increase access to high-priced products in developing countries. (Population Health Management 2013;16:82–89)
Introduction
Another approach to increasing access to new drugs is to allow patients in the middle of the economic spectrum to pay part of their medication costs and to have the part they cannot afford covered through donation programs. This model should increase access by making the cost of life-saving or chronic medication affordable to a larger portion of patients. This is critical because these medications frequently are not offered to patients who can afford only 1 or 2 months of care. Additionally, a hybrid model that allows patients to cover a reasonable portion of their medication costs creates an incentive for drug manufacturers that helps to increase the availability of life-saving medications for those patients who truly cannot afford to pay out of pocket. This approach helps to increase access to care, which, in turn, should help to improve patient outcomes.
The challenge to deploying a tiered approach to patient payment of drug costs is determining the amount that each patient can afford to pay. Such stratification is dependent on accurately assessing a patient's ability to pay over a period of time that may last months or years. This may be particularly challenging in economies with seasonal variations in employment and spending. Moreover, although assessing patients' ability to pay for drugs requires an absolute measure of economic status, most assessment methods use wealth quintiles within a given population, which provides only a relative assessment of economic status.
A variety of direct (income, expenditure, and financial assets) and proxy (household durable assets, housing characteristics, access to utilities, and sanitation) measures have been used to determine socioeconomic position (SEP). 2 Although direct measurements are likely to provide a more accurate assessment of SEP, their use in developing countries is limited by the cost associated with collecting these data, the need for complex statistical analyses, seasonal variations in earnings, high rates of self-employment, potential recall bias, and false reporting. 3 Proxy measures that are assessed by direct observation may provide a more reliable determination of SEP, 2 although questions remain as to whether or not this is true in all settings. 2,4,5
Traditionally, income has been used as a primary indicator of financial status 6 ; however, informal and cash economies predominate in developing countries, making it difficult to accurately assess income. Expenditures (consumption) are often used as a proxy for income, but several factors limit the utility and accuracy of expenditures as an indicator of overall economic status. 6 Wealth (physical and financial assets minus debt) offers several advantages as an indicator of economic status compared with income or expenditures, 7 and represents a more permanent measure of economic status than either income or expenditures because it is less sensitive to transitory fluctuations. 3,6 Yet, in some settings it has been shown that data on the level and overall distribution of household wealth are much less common and less systematic than data on income and expenditures, 7 and the accuracy of any individual wealth index may vary based on the variables included, 3,7 and the weights and values assigned to questions and responses for specific indicators. Another concern about using asset-based methods to assess SEP is their inability to account for the short-term or temporary economic changes that are likely to occur in a household that is dealing with catastrophic health care expenses. 3,8 Subjective assessment of SEP also has been used as a metric for financial status, but respondents may manipulate this method to achieve a perceived benefit. 9 Participatory wealth ranking also has been evaluated in health studies, but has shown relatively low agreement with survey-based assessment methods. 10
Given the limitations of using income, expenditures, or wealth as a unilateral indicator of economic status, the authors have developed a novel financial eligibility index that combines data from all 3 indicators and incorporates the cultural, behavioral, and financial standards of individual countries. This index, the Patient Financial Eligibility Tool (PFET), has been developed and deployed in China, India, Indonesia, Malaysia, Pakistan, the Philippines, and Thailand. Here, the authors report the underlying conceptualization, development, and validation process of this index to demonstrate the potential utility of a multilateral index to determine economic status.
Methods
Selection of indicators
The PFET index was initially designed based on methods described in the literature that appeared most relevant to the goal of stratifying patients according to their ability to pay for specific products or services. 6,7,11,12 Thus, the PFET integrates metrics of both direct measurements (income and measures of expenditure) and proxy measures based on consumer durables and housing characteristics. The PFET was intentionally designed to include indicators that are sensitive to changes in income, consumption, and expenditures in order to account for the potentially dramatic changes in SEP that may occur in and affect the living standards of households with a severely ill patient.
The PFET includes several types of information related to income, consumption, expenditures, and assets (Table 1). In the PFET, monthly income was defined as household net income (minus taxes), plus 15% of the estimated monthly income of other members of the patient's economic unit. The economic unit comprises members and other close relatives living outside the household but likely to support the household because of cultural factors.
Ad hoc determination of brackets
The PFET is designed so that each answer to a specific question is given a defined unit value on a 6-grade Likert scale (from 0 to 5), corresponding to the number of drug cycles for which the patient was considered able to pay. The hierarchy of specific answers was determined and refined through ongoing consultation with local stakeholders and use of relevant and informative survey data, when available. For example, for a question about available transportation resources, a bicycle would be associated with the ability to pay for fewer cycles of drugs than a motorcycle, which in turn would be associated with fewer cycles than a car or truck.
In-country interviews and data from published national household surveys were used to refine each question category so that it accurately accounted for local cultural, behavioral, and economic standards, allowing for customization of the PFET on a country-by-country basis. These in-country interviews were undertaken with a variety of key stakeholders, including key opinion leaders, local health economists, social workers, insurers, government representatives, local product teams that sell the medication, bank representatives in charge of evaluating clients' financial situation before granting credits, representatives of non-governmental organizations that provide microfinance, and doctors.
Determination of weights
In order to determine the weights to be used for each indicator retained, the authors collected relevant data from a sample of 117 cancer patients who had completed the PFET in 4 test countries (China [n=40], India [n=28], Thailand [n=19], and Malaysia [n=30]) between May and October in 2009. These patients comprised all socioeconomic segments within these countries and reflect different levels of insurance coverage, income, and wealth. The questionnaire was administered to the patient (or a family representative depending on the patient's condition) in face-to-face interviews or by phone. No self-administration of the questionnaire was allowed. Phone or in-person interviews were conducted at the patient's dwelling or treating hospital and ranged from 30 to 60 minutes in duration. During the administration process the interviewer collected available documentation (eg, poverty card, proof of health coverage, verification of property ownership, financial assets) and completed the questionnaire. All patients were then offered the opportunity to participate in the tiered approach program. At this stage in the development of the PFET, classification of a patient's ability to pay for medication was determined using both the raw, unweighted version of the PFET and country-specific programmatic criteria.
At first, Principal Components Analysis (PCA) was used to determine the weights used for the final calculation of the score. Items available for all patients and used in the PCA were: vehicle, primary dwelling, financial assets, consumer durables, water source, cooking method, floor type, health care-related expenses/health insurance, and monthly expenses. The PCA technique is primarily used for data reduction and summarization, and it relies on the identification of uncorrelated principal components from an initial set of correlated variables. 8 The first principal component represents the linear combination of the original variables that explain the greatest proportion of the total variation. Weights are derived from the correlation matrix of the data and can be used to construct wealth indices that reduce the initial set of variables to 1 global score. Though designed to be applied to continuous, normally-distributed data, PCA performed with ordinal variables yields acceptable and comparable results as techniques that may be theoretically more appropriate, such as Multiple Correspondence Analysis (MCA) or PCA using polychoric correlations, provided that the exact estimation of the proportion of variance explained is not the primary objective. 9,13
Following PCA analysis, the results of the in-country interviews initially conducted to determine brackets were then utilized to refine the weight of each question and to determine ad hoc weights for additional items that were applicable to only a few patients (eg, additional property, business, hired help, education, rent expenses). Cronbach's alpha was then calculated in order to analyze the internal consistency of the variables retained in the index. A value higher than 0.7 is generally considered as an acceptable level of intercorrelation between the variables considered in the index, although it does not necessarily imply the absence of multiple underlying dimensions. 14
Final result calculation
For each question, the previously evaluated weight was multiplied by the unit value of the answer to calculate the weighted unit value for each response in the index. The weighted unit values were summed and divided by the number of applicable questions, yielding a score that corresponds to the final number of drug cycles payable by the patient. Scores were used to classify patients as able to pay the full cost of their medication, unable to pay for any portion, or able to pay for a specific number of cycles of medication. It should be noted that insurance reimbursement for the targeted drug, as well as cycles paid before inclusion in this study, and potential adverse economic circumstances experienced by the patients were all considered in determining a patient's final payment classification.
Income can be markedly affected by seasonal fluctuations and was considered to be the factor most likely subject to underreporting in the context of the PFET. As a result, this particular item was excluded from the overall analysis and considered instead at the very end of the classification process, by picking the highest result between the global score and the income.
PFET validation
In the context of the PFET, no straightforward gold standard was available to determine whether the final classification given by the tool was relevant. Indeed, the final score calculated by the means of the weights yielded by PCA may be considered as a latent variable representing the unobserved ability of the patient to pay for a certain number of drug cycles, for which no direct assessment method exists. To address this concern, a specifically designed Impact Survey (IS) was conducted a few months after the patient had bought their medication. The IS collected data from semi-qualitative interviews with the 117 individual patients who were included in the initial construction of the PFET and who had been classified using the raw, unweighted version of the tool. These interviews collected objective and subjective data, including changes in vehicle ownership, housing status, asset ownership, children's educational status, and ability or inability to continue to pay for cancer care (Table 2).
Information gathered through these interviews enabled the evaluation of potential positive or negative side effects resulting from the initial payment classification and provided insight into factors that might contribute to an under-, correct, or overestimation of a patient's actual ability to pay for medication. Based on the results of the IS, patients could be reclassified in order to better align their payment classification with their ability to pay for medication.
The score provided by the IS was considered to be the benchmark for determining patient payment classification. Using weighted Kappa statistics, the IS score was compared with the score obtained when the final version of the PFET was retrospectively readministered to all 117 patients. Kappa scores ranged from −1 (inverse agreement) through 0 (no agreement) to +1 (perfect agreement). 15 For ordinal data, the use of weighted Kappa makes it possible to consider the importance of the difference (eg, difference between a score of 0 and 1 is not equivalent to a difference between 0 and 2, 3, 4, and 5). 15 Both objective (impact of paying or not paying for a drug on patients' household economic situation) and subjective (patient and program manager feedback on whether patients had been fairly classified) data were considered when determining agreement between IS score and PFET score.
Results
Principal Components Analysis
PCA was undertaken in order to determine the weights of the indicators retained in the PFET, and the results are shown in Table 3. Among the 4 countries included in the analysis, the greatest variation was observed for the percentage of variance explained by vehicle, cooking method, and health care-related expenses.
Cronbach's alpha was then calculated in order to analyze the internal consistency of the variables retained in the index for each country. The overall Cronbach value was 0.84, and the country-specific values for China, India, Malaysia, and Thailand are 0.82, 0.90, 0.77, and 0.82, respectively. All Cronbach values are greater than 0.7, indicating that there is an acceptable level of intercorrelation between the variables considered in the index.
PFET customization
Following the PCA and Cronbach analyses, the PFET Index was customized on a country-by-country basis to reflect the percentage of variance accounted for by specific indicators in each country, so as to account for differences in local standards and practices. An example of this customization is shown in Table 4, in which the weight of the questions about dwelling type and cooking method, and the weights and ranking of the answers to these questions, differ between Thailand and Malaysia.
Values are in Thai Baht.
Values are in Malaysian Ringgit.
LPG, liquefied petroleum gas; PCA, principal components analysis.
PFET validation
In order to validate the predictive ability of the adapted PFET Index with respect to patients' ability to pay for medication, the tool was administered concurrent with the IS to 117 patients. The degree of agreement between the PFET score and the IS score is shown in Table 5. Based on these results, estimated ability to pay was accurate for 58.1% of patients, fair for 29.1%, and poor for 12.8%. Weighted kappa statistics also were calculated. Overall kappa was 0.756 (P<0.0001, standard error [SE]=0.09). Kappa values calculated for each individual country were all between 0.68 and 0.95 (Thailand=0.949, SE=0.225; Malaysia=0.771, SE=0.172; China=0.692, SE=0.156; India=0.685, SE=0.157), and P<0.0001 for all countries. The distribution of PFET scores by IS scores is shown in Figure 1. As shown, the distribution of the PFET scores is generally consistent with the targeted IS score through the lower and middle ranges of IS score. The PFET tends to underestimate IS scores at the highest end of the range (IS=4 or 5).
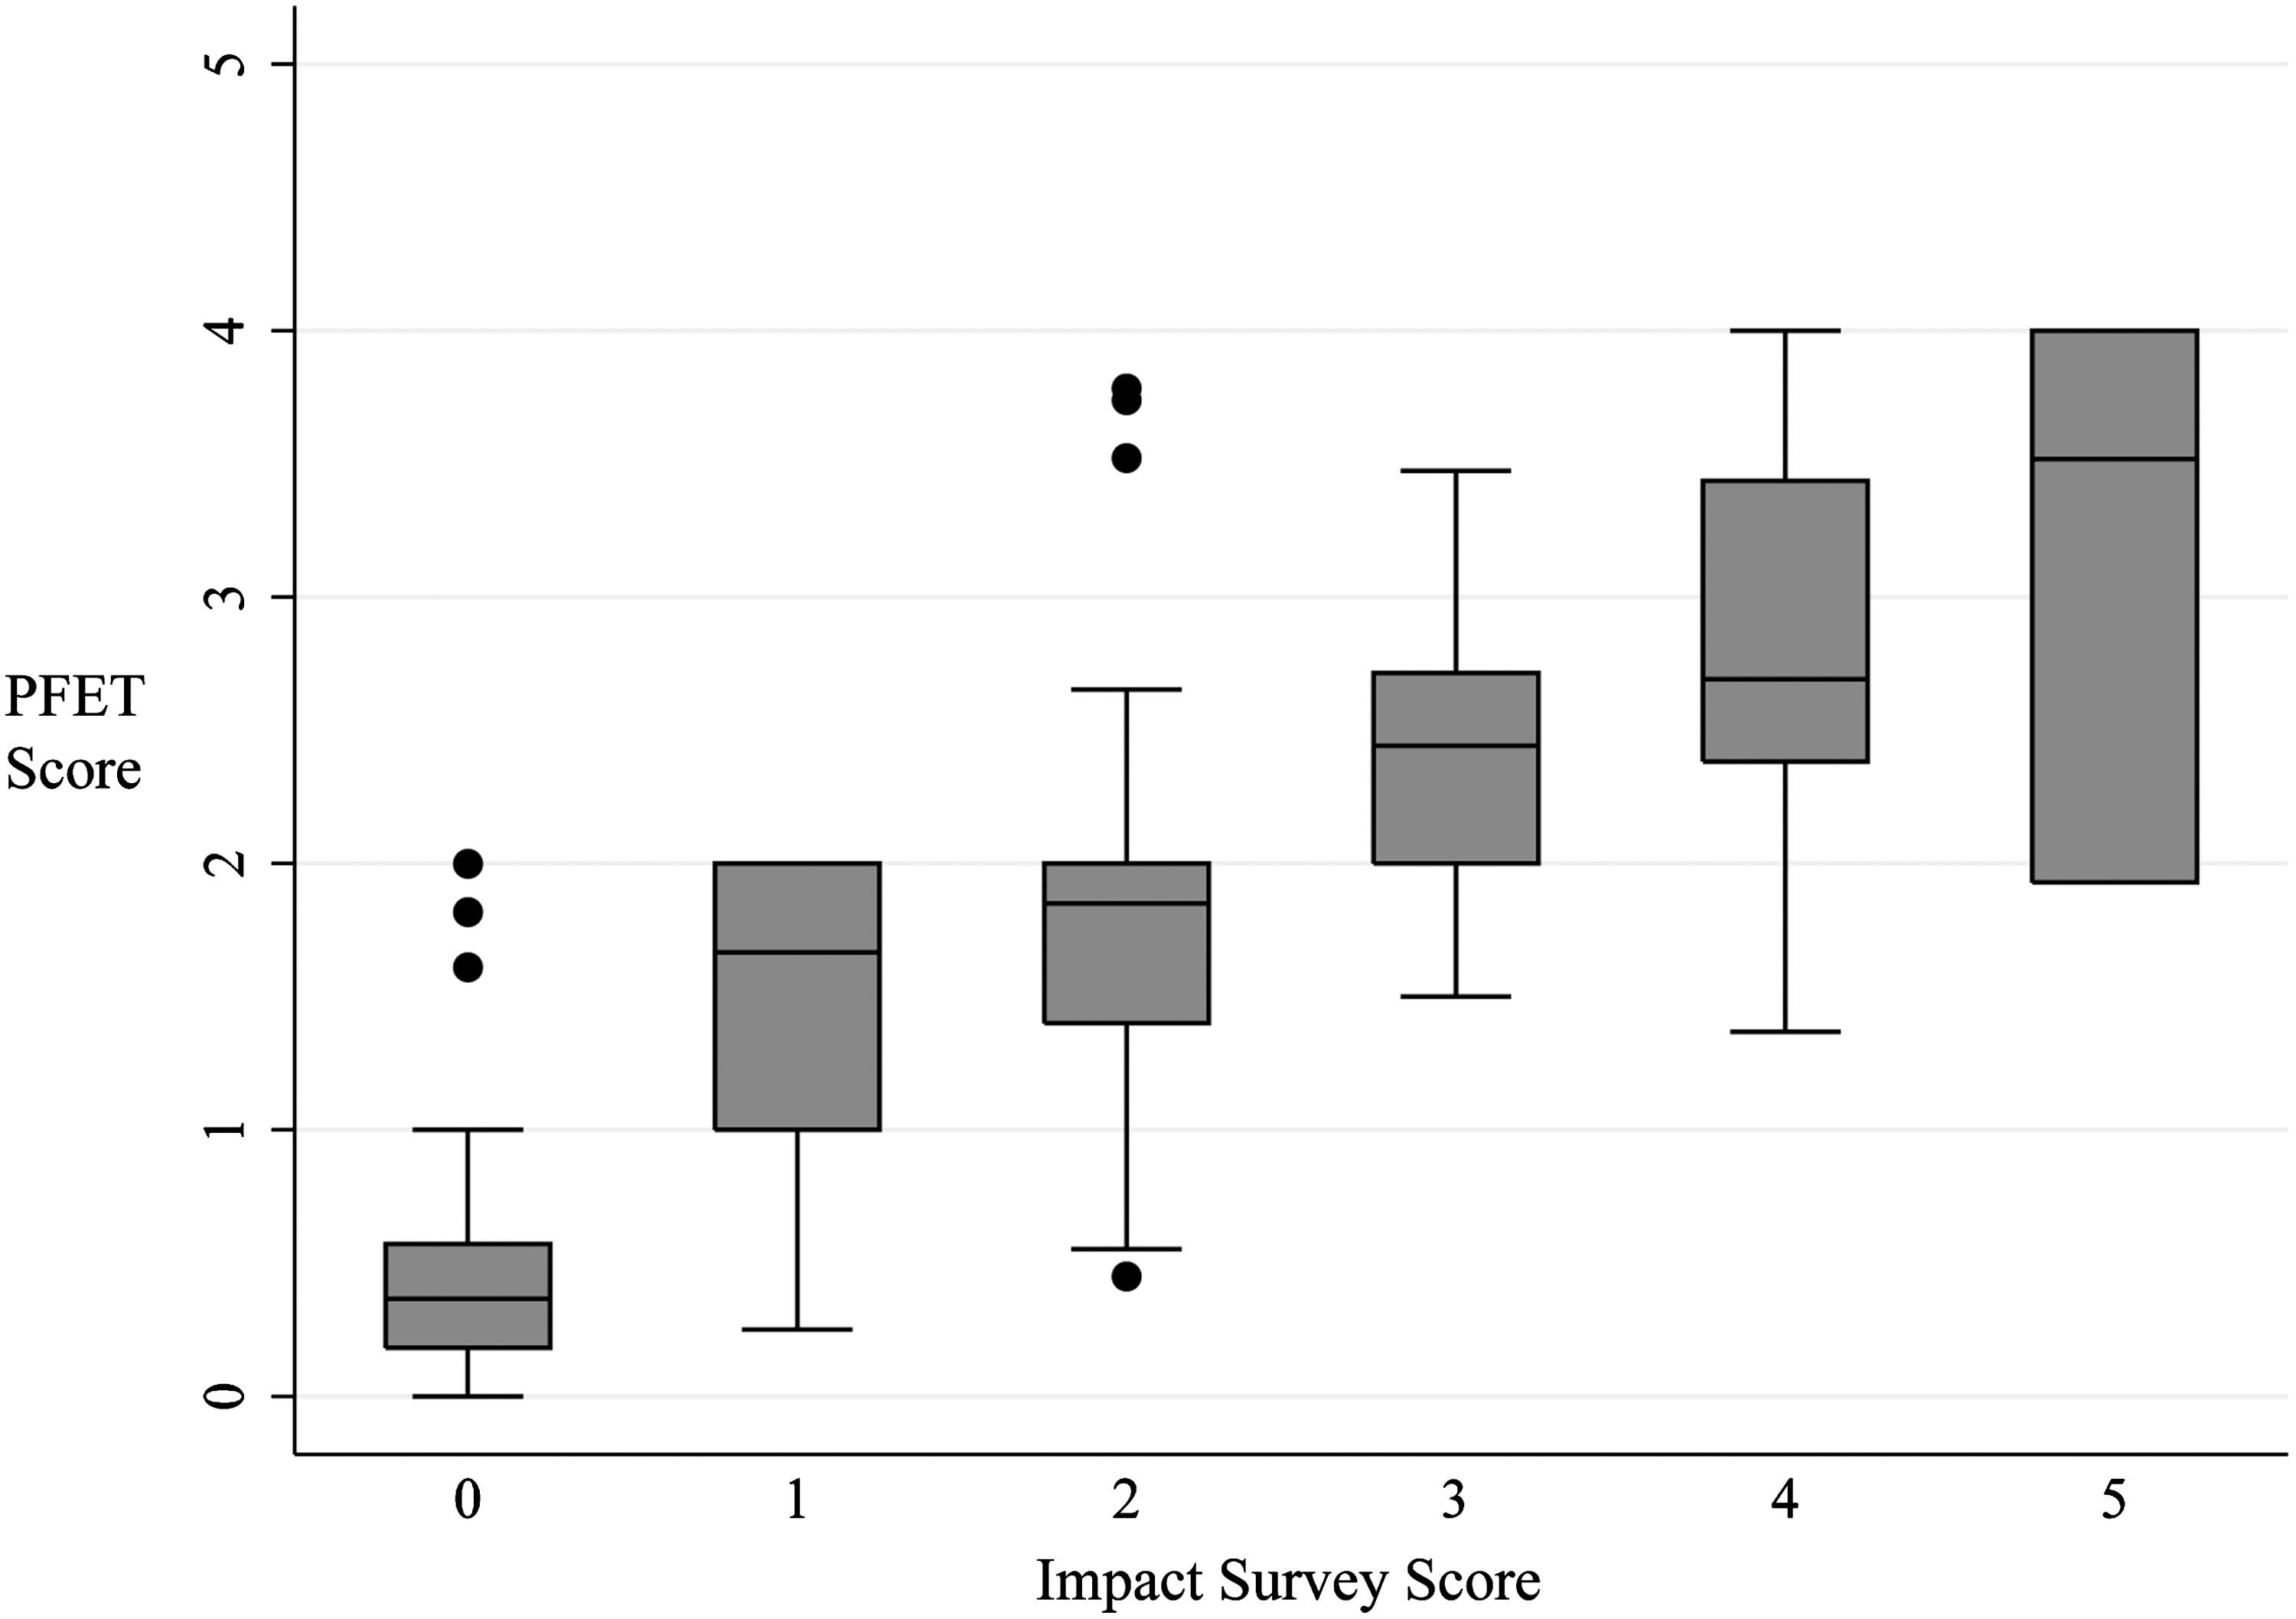
Distribution of Patient Financial Eligibility Tool scores by Impact Survey scores. Box plots represent the interquartile range (IQR) comprising data between the 25th and 75th percentiles. The horizontal line within each box represents the median value. Whiskers extend to the 1.5*IQR beyond each box; circles represent outliers.
Discussion
Among other strategies, tiered models for patient participation in the cost of medication aim to increase access to high-priced products in developing countries. In these countries, there are finite financial resources available to subsidize the cost of treatment and medication. Consequently, the identification of more patients who can afford to pay for all or part of their care should increase the amount of subsidies available to those patients who truly need additional financial support because they are too poor to pay for even a small part of their medication costs. In this context, there is a critical need for an objective tool that effectively captures patients' ability to pay for medication without penalizing patients and their households. Indeed, the ability to accurately stratify patients into different payment classes is crucial to ensuring that patients pay what they can.
In the present article, the ability to pay for a drug treatment was assessed using an overall score that is based on 3 different types of indicators: income, expenditures, and assets-based wealth. Economists typically use income and/or expenditures to measure economic status. However, income often is unobserved or poorly measured in developing countries in which informal and cash economies predominate. 6 The challenges inherent in determining income in developing countries include: individuals' limited knowledge of their own incomes; efforts to hide income from interviewers; members of a household may not share or report all of their income with the rest of the household; income may come from multiple sources and may vary over time; home production and unpaid production of goods and services are difficult to value; and reporting of unearned income (eg, interests, rents) is problematic. 6 Underreporting of income by self-employed individuals has been documented in a study by Kim and colleagues, 12 who found that 38% of the income of self-employed households in Korea and 47% of the income of self-employed households in Russia are not reported. Similar challenges are found when using expenditure data as an indicator of overall economic status. These include: reporting of expenditures by a single household member, which may lead to omission or misstatement of expenditures incurred by other household members; bias resulting from the composition of the basket of goods and services used in the survey; difficulty in selecting a period of time over which to assess expenditures; and decisions as to whether health-related expenditures should be included in the assessment. 6 Additionally, expenditures may not fully account for spending by all household members or for payments that are large, periodic, or sporadic.
As described by Rutstein and Johnson, 6 a wealth index can be constructed by measuring a household's relative position in the distribution of different indicator variables, such as ownership of a television, motorcycle, or refrigerator, or use of a surface water source. The Demographic and Health Survey also includes public services such as electricity and piped water. 6 These assets and services are then analyzed using PCA to assign a weight to each indicator. 3 Although the use of a wealth index may provide a more accurate assessment of financial status compared with income or expenditures, the accuracy of any individual index may vary based on the variables included, 3,7 as well as the weights and values assigned to questions and responses for specific indicators.
A recent report by Howe et al compared the use of subjective measures of SEP with traditional wealth index metrics to determine SEP in Malawi. 9 The authors found that 3 of 4 subjective measures of SEP identified a higher proportion of dollar-a-day poor households than did the wealth index. Despite these results, we believe that the objective criteria on which the PFET is based provide a more suitable classification method of the absolute ability to pay for health care products and services for several reasons. First, subjective ranking in the context of ability to pay for treatment is likely to lead to underestimation of the household's ability to afford care. In fact, Howe et al acknowledge that respondents may manipulate subjective SEP indicators in order to achieve a desired outcome. Such manipulation may be particularly problematic in situations where classification of economic status is tied to particular benefits, services, or taxes. This has been observed in income surveys when respondents hide income in order to appear poorer and qualify for assistance or avoid taxes. 6 It is unlikely that individuals will understate their income when trying to qualify for loans or other financial products. Second, the authors also note that subjective indicators may not be interpreted consistently from respondent to respondent. This likely would confound the use of these indicators in fairly establishing patients' ability to pay for oncology treatment. In fact, high objectivity and comparability among responses are key strengths of the PFET, enabling its use as a reliable and equitable tool to determine ability to pay. The PFET also takes into consideration exceptional circumstances that may impact patients' ability to pay for their treatment but that are not captured in existing survey tools, including the PFET. Third, although Howe et al 9 see the influence of community infrastructure in the wealth index as a disadvantage when determining individual household SEP, its inclusion is an advantage of the PFET because of its influence on the ability of a household to pay for certain wealth items.
In order to assess the validity of the PFET, we conducted an IS so as to help quantify what each patient actually was able to pay for a drug treatment. After comparing the IS with the predicted result yielded from the PFET, agreement was globally good with an overall kappa of 0.76; poor correlation was determined in only 15% of patients. Yet, as shown in Figure 1, the IS identified differences between predicted ability to pay and actual outcomes, mostly showing an increasing underestimation of the PFET score with increasing IS score. Ongoing use of the IS and a growing database of responses should support further refinement of the PFET, allowing increasingly accurate classification of patients' ability to pay for treatment as well as the ability to capture changes in the economics of the household and the economic and political environment in the country through continuation validations.
Another benefit of the PFET is that it is designed for country-by-country customization in order to account for local cultural, behavioral, and economic standards. As shown in Figure 1, the relevance of answers to specific questions will vary from country to country, and the weight of each question and the weight and ranking of each answer also may vary among different countries. Input from key stakeholders in each country prior to launching the PFET provides context with which to adapt the tool so that it accurately accounts for local needs and expectations. For example, several amendments were made to the Thailand Patient Questionnaire based on feedback from local stakeholders that identified that the presence or absence of a separate kitchen room, utility bills, house size, and type of dwelling (rural vs. urban) were relevant indicators of patients' ability to pay for treatment in the Thai context. The material used for the roof of the dwelling was found to be irrelevant to patients' ability to pay when the questionnaire was tested in Thailand. Local stakeholder feedback and pilot testing identified several indicators that required more evaluation in order to determine their relevance to patients' ability to pay in the Thai context. These included daily mode of transport, level of education, public vs. private sector employment, number of water points within the dwelling, method of cooking (electricity vs. gas), source of water, and dwelling floor material. Similarly, the types of floor materials commonly used in Pakistan differ from those used in the Philippines, and similar floor materials have different rankings and relative weights in each country (Fig. 1).
It also should be noted that although the PFET was initially designed and is currently being used to assess a patient's ability to pay for oncology treatment, its ability to assess household financial status might make it useful in a variety of assessments. An effective methodology to determine an individual's ability to pay for goods and services could have both commercial and policy implications and might enable increased market efficiency and optimized delivery of health and non-health-related support services.
Over the past 5 years, the PFET has been deployed in 7 countries along with the development of a database platform that enables internal testing that will help identify areas that could be further adjusted to yield greater economic differentiation of patients' ability to pay. The database enables the automatic extraction of a large sample of patient data for use in assessing the relevance of each question and indicator within each country. Thus, continued utilization of the PFET in current and additional countries should allow for further refinement and optimization of the tool.
This study had several limitations. First, the overall sample size and the number of patients in each of the 4 countries included in the analysis is low. However, the pool of participants as a whole reflects a variety of financial situations and provides insight into the predictive power of the PFET for patients with different economic status. Second, the ability of the PFET to accurately predict patients' ability to pay for medication relies on the strengths of the assumptions made for determining the ad hoc brackets and 6-grade Likert scales. However, extensive review of the literature and input from economists support the use of this approach. Third, this methodology is potentially subject to clumping and truncation. As previously described, clumping occurs when there is an insufficient number of asset indicators and all respondents cluster into a small number of groups. In this situation, it may be difficult to identify true differences among the individuals. 16 Truncation occurs when there are not enough indicators to stratify groups at either extreme of the economic spectrum. 16 However, analysis of PFET scores relative to IS scores shows generally good alignment between the 2 assessment tools (Table 5 and Fig. 1). In general, the PFET appears to be subject to underestimation rather than overestimation of a patient's ability to pay for medication. Underestimation is unlikely to create an adverse situation for the patient and should not limit patients' access to life-saving medication. In contrast, overestimation of patients' ability to pay could yield catastrophic financial results for the patient and his or her family. Importantly, the PFET continues to be evaluated and refined, allowing for continuous improvement of the indicators and their weights. This iterative process is designed to increase the predictive ability of this novel financial assessment tool.
Conclusion
The PFET is an effective tool for determining an individual's ability to pay for treatment. Adaptation of the PFET on a country-by-country basis allows for consideration of local economic, cultural, and behavioral differences that impact an individual's ability to pay for their treatment. In-country studies validate the PFET approach to assessing financial eligibility in the context of paying for their health care treatment, and provide a framework for continued adjustment and improvement of the tool as additional data sets are collected and analyzed. The establishment of the PFET database provides a mechanism to ensure the consistency and quality of patient financial eligibility classification and should facilitate adaptation of the tool in additional countries.
Footnotes
Disclosure Statement
Drs. Saba, Audureau, and Ladner, and Ms. Bizé, and Ms. Koloshuk disclosed no conflicts of interest and received no funding with regard to the research, authorship, and/or publication of this article.