
Abstract
The objective of this study was to compare episode-related and annual costs and work absence days for employees with <3 versus ≥3 annual gout attacks. Human Capital Management Services data (2009–2010) from adult employees with gout (International Classification of Diseases, Ninth Revision code 274.x) and ≥12 months of medical and pharmacy benefits were studied. Outcomes of interest included medical and drug costs, number of emergency department and urgent care visits, number of inpatient days, short- and long-term disability, sick leave, workers' compensation costs, and work absence days. An algorithm based on diagnosis code and antigout medication use identified acute gout treatment episodes. Multivariate analysis compared annual and pre-episode vs. during-episode outcomes for employees with ≥3 vs. <3 gout annual attacks. Of 3361 employees with gout, 76 had ≥3 attacks; these employees had higher short-term disability costs ($1663 vs. $643, P=0.06) and days (11.68 versus 4.61, P<0.05), more emergency room visits (0.55 vs. 0.23, P<0.0001), and urgent care visits (0.07 vs. 0.04, P<0.01), and lower pharmacy costs ($1677 vs. $1108, P<0.0001) than those with <3 attacks. Medical costs both before ($203 higher) and during attacks ($136 higher) were significantly higher for those with ≥3 attacks than for those with <3 attacks. Additionally, a quadratic increasing relationship was found between number of attacks and cost. Frequency of acute gout attacks (≥3 episodes per year) among employees with gout was associated with greater short-term disability cost, absence days, and emergency department and urgent care visits, and trends toward higher overall costs. (Population Health Management 2013;16:138–145)
Introduction
Gout often occurs in conjunction with other conditions. Patients with gout have significantly more comorbidities than matched controls, 13 specifically experiencing higher rates of diabetes, hyperlipidemia, hypertension, 14 coronary atherosclerosis, 15 and arthritic conditions. 16 These comorbidities account for the vast majority of the increased cost of medical care for patients who have gout compared to those who do not. 17,18
Although most patients diagnosed with gout have infrequent attacks (a median of 1 or fewer annually), a small subpopulation experience recurring attacks. A recent population study over a 3-year period found that approximately 9% had 3 or more attacks per year and 1.6% had 6 or more attacks. 19 Among other characteristics, patients who had more frequent attacks were more likely to be male, have a high body mass index, and have more comorbidities. 19
Multiple studies have verified that having gout results in higher health care utilization and costs compared to similar people who do not have gout. 6,17,18 Patients who have gout have 2 to 3 times the rate of doctor visits, hospital stays, and laboratory tests than similar people who do not have gout, 13,16,17 and twice the rate of health care services use for arthritis-related conditions, as well as for several other co-morbidities. 15 Numerous investigations document that patients who have gout have significantly higher annual medical and pharmacy costs than those who do not have gout. 13,17 Similarly, elderly patients who have gout had higher cost (difference of $5515) than elderly controls. 18 Because of the physical limitations caused by gout attacks, employees who have gout also are absent more frequently (4.6 days more annually) and are less productive (processing 2.8% fewer work units per year). 6 In total, the increased cost, higher absence rate, and lost productivity from gout is substantial.
Research findings regarding the economic burden of gout are expressed most often as an average annual value. However, closer examination of cost distributions reveals that, for most patients, gout-related spending is very small. In one investigation, 73% of patients with gout incurred 20% of gout treatment costs. On the opposite end of the spectrum, the top 0.9% spent 20%, and the top 12% spent 60% of the resources. 17 Such dramatic differences in health resource consumption suggest a need to better understand factors driving underlying variation.
It is logical to conclude, and studies confirm, that higher costs coincide with experiencing a greater number of attacks. 13,20 Recurring attacks result in patients seeking more care and in higher treatment costs. 13 Yet, it is not clear whether costs and health care utilization accumulate additively with each additional attack or whether those who experience more attacks have attacks of a different nature or severity. As such, this study examines health care utilization, absences, and productivity costs for patients who have fewer versus many attacks. Additionally, to describe the characteristics of attack episodes, the study measures attack episode costs for patients with gout with fewer (<3) and many (≥3) attacks.
Methods
Database
The analytic database used in this research project was produced from the Human Capital Management Services Research Reference Database. The database contained de-identified, integrated information for approximately 1.2 million employees from various large self-insured employers throughout the United States during 2001 to 2010. The database contained employee-specific information on demographics, salary and payroll, company type, job type, employment status, health care utilization (claims), absence, and productivity data.
Work absence data metrics come from 4 types of employee absence data: sick leave, short-term disability (STD), long-term disability (LTD), and workers' compensation. These data are collected from each employer's payroll system, disability insurance carrier, or workers' compensation claims administrator. They provide actual days absent from work, not estimates based on medical services. For a subset of <30,000 employees, real work output (productivity) data are available in years 2001 and 2002. These data come from daily electronic measurements of units of work performed and hours worked by each employee and have been used in prior studies. 6,21 For each employee, units of work performed per hour on the job (hourly productivity) and units of work performed per year (annual productivity) are calculated.
The database is organized in a person-centric manner to allow the data for separate benefits to be linked by person and studied using integrated analysis. In addition, because the database contains health care and pharmaceutical utilization, as well as work absence information at the claim level, it is possible to measure the association of gout and number of gout attacks with costs, absences, and other outcomes.
Study populations and attack definition
Employees and dependent spouses were defined to have gout if they had at least 1 diagnosis for gout (primary, secondary, or tertiary International Classification of Diseases, Ninth Revision [ICD-9] code of 274.xx) in their medical claims data or had at least 1 gout-related medication (colchicine, probenecid, allopurinol, or febuxostat) in prescription drug claims data. Both employees and spouses were included in attack frequency analyses, while only employees were included in cost and other outcomes analyses. Patients with gout were required to have at least 1 year of continuous health plan enrollment over which outcomes would be measured (July 1, 2009 to June 30, 2010 if possible; if not, then the 12-month period closest to it but still within the 2009–2010 period). For the work output/productivity analyses, those selected were enrolled and measured during the period between July 1, 2001 and June 30, 2002. The index date was defined to be the first day of the 12-month measurement period.
Gout attack episodes were adapted from a previously published methodology. 22 Attacks were required to be at least 14 days apart (start date to start date) to be counted as independent episodes.
Employees were assigned cohort membership according to the total number of attacks during their measurement year. Two cohorts were identified: (1) employees with <3 attacks per year and (2) employees with ≥3 attacks per year.
Outcome measurement
Frequency analyses were performed according to the number of independent attacks measured for each employee or spouse during the patient's measurement year. Attacks per year also were calculated for employees in the following job type groups: transportation/moving, repair/installation, office/administration, sales, management, architecture/engineering, business/financial, health care, other, and unknown. Specific comorbid conditions (chronic kidney disease, cerebrovascular/peripheral vascular/ischemic heart disease, obesity, gastrointestinal disorders, congestive heart failure, dyslipidemia, hypertension, diabetes, and liver disease) also were identified among employees during the year.
Descriptive statistics such as age, sex, marital status, race, salary, years with employer (tenure), exempt status (salaried vs. hourly), full-time status, region (defined by the first digit of the patient's zip code), and prevalence of the specific co-morbidities were calculated for each employee. Age, sex, marital status, region, and comorbid condition prevalence were calculated for each dependent spouse.
Employee outcomes were calculated on an annual basis during the measurement year, with comparisons made between the <3 attacks and ≥3 attacks cohorts and with outcomes shown by number of attacks. Employee outcomes also were calculated on an episode basis (among employees with at least 1 attack), with outcomes measured during both the “pre-attack period” (42 to 14 days before the start of the attack) and the “attack period” (14 days before to 14 days after the start of the attack) and compared between the <3 attacks and ≥3 attacks cohorts.
Medical costs consisted of the sum of sponsor-paid (not individual co-payment) amounts from nonpharmacy medical insurance claims. Drug costs consisted of the sum of sponsor-paid amounts from prescription pharmacy insurance claims. Sick leave costs and absence days outcomes were calculated as the sum of actual payments (from payroll data) made to employees and number of days absent during an absence episode. STD costs and absence days were calculated as the sum of actual payments made to employees (from disability insurance carrier data) and number of days absent during STD leaves. LTD costs and absence days were defined as actual payments made to employees (from disability insurance carrier data) and number of days absent during LTD leaves. Workers' compensation costs and absence days were defined as actual payments for work-related injury medical and pharmacy claims and payments made to employees as salary replacement (from workers' compensation claims data) while absent due to a work-related injury, and number of days absent during a workers' compensation leave.
Health care utilization metrics were extracted from insurance claims data, including number of emergency department visits, number of urgent care visits, and number of inpatient hospital days.
Work output (employee productivity) was calculated using electronically-measured work output data in the form of number of units of work performed per person each day and number of hours worked each day. These data were converted to hourly productivity (number of units of work performed per hour worked—productivity while at work) and total productivity (number of units of work performed over the measurement period—combination of absence and hourly output).
Turnover was defined as the percent of employees who terminated during the 6-month period immediately following the measurement year (turnover studied in the annual analyses only, not the episode analyses).
Statistical methods
All analyses were performed using SAS System for Windows, version 9.2 (SAS Institute Inc., Cary, NC).
Descriptive statistics were compared using t tests for continuous variables and chi-square tests for dichotomous variables. In the frequency analyses, average numbers of attacks were compared using t tests. The percentages of patients with different numbers of attacks were compared using chi-square tests.
The effects of gout attack frequency on annual costs were estimated using regression models for each outcome, controlling for age, sex, marital status, race, exempt status, salary, tenure, and region. For all cost and days outcomes except LTD, 2-part logistic/generalized linear models with gamma distribution were used. 23 For emergency visits, urgent care visits, inpatient days, productivity, and LTD, Poisson regression was used. For turnover, logistic regression was used. For each outcome, 1 set of regression models was used to compare outcomes between the <3 attacks and the ≥3 attacks cohorts, and another set of regression models (with number of attacks and number of attacks squared as independent variables) was used to determine the effect of number of attacks on each outcome.
In the episode analyses, the effect of gout attack frequency on attack-related costs and other work outcomes was estimated using repeated measures 2-part regression modeling. Models controlled for differences between cohorts using covariates: age, sex, marital status, race, exempt status, full-time status, salary, tenure, region, the presence of a prior attack overlapping with the current attack, and an interaction term between the pre-attack period variable and the overlap variable. Repeated measures models allowed for estimation of outcomes in both the pre-attack and the attack time periods. Two-part regression models better account for non-normal distributions of the data. 23
Each absence analysis was run on the subset of employees who were eligible for the given absence benefit. All costs in the study were inflation adjusted to 2011 dollars using Consumer Price Indices.
Results
Frequency of attacks
A total of 3361 employees and 1603 spouses met full criteria for claims eligibility and gout diagnosis. On average, employees had more attacks per year (0.43) than spouses (0.37) (P<0.05). The distribution of annual number of attacks is skewed, with a mode of zero. More than two thirds of subjects (67% of employees and 71% of spouses) identified to have gout had no attacks in the measurement year. Approximately one quarter had 1 attack, and slightly less than 5% had 2 attacks. Only a small fraction (0.24% of employees and 0.06% of spouses) had 5 or more attacks in the measurement year. Of those with gout, 2.3% (76) of employees and 1.3% (21) of spouses had ≥3 attacks in the measurement year.
Association between frequency of attacks and other factors
As shown in Table 1, there were few differences between employee cohorts; employees with ≥3 attacks per year were approximately 3 years younger and less likely to be female than those with <3 attacks per year. Employees in the ≥3 attack cohort also were less likely to have diabetes than those with fewer attacks. Among spouses, no significant differences in demographics or comorbidities were found between those with <3 attacks compared to those with ≥3. Cohorts were similar with regard to marital status, race, work characteristics (tenure, salary) and other comorbid conditions.
Although there was no association with employee salary, there were observed differences in the annual frequency of attacks for employees with different occupations. The annual rate of attacks was highest (0.60) for workers in the transportation/moving and repair/installation industries. Health care workers and business/financial professionals had the lowest annual rates, 0.28 and 0.35, respectively.
Results indicated a negative linear relationship between number of comorbid conditions and the annual frequency of attacks; those with none of the measured conditions had almost twice the rate of attacks compared to those with 6 co-morbid conditions (Fig. 1). On average, 1 additional co-morbid condition was associated with 0.05 fewer attacks per year (P<.0001).

Number of gout attacks by number of comorbidities.
Annual costs
Several components of annual all-cause health care resource utilization and absence costs increased with the number of gout attacks during a 1-year period.
In the first of the 2-part models (testing the effect of attacks on the likelihood of having a nonzero outcome value), number of attacks was not associated with cost outcomes. In the second of the 2-part models (testing the effect of attacks on the magnitude of the outcome) number of attacks was predictive of annual medical costs (quadratic) and pharmacy costs (quadratic) (all P<.05) (Table 2, Fig. 2). Also, number of attacks was significantly associated with a higher number of days missed on LTD (quadratic) and workers' compensation (quadratic) (all P<0.05). Emergency room visits also were more frequent as number of attacks increased (linear, P<0.0001); urgent care visits increased from 0 to 3 attacks and then decreased (quadratic, P<0.0001). Productivity and turnover were not significantly associated with number of attacks.
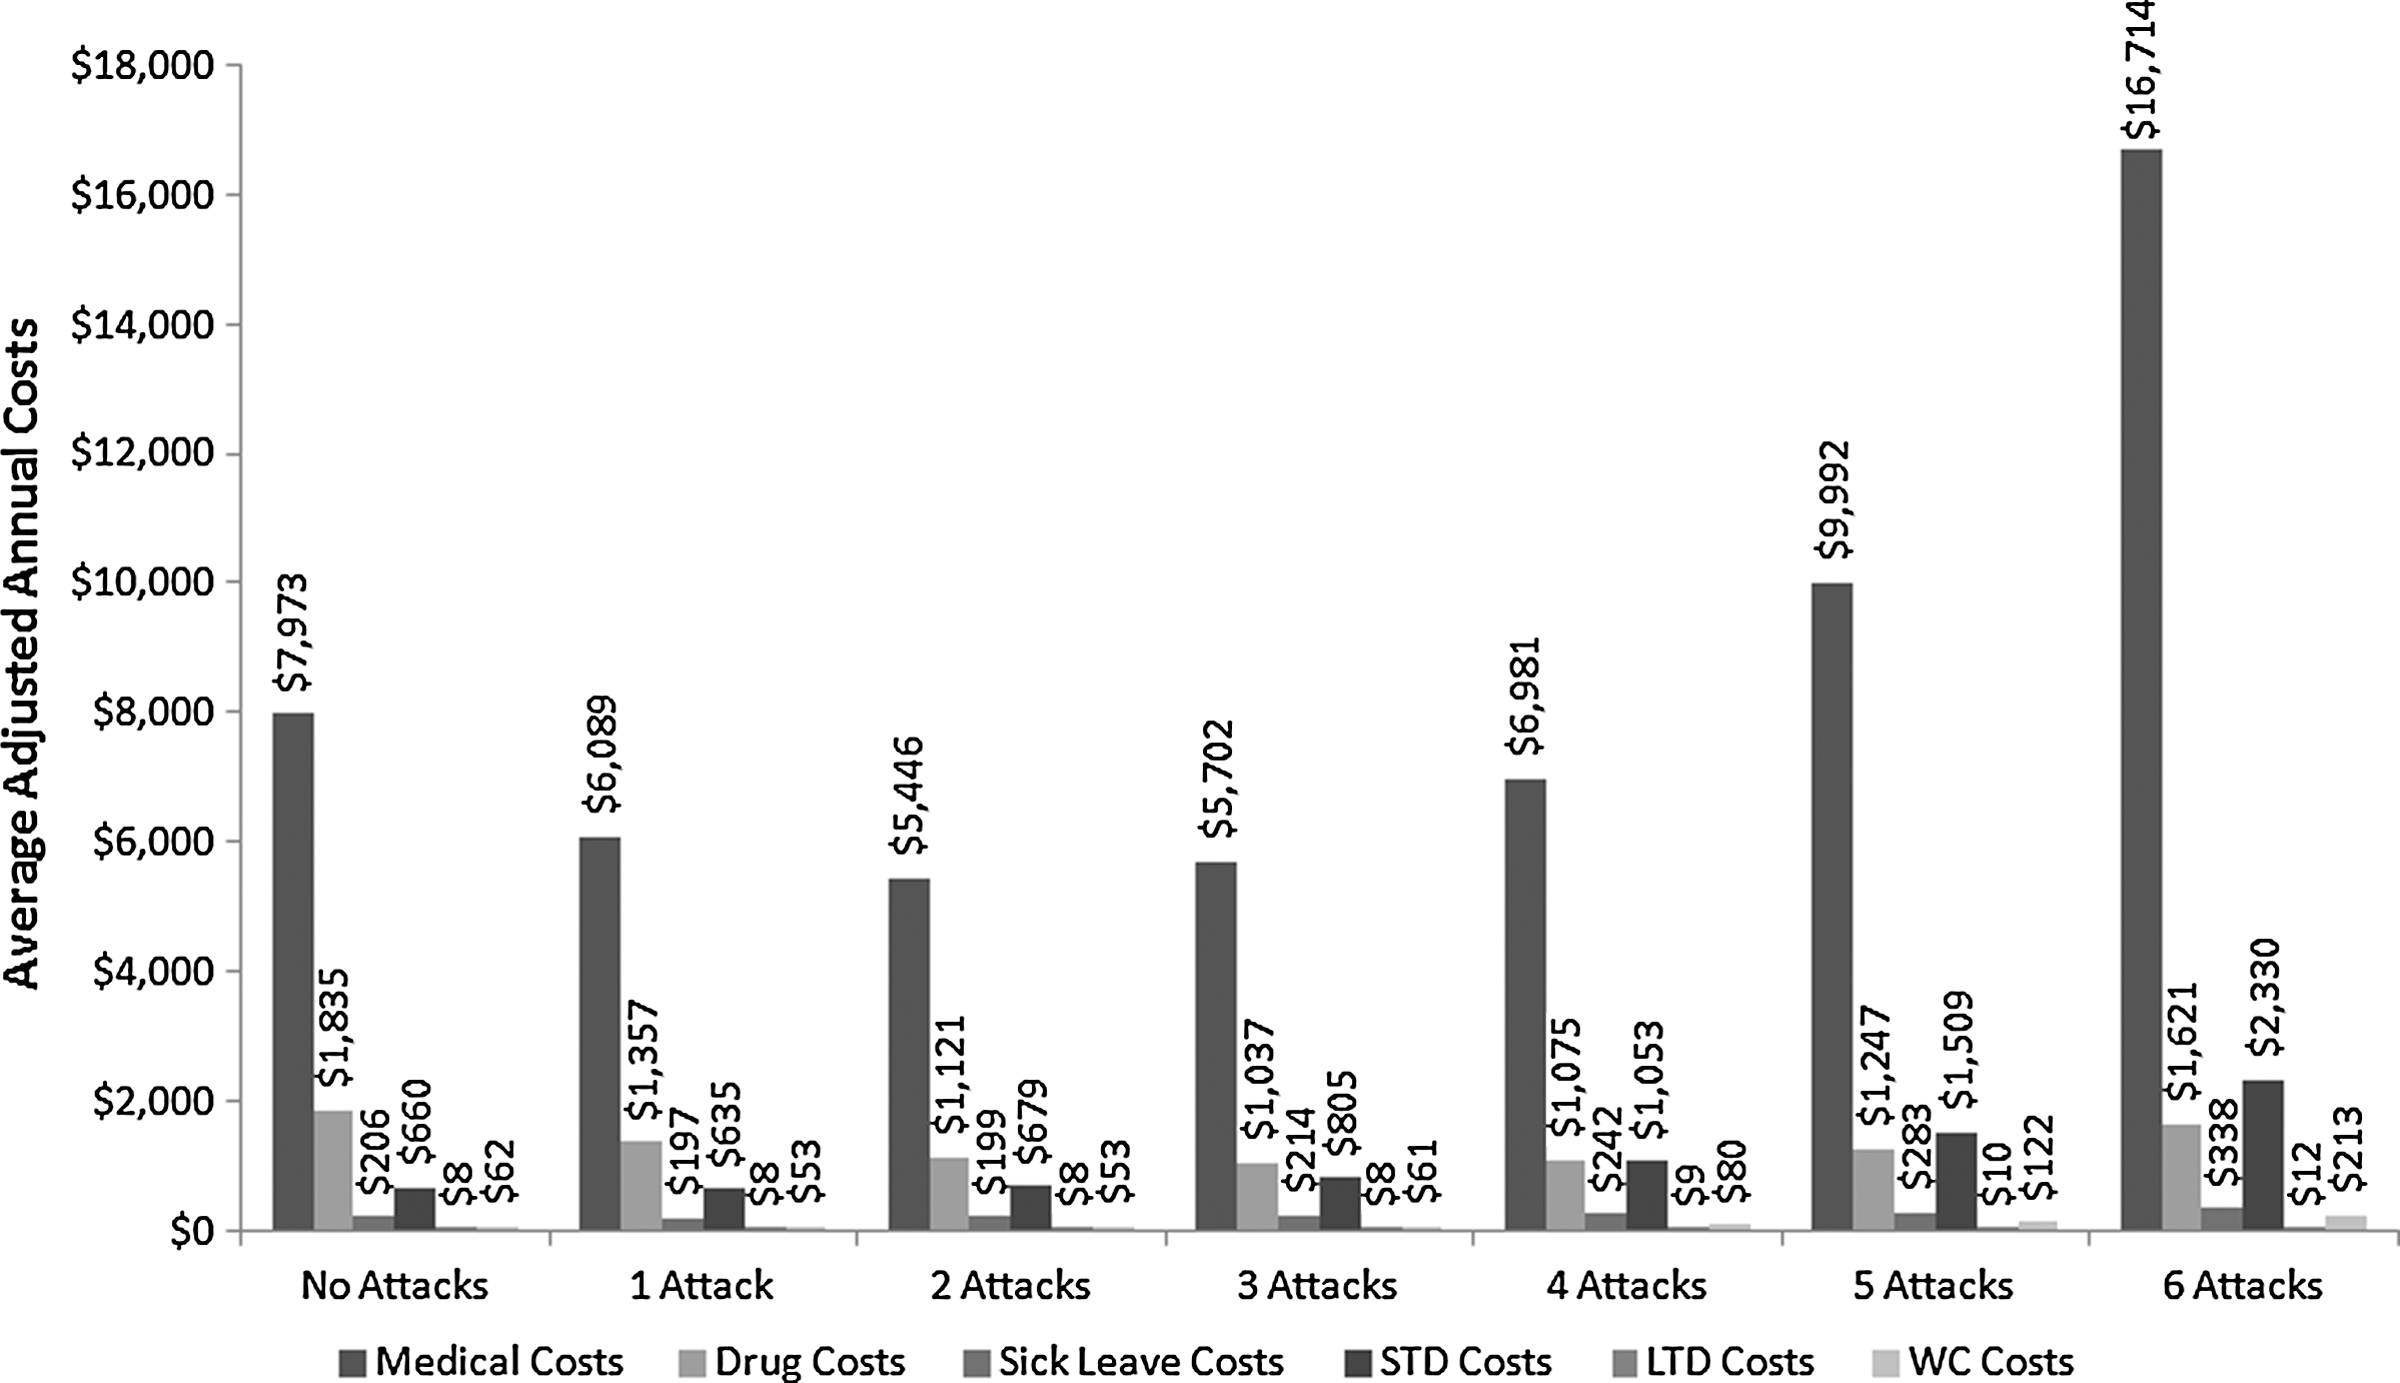
Annual costs by number of annual gout attacks.
Comparing attack frequency cohorts (Table 3), those with ≥3 attacks had higher STD costs, more emergency room visits and urgent care visits, and lower pharmacy costs than those with <3 attacks. Summing all absence days, patients with gout who had ≥3 attacks were absent twice as often (14.58 days vs. 7.11) as those with <3 attacks, with a significant difference in STD days.
Episode costs
Costs and absences were estimated, controlling for demographic and pre-index health factors. Estimated average total pre-episode costs were $470 and $750 for those having <3 gout attacks and ≥3 gout attacks per year, respectively. During the attack episode, patients with fewer annual attacks had an average cost of $737, compared to $982 for those in the ≥3 attack cohort. Medical costs both before ($203 higher) and during an attack episode ($136 higher) were significantly higher for those in the ≥3 attack cohort than in the cohort that experienced <3 attacks (Table 4). Average total days absent for those in the <3 attack cohort were 0.37 in the pre-episode period and 0.54 during the attack episode. In the ≥3 cohort, average total absence days before and during an attack episode were 0.87 and 1.33, respectively.
Discussion
These findings illuminate 2 notable aspects of the connection between gout attack frequency and economic outcomes not reported elsewhere. First, costs appear to increase in a curvilinear pattern, rather than incrementally with each additional attack. Medical and pharmacy costs remained relatively flat for individuals with ≤3 attacks, but increased substantially for those with a greater number of attacks. Increases in lost time from LTD and workers' compensation also increased in a similar pattern. This suggests that resource use and lost time are not higher for those who experience infrequent attacks, but then jump more dramatically as attacks become more commonplace. Although other studies have documented increased resource use by gout patients having a greater number of attacks, 13,20 the quadratic nature of the relationship has not been noted before. That is, rather than being related in a way that can be visually represented by a straight line, the relationship curves upward. This is because the effect of the number of attacks on resource use becomes more pronounced as the number of attacks increases. For example, the difference in medical costs between patients who had 2 attacks vs. 3 attacks is smaller ($256) than the difference between patients who had 5 attacks vs. 6 attacks ($6,722).
A second noteworthy finding is the significant difference in both the pre-attack episode cost and the attack episode cost for those who experienced <3 or ≥3 attacks in the measurement period. This suggests that the frequent attack cohort not only experiences more attacks, but that their attacks are more serious in terms of health care resource utilization. This is consistent with the accelerated increase in cost with each additional attack.
Both of these findings highlight a small subpopulation of patients with gout whose experience is more disruptive, as evidenced by more days absent from work, as well as more costly in terms of health care resource utilization. Similar to other population studies, 14 the population with frequent gout attacks was small. In the current study, 2.3% of employees and 1.3% of spouses diagnosed with gout had ≥3 attacks during a 1-year period. (A study by Rothenbacher 19 found that 7.7% of gout patients had ≥3 flares, but this was over a nearly 4-year period on average rather than a 1-year period). Two thirds of employees and spouses in the current study had no attacks in the measurement year and one quarter had only 1 attack. However, patients who have ≥6 attacks had 2 to 3 times higher overall costs than those with zero to 3 attacks, suggesting a subset of the working population for whom gout poses a substantial burden of disease.
As noted elsewhere, a higher rate of attacks may reflect poor management of a patient's condition, specifically serum urate levels, and suggest the need for different management strategies. 20 Higher rates of attacks also occur more often in patients who are less compliant with their medications, 24 illustrating an even greater need for improved adherence by some patients.
One finding in the current study that was inconsistent with earlier studies is a lower rate of attacks in employees and spouses with more comorbid conditions. Although other studies found a positive association between co-morbidities and attacks, 13,14 results from this study indicated the opposite. Because identification and classification of attacks was determined through administrative claims data, it is not possible to verify whether individuals with more conditions had fewer attacks or whether fewer actual attacks were identified in the data. Others have found that gout patients who have more comorbid conditions are more likely to receive an antigout prescription medication, 14 which, if not taken previously, would be on hand. To test this hypothesis, a descriptive analysis was conducted to examine the difference in duration between a physician visit with a gout diagnosis code and a subsequent prescription fulfillment. The time between diagnosis and prescription fulfillment was significantly longer for those with more of the specific co-morbidities (P<0.0001). Although it is not possible to confirm that the longer delay indicates having medication available, or simply a different fulfillment time frame for those with more conditions, it may suggest that more attacks (which are defined by a diagnosis and treatment combination within a time period) were undetected in patients with more co-morbidities than in patients with fewer comorbidities.
Limitations
There are several important limitations to this study. First, despite having a large employee population from which to select data, the size of the patient population with frequent gout attacks is very small. The small numbers may not have been a sufficient sample size to detect differences in some outcomes. Further analysis with larger populations is recommended.
No ICD-9 code specific to gout attacks existed, so attack identification was based on a claims-based algorithm using medication and health care resource utilization data. Medical claims data reflect an administrative system designed for payment of service rather than clinical investigations or symptom documentation. As such, there will always be error in identifying conditions, episodes, and treatments. Availability of medical records to confirm gout diagnosis, attack occurrence, and serum uric acid levels would have strengthened the cohort definitions. As in any study using these data, there must be some reliance on the assumption that no group has a greater degree of measurement error than another.
Comparisons of cohorts having fewer or more attacks require a choice of specific cut point defining the 2 groups. Although used in prior studies 13,25 and selected to maximize differentiation while still having sufficient cases, the choice of <3 attacks and ≥3 attacks may or may not be the ideal cutoff to illustrate a categorical difference between groups having more or fewer attacks.
Conclusion
This study highlights not only the additional cost, absence, and health care utilization associated with more gout attacks, but also the nonlinear acceleration of many of these outcomes as the number of attacks increases beyond 3 per year. Targeted management strategies for employees with 3 or more annual gout attacks are needed to address the specific needs of this subgroup of patients with gout.
Footnotes
Acknowledgment
Nicholas Rohrbacker, M.S., formerly of HCMS Group, provided some programming support and data analysis.
Author Disclosure Statement
Mr. Chan, Ms. Andrews, and Dr. Yadao are employees of Novartis Pharmaceuticals Corporation. Drs. Lynch and Kleinman conducted the research, for which they received financial compensation from Novartis Pharmaceuticals Corporation.