
Abstract
Underserved populations have limited access to care. Improved access to effective asthma care potentially improves quality of life and reduces costs associated with emergency department (ED) visits. The purpose of this study is to examine return on investment (ROI) for the Breathmobile Program in terms of improved patient quality-adjusted life years saved and reduced costs attributed to preventable ED visits for 2010, with extrapolation to previous years of operation. It also examines cost–benefit related to reduced morbidity (ED visits, hospitalizations, and school absenteeism) for new patients to the Breathmobile Program during 2008–2009 who engaged in care (≥3 visits). This is a retrospective analysis of data for 15,986 pediatric patients, covering 88,865 visits, participating in 4 Southern California Breathmobile Programs (November 16, 1995–December 31, 2010). The ROI calculation expressed the cost–benefit ratio as the net benefits (ED costs avoided+relative value of quality-adjusted life years saved) over the per annum program costs (∼$500,000 per mobile). The ROI across the 4 California programs in 2010 was $6.73 per dollar invested. Annual estimated emergency costs avoided in the 4 regions were $2,541,639. The relative value of quality-adjusted life years saved was $24,381,000. For patients new to the Breathmobile Program during 2008–2009 who engaged in care (≥3 visits), total annual morbidity costs avoided per patient were $1395. This study suggests that mobile health care is a cost-effective strategy to deliver medical care to underserved populations, consistent with the Triple Aims of Therapy. (Population Health Management 2013;16:261–269)
Introduction
Mobile health care is a viable mechanism to deliver guideline-defined 13,14 care to children living with asthma, as evidenced by the Breathmobile Program. This mobile clinic disease management program uses fully equipped mobile clinics staffed by specialty trained asthma providers and integrates strategies for case identification, community outreach, continuity of care, structured health care encounters, and patient tracking. 7,15 Effective asthma care potentially leads to improved patient quality-adjusted life years (QALYs) and reduced costs attributable to preventable emergency department (ED) visits. The purpose of this study is to examine the return on investment (ROI) for the Breathmobile Program in terms of improved patient QALYs and reduced costs attributed to preventable ED visits for 2010 with extrapolation to previous years of operation. It also examines cost–benefit related to reduced morbidity (ED visits, hospitalizations, and school absenteeism) for patients new to the Breathmobile Program during 2008–2009 who engaged in care (≥3 visits). Findings based on these 2 economic approaches (assessment of ROI by mobile health maps standardized algorithm and cost avoidance attributable to actual observed morbidity reductions in the patient population) are reported.
Methods
This is a retrospective analysis of prospectively collected data for 15,986 pediatric patients, covering 88,865 visits, participating in 4 Breathmobile Programs: Los Angeles County+University of Southern California Pediatric Asthma Disease Management Program (Los Angeles, CA [LA]), Children's Hospital of Orange County (Orange County, CA [OC]), Arrowhead Regional Medical Center (San Bernardino, CA [SB]), and UCLA Mattel Children's Hospital (Long Beach, CA [LB]) from November 16, 1995 to December 31, 2010. Hereafter, sites are referred to by geographic location. The Breathmobile is a 34-foot mobile clinic that is staffed by a team of asthma care specialists that include a specialty-trained provider (medical doctor or nurse practitioner), 2 registered nurses or a registered nurse and respiratory therapist, and a patient financial service resource worker who is available on-site or by phone. Each health care team delivers routine, preventive, team-based asthma care at school sites predominately in school districts that serve inner-city, low-income neighborhoods and areas surrounding major freeways. Data recorded at the visit level in an electronic medical record (EMR; Asmatrax, created by Loran Clement, M.D.) were de-identified prior to analysis. This study was approved by the institutional review boards of participating academic centers.
To utilize the ROI prototype described by Oriol et al
16
and the updated application at the Mobile Health Map Web site (
The expectation that 44% of Breathmobile visits otherwise would have resulted in an ED visit conserves the standardized value applied in the algorithm (
Costs avoided because of reduced morbidity utilized the same cost/unit applied in the mobile health maps calculator per ED visit of $923. Cost per hospitalization of $7186 assumed a 30% Medicaid reimbursement rate per the average charge for an asthma hospitalization of $23,953 as reported in The Burden of Asthma in California: A Surveillance Report.
21
The cost of $30 per school day missed was based on average daily attendance built into the revenue per student per day calculation. Estimated average revenue limit funds to schools in California during 2005–2006 was $5341 per student as reported in 2010.
22
The California Department of Education reports an average of 180 days of instruction per year (
Statistical/analytical methods
Process measures reported for California regions in Table 1 were determined by aggregating linked tables within the EMR system per referenced unit (subject, visit, mobile asthma clinic [MAC], or region) and time period (day, month, or year). The demographic composition of patients in each region was described in terms of age, race, and sex distributions based on assessment of EMR data. Asthma-related morbidity prior to program entry (ED visits, hospitalizations, and school days missed) was based on parent recall. Annual morbidity in the post year was determined for patients who entered the program during calendar years 2008–2009 and had ≥3 visits to the program by the end of 2010. Morbidity events reported during each visit interval were summed through the patient's third visit to the program, translated to a per month average based on days engaged in the program from baseline to visit #3, and then multiplied by 12 months. A sensitivity analysis performed on patients who remained in the program 1 year or longer (actual post year morbidity reported) by the study end point yielded results similar to the larger population of patients with ≥3 visits (average number of visits required to achieve control). 2 General linear model repeated measures analyses was performed to assess whether average costs avoided because of reduced health care utilization (ED visits and hospitalizations) varied by demographics, baseline severity, and region. Operational year was determined from start point (launch date) for each program unless the result is specified for calendar year(s). Average ROI in the new program (LB) extended the end date thru June 30, 2011 to include the operational portion of year 2 in the average calculation. A MAC was deemed operational when care was delivered >80 days during a respective year period.
Retention described in patients diagnosed with asthma at baseline visit. Dx, diagnosed; LA, Los Angeles; LB, Long Beach; MAC, mobile asthma clinic; OC, Orange County; SB, San Bernardino County;
Per MAC average calculated within region and then equal weight applied to calculation of regional mean (number of regions applied in denominator of mean calculation reflects number of programs where measure standardized for comparison during relevant period). Operational year for MAC defined as≥80 days operational during the calendar year (assumes 4–5 d work wk. and consideration of school holidays outside of summer).
Average monthly retention in 2010 (examined in patients treated Oct 2009–Sept 2010, adequate follow-up time). Retention evaluated across all months when≥10 patients treated. Excluded patients new to program during last 3 months of 2010 (inadequate follow-up time to evaluate retention).
Retention in return patients evaluated as average percent of return patients treated during each month who returned for subsequent care (unusual for patient to be treated [represented] more than once within a month, although likely to be represented during several time periods [months] in calculation).
Results
Breathmobile outreach
Table 1 describes patient demographics and operational flow for Southern California Breathmobile Programs during 2010. The majority of the patients treated were 5–11 years of age; as expected, male children represented the majority of patients. Demographic composition of patients within each region was comparable across all years of operation (data not shown).
In 2010, each MAC in LA, OC, and SB operated 3.7 days per week on average; the LB program delivered care ∼2.3 days per week (new program). Average visits per month and day were similar across all years of operation.
Return on investment for the Breathmobile Program
Table 2 details each component in the ROI calculation. The ROI algorithm assumes that 44% of program visits correspond to a preventable ED visit. Distribution of cost avoidance is influenced by number of patients and visits (operational flow). The number of patients needed to treat to achieve a zero dollar balance between costs avoided plus QALYs and program investment (ROI $1:1) ranged from 107 patients (average 1 visit/year) to 91 patients (average 4 visits/year).
ED, emergency department; QALYs, quality-adjusted life years saved. ROI in figures did not round to nearest hundredth but maintained all decimal places in calculation until final ROI calculation.
Figure 1 reveals stable estimates across time for each region. Lower ROI and increased variability were observed more often during year 1 operations and immediately following periods of expansion. The average ROI across all operational year periods in each program: LA $5.92:1, OC $7.32:1, SB $11.04:1, and LB $3.78:1.
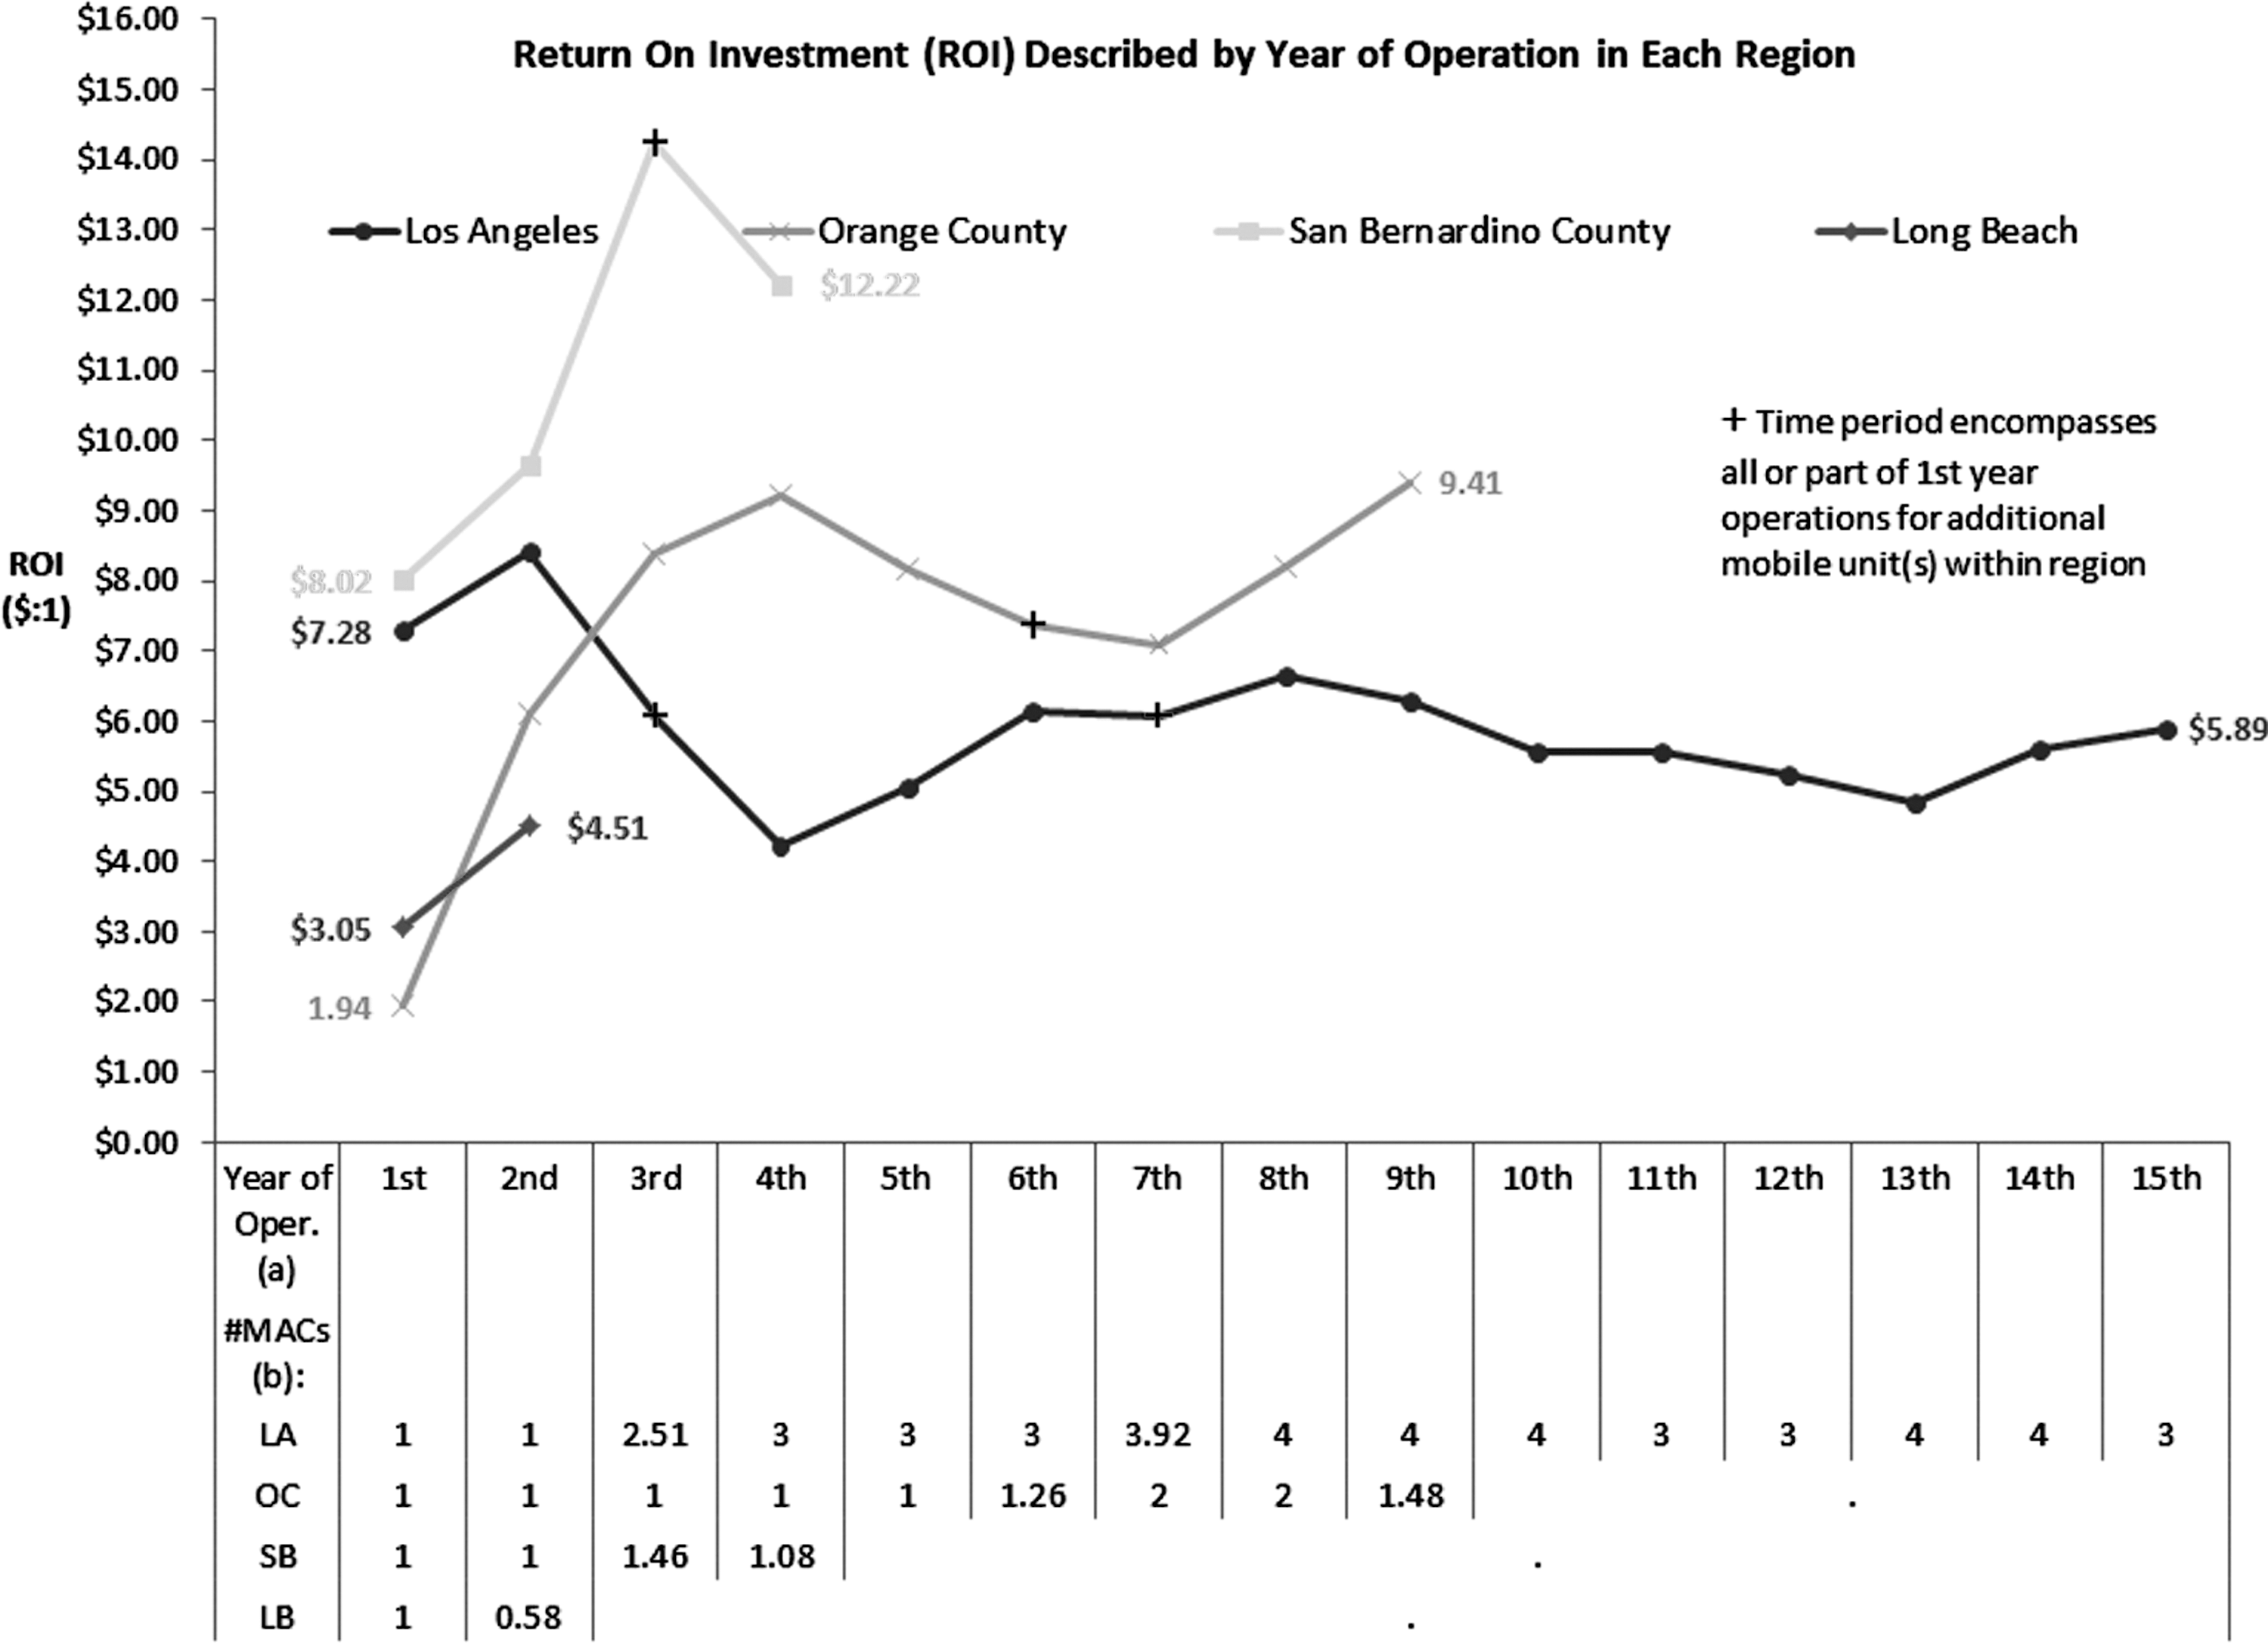
Return on investment (ROI) of the Breathmobile Program across years of operation. The ROI value indicates amount of dollars returned in combined value of life years saved, and emergency department costs avoided for every dollar invested in funding for the mobile health care program. Annual funds invested to operate a Breathmobile Unit average ∼$500,000.
Asthma-related morbidity (ED visits, hospitalizations, and school absenteeism) costs avoided
For 1939 patients who entered the program in 2008–2009 and had ≥3 Breathmobile visits, average costs avoided related to reduced morbidity episodes (ED visits, hospitalizations, and school absenteeism) after initiation of treatment in the Breathmobile Program were $2,705,431 (Table 3). An additional analysis restricted to patients in the program 1 year or longer revealed similar average annual costs were avoided: $1401 per patient (SE=169) (ED visits=$520 [SE=55], hospitalizations=$762 [SE=147], and school missed=$119 [SE=9]). Table 4 describes average cost avoidance across regions.
Numbers are subject to rounding errors. Excluded 10 extreme outliers (1 patient excluded who had ≥100 ED visits in the pre year and 1 patient post year; 6 patients excluded who had ≥100 school days missed in the pre year and 2 patients post year).
Cost/unit ED visits: Average cost of $923 applied in Oriol et al algorithm.
16
*
Cost/unit hospitalizations: Reflects an estimated 30% Medicaid reimbursement rate per the average charge for an asthma hospitalization of $23,953 reported in 2005.
21
*
Cost/unit school days missed: Reflects average daily attendance built into revenue per student per day calculation. Estimated average revenue limit funds to schools in California during 2005–2006 was $5341 per student as reported in 2010 (
Resource utilization (ED visits and hospitalizations) costs avoided
Figure 2 shows that resource utilization costs avoided (ED visits and hospitalizations) per patient averaged $1275 (SE=159). Cost avoidance related to reduced ED visits and hospitalizations was observed across all groups with the exception of cost shifting in the LB region, where the findings reflect first year operations. For patients with intermittent baseline disease severity, annual resource utilization cost reductions were significant, though less than for patients with persistent baseline disease severity. Resource utilization cost avoidance was greatest in the youngest children compared to 5–11 years and 12–18 years. This trend of greater cost avoidance in the youngest age group was observed in LA and OC (P=0.035 and P<0.001, respectively), whereas an inverse trend with age was observed in SB; the youngest patients comprised the only group to not yield significant cost avoidance during the child's first year of treatment (P=0.005) (data not shown). Region-specific demographic and baseline severity cost avoidance differentials were not evaluated in the LB population.

Program participant cost avoidance because of reduced resource utilization (emergency department [ED] visits+hospitalizations) in new patients during 2008–2009 who engaged in care (≥3 visits), described by patient age, sex, race, baseline asthma severity, and region. Average costs avoided described for each group by mean (SE). *Cost/unit ED visits: Average cost of $923 applied in algorithm by Oriol et al. 16 *Cost/unit hospitalizations: Reflects an estimated 30% Medicaid reimbursement rate per the average charge for an asthma hospitalization of $23,953 reported in 2005. 21 †Sum across patients' annual morbidity experience post year determined by following calculation: Patients' average number of morbidity events per month determined thru visit #3×12 months.
Discussion
In 2010, Breathmobiles operating in Southern California provided an average return of $6.73 for every dollar invested in terms of ED costs avoided and QALYs. Annual estimated ED costs avoided in the 4 regions was $2,541,639 and the relative value of QALYs saved was $24,381,000. Furthermore, for patients who engaged in this comprehensive disease management solution (≥3 visits), reductions in average annual morbidity episodes corresponded to significant cost avoidance of $1395 per patient (SE=159): Per patient average annual ED costs avoided were $512 (SE=50), hospitalization costs avoided were $763 (SE=136), and school absenteeism costs avoided were $120 (SE=7). Generalization of these findings should consider the characteristics of this primarily underserved patient population.
A systematic review of home-based, multicomponent interventions focusing on environmental factors among asthmatic children and adolescents found that benefit–cost ratios ranged from 5.3 to 14.0:1. 23 This range is similar to the average ROI observed in this study across operational years: LA $5.92:1, OC $7.32:1, SB $11.04:1, and LB $3.78:1 (new program). In our longest running program, LA (>15 years operation), returns were positive even during periods with expected higher variability (eg, year 1 operations and following launch of an additional MAC within the region). Initial identification and recruitment of patients and community engagement into the program may explain, in part, the phenomenon of variability in year 1 operations. Replication of these findings in similarly structured programs revealed that the Breathmobile Program provides a cost-effective strategy to treat asthmatic children in underserved populations.
The number needed to treat (∼100 patients) to obtain zero dollar benefit:cost ratio by ROI in this study is comparable to findings published for the Baltimore Breathmobile Program, for which the cost–benefit was examined by calculation of the incremental cost-effectiveness ratio (ICER). 4 The Baltimore (University of Maryland School of Medicine) Breathmobile Program, which treated predominately African American children, determined that 112 patients/year are needed to break even (average program costs $500,000 per year). 4
Average ROI in the Breathmobile Program of $6.73:1 is less than the ROI of $36:1 for every dollar invested in the Family Van reported by Oriol et al. 16 This discrepancy can be explained by the depth of services provided by the Family Van. Preventive services provided by The Family Van program are broad (including screenings for obesity, depression, diabetes, vision, cholesterol, hypertension, vision, and diet counseling), and are not specific to identification and treatment of asthmatic children.
Application of the ROI calculation described herein is not limited to mobile health care programs. The LAC+USC (Los Angeles) Breathmobile Program includes a hospital-based Allergy/Immunology Clinic and integration of inpatient asthma services as part of their comprehensive pediatric asthma disease management program. Historically, routine process and impact evaluations, in addition to Joint Commission asthma disease-specific accreditation, have included a report on performance measures for the hospital-based clinic in conjunction with Breathmobile clinics. The disease management solution that delivers high standard care in accordance with guideline-defined criteria 13,14 is replicable across settings. Mobile health in targeted populations of underserved children provides improved access and enables a cost-effective shift in the source for primary care of asthma from the ED to the Breathmobile. Increased days of operation would increase economics; however, the economics must be considered in the context of mobile health care delivery and instructional days during the school year. Mobile health care delivery has unique advantages and disadvantages compared to stationary clinics. Breathmobiles are expected to operate, on average, 4 d/wk during the scheduled school year. The 5th day is generally reserved for administration, scheduling, and education sessions for staff, or extended operations. Challenges to maximizing operational days include school holidays, physical repairs and maintenance for mobile units, personal vacation and time off for staff, and lack of access to schools during testing and summer months. Principals may allow access during the summer or alternative sites are found. The efficient staffing model has decreased overall costs; however, operational limitations may occur when staff are on vacation or out sick. Advantages include improved access to care, decreased cost to families and the health care system, decreased school absenteeism for doctor appointments, improved communication with school caregivers, increased frequency of preventive care, and positive ROI for the program.
Several limitations to this study exist. Start-up funds for mobile unit operations, estimated at a 1-time cost of $186,000 for purchase of the vehicle with a MAC life expectancy of 15 years, were not included in the calculations. The ROI algorithm utilized did not include the costs of medications; however, because of the unique nature of this program, sample medications are provided if patients are unable to afford them. As a parallel, Bollinger et al considered medication costs in their ICER analysis and reported a mean savings of $79.43/symptom-free day gained in patients treated. 4 Estimated ED costs avoided using the 44% assumption in the mobile health map model were $657. Application of this standardized estimate appeared reasonable in our population of primarily underserved children living with asthma. For patients who entered Breathmobile programs during 2008–2009 and continued care for ≥3 visits, reduction in average annual ED costs avoided per patient were $512. Both findings suggest that pre-program entry care excessively flowed in the direction of ED visits (ED cost/visit greater than Breathmobile cost/visit). Reduction in asthma care costs were associated with increased accessibility to routine care in accordance with guideline-defined criteria. 13,14 Although our cost per visit is estimated at $378, which is greater than the Medicaid reimbursement rate, our results are consistent with the national discussion about greater reimbursements from all insurance entities, including Medicaid, for preventive care services and chronic disease. A Centers for Disease Control and Prevention Morbidity and Mortality Weekly Report suggests that asthma costs the United States about $3300 per person with asthma each year in medical expenses. 1, 24 Average costs of preventive care for our patients per year were substantially lower. The Massachusetts Division of Health Care Finance and Policy listed asthma as a condition that may require immediate care in an ED, but the condition potentially could have been prevented/avoided with timely and effective ambulatory care (ie, on a nonemergent basis). 20 Lack of access to primary care services contributes to ED overuse; limitations in options for treatment drive patients to hospitals that are legally obligated to treat all patients who arrive in the ED. 25 The emphasis of the Breathmobile and similar programs on disease management with increased accessibility changes the focus of care from acute/episodic to preventive. The ROI underestimated the benefit portion of the ratio as the algorithm did not take into account important health care expenditure categories (eg, inpatient admissions, outpatient hospital expenditures, radiology, advanced imaging, prescription medications). That being said, ROI was examined under more reserved assumptions with positive returns retained. When a more conservative assumption of 20% (compared to 44% of Breathmobile visits resulting in avoidance of an ED visit) was applied, the resulting ROI was reduced to $6.38:1 from $6:73:1 (ED costs avoided reduced to $1,155,283 from ∼$2.5 million). When a midlevel burden was assumed (instead of high-level burden in assessment of relative value of QALYs in the benefit portion of the calculation), the resulting ROI was reduced to $2.54:1, with ED visits avoided assumed to be 44% (relative value of QALYs reduced to $7,619,063 from ∼$24.4 million). At the most conservative estimate of impact, assumed midlevel burden combined with 20% assumed ED visits avoided retained a positive ROI of $2.19:1. An additional limitation in the ROI calculation is cost savings of reimbursements to schools for improved attendance, costs associated with parental missed work, and parental/child stress associated with an ED visit. Cost avoidance related to improved school attendance was examined in our study. Reimbursement of $30 per student per day is based on the California state average. 22 The actual rate per day may fluctuate by year and school. The ROI calculation assumed that the value of a statistical life year is $70,000. 18 Gerald et al found that population-based asthma screenings are not cost-effective at $50,000 per QALY and have a 20% chance of being cost-effective at $100,000 per QALY. 26 The Breathmobile Programs' efforts to identify at-risk children include the provision of care delivery options that translate into increased potential for positive clinical and cost-effective outcomes. The break-even point (ROI $1:1) based on our annual estimated ED costs avoided of $2,541,639 in the mobile health map algorithm would require assumed value of a statistical life year to equal $4187, far less than the assumed value of $70,000.
In conclusion, mobile health care offers a solution to reduce health care disparities and increase accessibility similar to school-based health centers' ability to transfer cost–benefit to both public health insurance systems, such as Medicaid, and society. 27,28 Guo et al found that reduced hospitalizations in children who attend a school with a school-based health center result in a potential cost savings, reporting $970 per student with asthma. 27
In light of health care reform, the Triple Aims of Therapy initiative focuses on ways to improve the health of the population and enhance the patient experience (including access to care and reduction in the per capita cost of care). 29 The Breathmobile program provides a clinically meaningful and cost-effective model of asthma care and suggests that mobile health care is a cost-effective strategy to deliver medical care to underserved populations consistent with the Triple Aims of Therapy.
Disclosure Statement
The authors declared the following potential conflicts of interest with respect to the research, authorship, and/or publication of this article: Dr. Jones is on the Merck US Respiratory Advisory Board. Ms. Morphew, Ms. Jones, and Drs. Scott, Li, Galant, Wong, Lloret, and Bollinger declared no conflicts of interest.
Footnotes
Acknowledgments
The authors received the following financial support for the research, authorship, and/or publication of this article: Support for analysis of data was provided by the Asthma and Allergy Foundation of America, California Chapter.
Thanks go to Angela Granados, M.D., for her assistance with the abstract. We also express our appreciation to all Breathmobile teams; the Asthma and Allergy Foundation of America, CA Chapter; affiliated hospitals and academic centers; participating departments of health; and to the supportive school nurses and school personnel for their dedication to helping improve the lives of children living with asthma.