
Abstract
The objective of this study was to describe employees most likely to participate in a Personal Wellness Profile (PWP) and/or in a worksite Wellness Program (WP), and to identify whether an association exists between participation and trends in number of health care services and cost of services per person. A retrospective cohort study was conducted using medical claims data from the Deseret Mutual Benefit Administrators, 2004 through 2009. The PWP and WP involved more than 30% of employee contract holders. Participation in the PWP and WP were lower in the older age group and higher among women, married people, and those with an annual income of at least $40,000. Average annual cost per person during 2004–2006 was significantly positively associated with completing the PWP in 2007–2009. Those in the highest quartile for average annual cost per person in 2004–2006 were significantly less likely to participate in the WP in 2007–2009. During 2004–2009, a significantly increasing trend in average annual cost per person was similar, but at a lower level for PWP participants. The trend line also was lower for WP participants, and increased at a lower rate. The lower rate of increase in the trends for average cost per person among those in the WP indicates that the intervention is effective at slowing escalating costs. Additional years of data should be assessed, when available, to confirm this pattern. (Population Health Management 2013;16:221–226)
Introduction
A number of approaches have been taken with worksite health promotion programs. These include health monitoring through personal health assessment tools and health risk screening, health education and recommendations for behavior change and medical care, financial incentives, health coaching, and company wellness activities, among others. Most programs use a combination of approaches that best suit their employees.
The current study will consider a program that offers a Personal Wellness Profile (PWP) and Healthy Lifestyle Wellness Program challenges (Wellness Program). Participation is motivated by financial incentives. The purpose of the study is to characterize who participates in the PWP and Wellness Program, and to identify whether an association exists between participation and trends in number of health care services and cost of services per person.
Methods
Study population
A retrospective cohort study design was employed using medical claims data from the Deseret Mutual Benefit Administrators (DMBA), a health insurance company for employees of the Church of Jesus Christ of Latter-day Saints and their spouses and dependent children. The company was established in 1970 to provide health insurance and retirement income to Church employees and their families. Electronic claims data were available for the years 2004 through 2009. There were 97,610 unique members enrolled in one of the Deseret Mutual medical plans (Deseret Choice, Deseret Select, Deseret Premier, Deseret Value, and Deseret Protect) during this time period. Of these, 25,902 were contract holders, 20,631 were spouses, and 51,077 were dependent children. Of the contract holders, 10,721 (41.4%) were enrolled at some point in each of the 6 years covered by this study. These individuals were significantly older (mean=46.7 [SD=10.0] vs. mean=39.9 [SD=13.6], P<0.001), more likely to be male (71.3% vs. 60.3%, P<0.001), and more likely to be married (84.0% vs. 71.7%, P<0.0001). Analyses were based on the contract holders enrolled for all 6 years.
The majority of contract holders employed over the 6-year study period resided in Utah (73.8%), followed by Idaho (10.3%), Hawaii (3.0%), and Arizona (1.5%).
Healthy lifestyle Wellness Program
Starting at the beginning of 2007, employees were eligible for a bonus by participating in the Wellness Program. The Wellness Program was offered 4 times in 2007 and 6 times per year in 2008 and 2009, with each involving a 2-month challenge that focused on healthy behavior change. Eligible participants earned $25 toward a year-end medical premium refund for each challenge they completed successfully.
Personal health assessment
The participant also received a bonus for filling out a PWP by Wellsource, Inc. 15 The PWP was intended to help employees better understand their health risks and the association between health behaviors and health risks. It was a self-reported questionnaire that employees completed online. Beginning in 2007, each employee was eligible for a $25 premium refund for completing the PWP. This increased to $50 in 2008 and 2009. The PWP questions related to the employee's personal health history, height and weight, current symptoms, physical activity, eating practices, alcohol and drug use, smoking, stress and coping, safety, and medical care. Since 2008, the entry of biometric information (ie, total cholesterol, high-density lipoprotein, low-density lipoprotein, triglycerides, blood glucose, blood pressure) also was required to receive the bonus. After an employee completed the PWP, a personal report was displayed that identified health risks and suggested preventive actions that could be taken. The report also showed recommended preventive exams and items for the employee to discuss with his or her physician.
Participation
Overall, 3301 (30.8%) employees completed the PWP 1 or more years during 2007 through 2009 (14.9% one year, 7.4% two years, and 8.4% three years) and 3347 (31.2%) participated in the Wellness Program in 1 or more of those years (10.6% one year, 8.5% two years, and 12.1% three years); 24.4% participated in both the PWP and Wellness Program, 6.4% completed only the PWP, and 6.8% participated only in the Wellness Program. Over the study period a total of 16 wellness activities and 3 PWPs could be completed.
Medical claims data
Medical claims data were available from 2004 through 2009. For 2004 through 2008, the claims were incurred in the year and paid through August of the following year. For 2009, the claims were paid through June of 2010. These are medical claims and do not include prescription drugs. Each claim is the original claim submitted and does not include reversals or adjustments. Claims are included that were later denied for payment by DMBA (∼3.8%). United States medical cost inflation, annual average, was used to adjust all claim dollar amounts to 2009 dollars. 16 The medical claims data contain the amount charged by the provider prior to any co-pays, deductibles, or coinsurance being applied. This should make the study less sensitive to changes in plan benefits.
Database linkage
Each database was de-identified according to Health Insurance Portability and Accountability Act guidelines. A unique number was assigned to each individual, which allowed the data sets to be linked. The current study was classified as low risk and was determined to be exempt from the need for informed consent by the institutional review board at the University of Utah.
Statistical techniques
Characteristics of contract holders enrolled in DMBA are summarized using frequency distributions. Participation in the PWP or Wellness Program was classified according to number of years of participation during 2007 through 2009. A dichotomous variable was created that reflected participation in any or all 3 years compared with no participation. The generalized linear model was used to assess the association between participation and selected demographic variables, as well as average annual number of services and average annual cost per person. Trends in annual average number of services and cost per person were evaluated using logarithmic regression models. The Estimated Annual Percent Change (EAPC) in trend was calculated by fitting a regression line to the natural logarithm of the means using calendar year as a regressor variable; that is, Ln(mean)=a + b×year. The EAPC=100×(eb – 1). Statistical significance and confidence intervals were based on the 0.05 level. Statistical analyses were derived from SAS software, version 9.2 (SAS Institute Inc., Cary, NC).
Results
The distribution of contract holders enrolled through the study period is presented for selected variables in Table 1. A majority of contract holders were in the age range of 40–59, were male, and were married. The higher the age group, the lower the participation, whereas the higher the income, the higher the participation. Participation was greater among women and among married people. In addition, a strong association existed between PWP and Wellness Program participation.
Source: Deseret Mutual Benefit Administrators data.
For each model, the prevalence ratios and 95% confidence intervals for the variables were estimated simultaneously.
Classified according to the employee's age at the start of the study, 2004.
CI, confidence interval.
Boldface indicates statistical significance.
Those who utilized more health care services in 2004 through 2006 were significantly more likely to complete the PWP at least once during 2007 through 2009 (Table 2). However, participation in the Wellness Program was not significantly associated with number of services. A similar result is seen for cost per person, with the exception that those with average annual costs in the highest quartile were less likely to participate in the Wellness Program.
Source: Deseret Mutual Benefit Administrators data.
Adjusted for age, sex, marital status, and annual income; †Adjusted for age, sex, marital status, annual income, and PWP participation.
CI, confidence interval.
Boldface indicates statistical significance.
Trends in the average number of services and cost per person are presented across the study period according to whether the employee completed the PWP in at least 1 year, or participated in the Wellness Program at least once during 2007 through 2009 (Fig. 1). The averages upon which the trends are based were adjusted for age, sex, marital status, and annual income. With the exception of the trend line for average number of services being greater for PWP compared with non-PWP participants and being very similar for Wellness Program compared with non-Wellness Program participants, PWP and Wellness Program participants had a lower trend line. Estimated annual percent change in average number of services and average cost per person are presented according to PWP and Wellness Program participation (Table 3). Each of the increasing slopes was statistically significant. Average number of services and average cost per person increased slightly more for PWP compared with non-PWP participants. Average number of services and average cost per person increased at a lower level for Wellness Program participants compared with non-Wellness Program participants.

Average annual number of services and cost per person according to Personal Wellness Profile (PWP) and Wellness Program status. Source: Deseret Mutual Benefit Administrators data. Means adjusted for age, sex, marital status, and annual income.
Source: Deseret Mutual Benefit Administrators data.
The trend data were adjusted by age, sex, marital status, and annual income.
Trends in the average number of services and cost per person also are presented across the study period according to at least 1 year of participation during 2007–2009 in the PWP only, the Wellness Program only, both the PWP and Wellness Program, and neither (Fig. 2). The highest average number of services and the highest average cost per person occurred in the PWP only group. For average number of services and average cost per person the increasing EAPC was greatest for the PWP only group (Table 4).
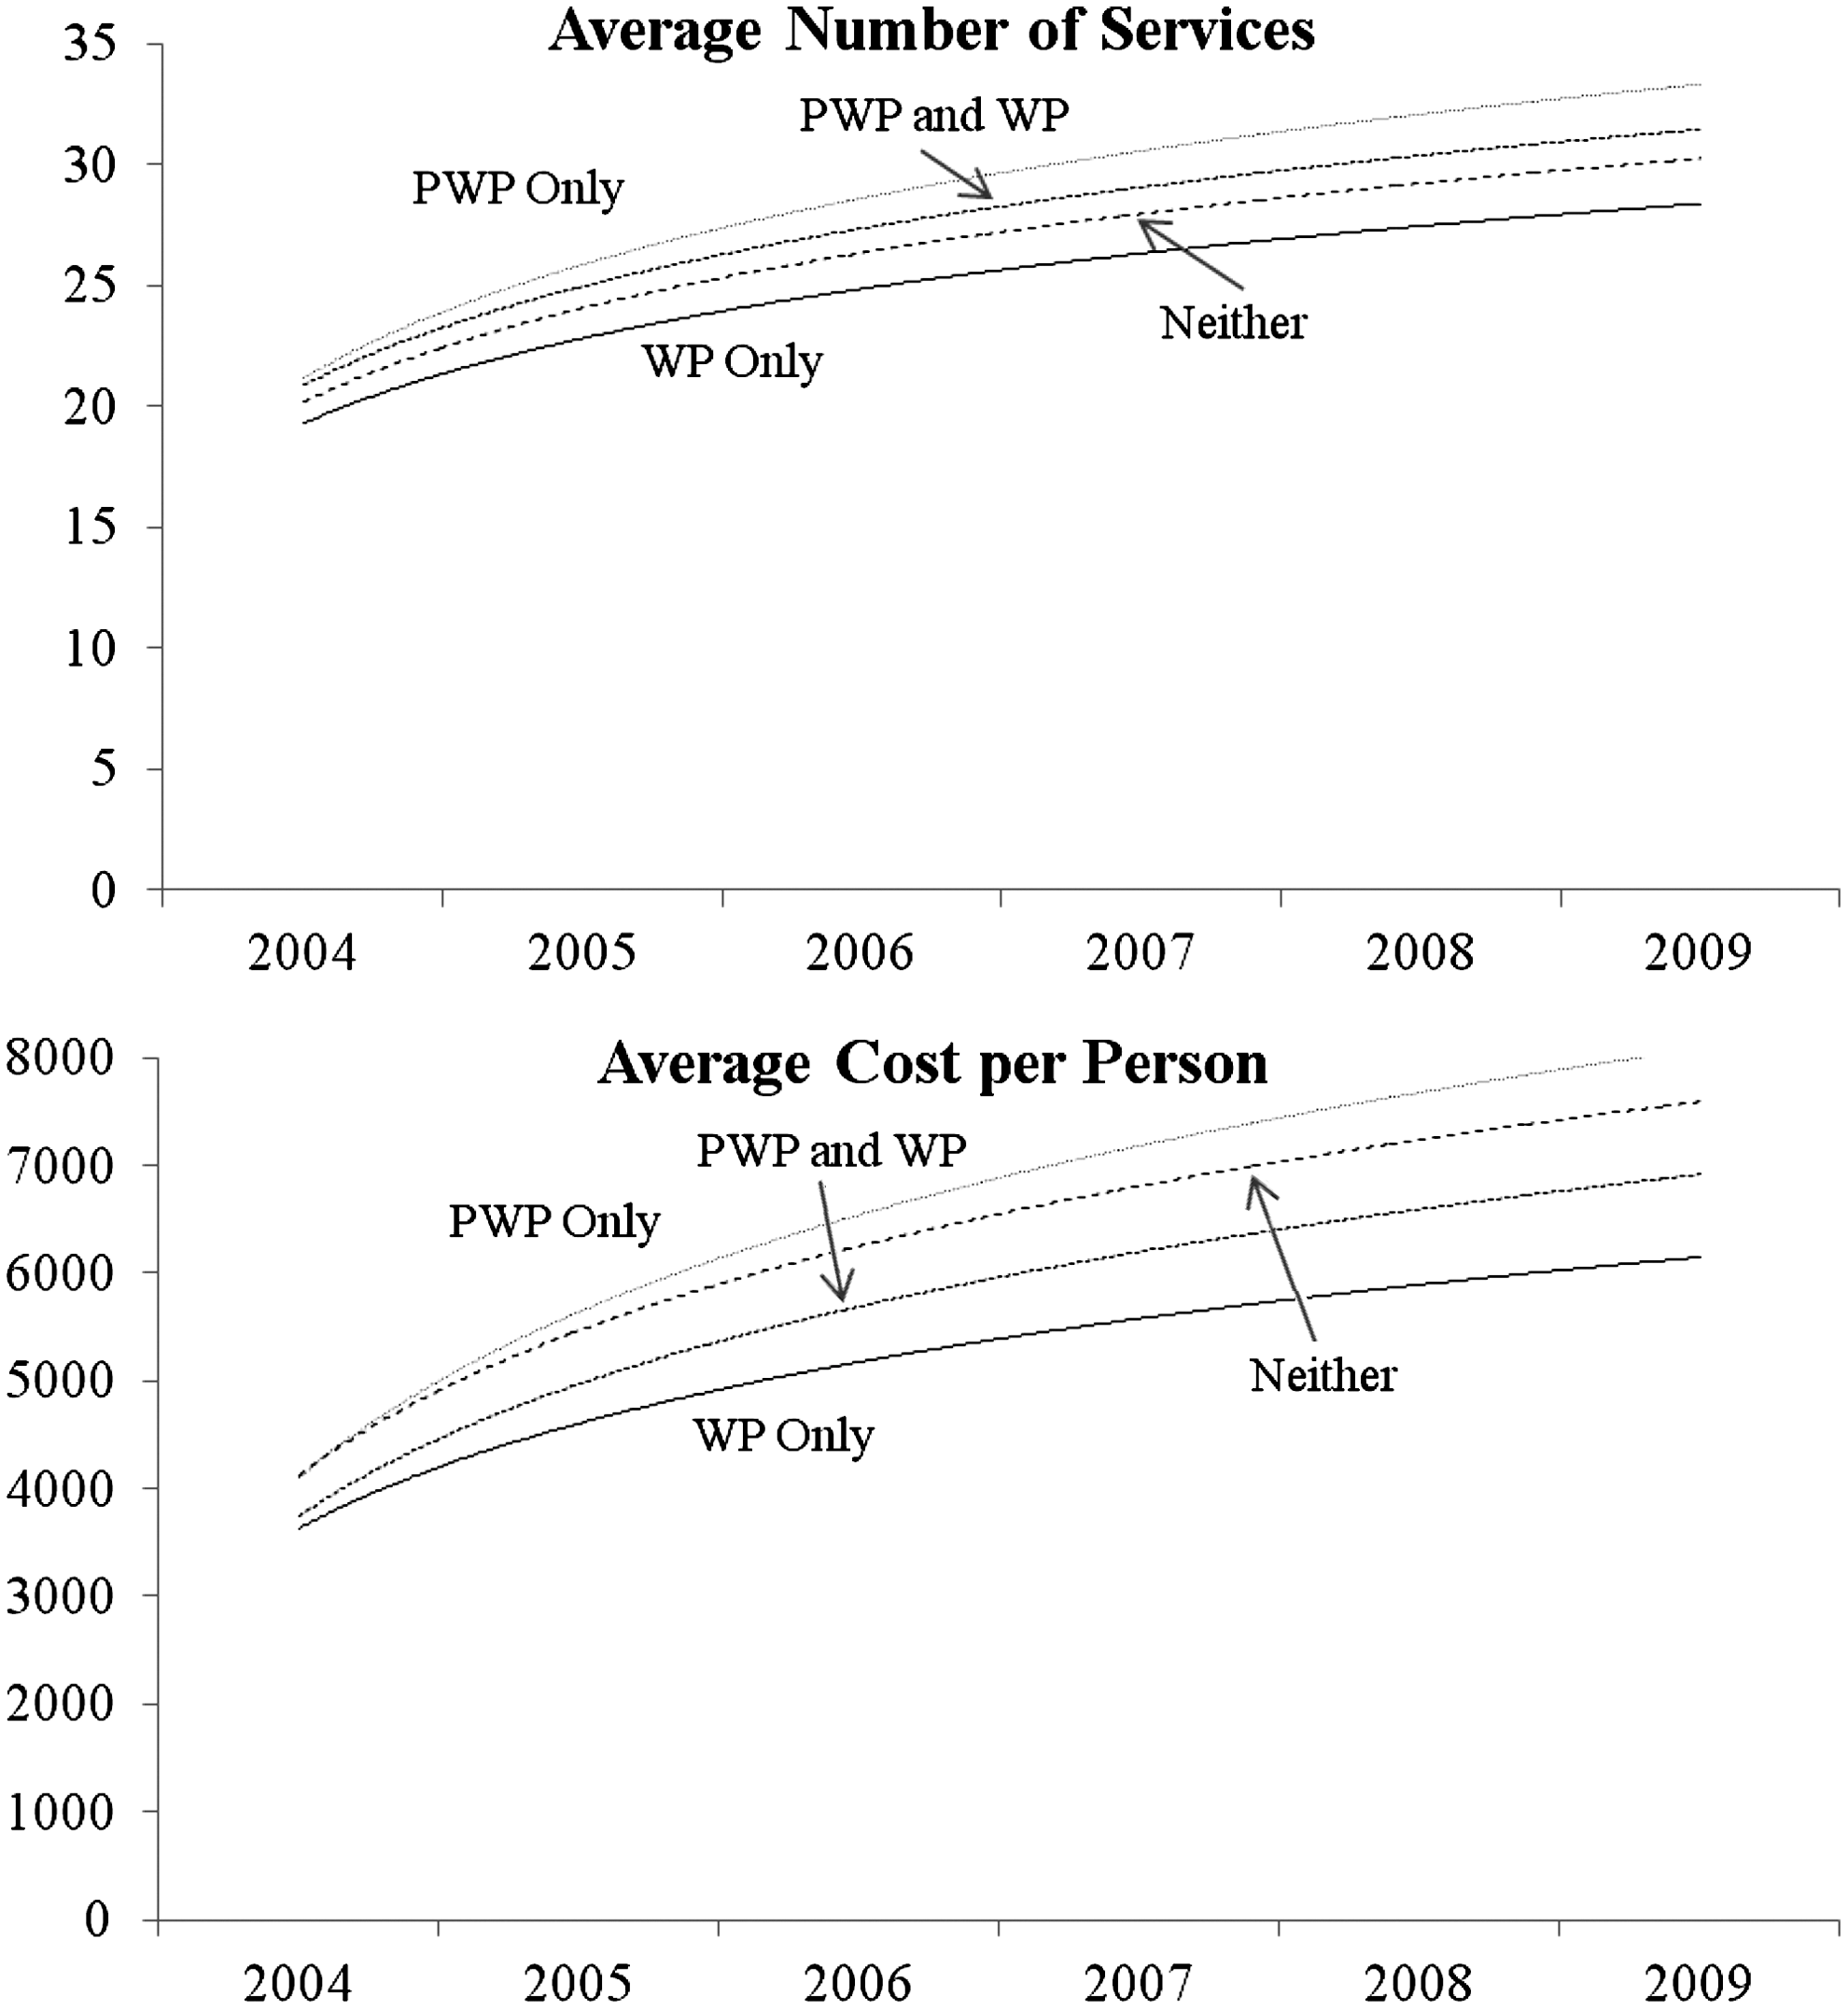
Average annual number of services and cost per person according to Personal Wellness Profile (PWP) only, Wellness Program (WP) only, both PWP and WP, and neither. Source: Deseret Mutual Benefit Administrators data. Means adjusted for age, sex, marital status, and annual income.
Source: Deseret Mutual Benefit Administrators data.
The trend data were adjusted by age, sex, marital status, and annual income.
PWP, personal wellness profile; WP, wellness program.
Discussion
Above 30% of contract holders participated in the financially incentivized PWP and Wellness Program. Participation in the PWP and Wellness Program were lower in the older age groups and higher among women, as consistent with previous wellness studies. 17 –19 Lower levels of participation in the Wellness Program among older employees may be explained by their experiencing more health problems and physical limitations. However, it is unclear why older age would be associated with lower levels of participation in the PWP. It may be that older employees receive more direct care from a physician and do not feel the need to participate in the PWP.
In a previous study involving insured employees younger than age 65, women were significantly more likely than men to file health care claims for cancer-related diagnostic workups. 20 In the United States, research has shown that women in general tend to be more health conscious in the sense that they are less likely to use illicit drugs, binge drink, or smoke cigarettes. 21 They also are more likely than men to have health insurance and to have access to regular and consistent medical care. 21 In addition, it may be that women are more motivated than men by the financial incentives and social support from Wellness Program participation.
Being married was positively associated with PWP and Wellness Program participation. People who choose to marry may be more health oriented; marriage may contribute to better health practices. A synthesis of the literature concluded that marriage is linked to improved mental health, increased likelihood of having health insurance coverage, and possibly better long-term physical health, primarily in men. 22
Those making less than $40,000 per year were significantly less likely to participate in the PWP or Wellness Program. There is also some evidence that participation is lower for those with incomes of $100,000 or more compared with those with middle incomes. Although the financial incentives for participation may be less of a motivation for those in the highest income group, it seems that the financial incentive should have the largest impact on those in the lowest income category. However, it may be that these employees tend to have more physically demanding jobs (eg, maintenance and custodial workers), and are thus less attracted to the PWP and wellness challenges. 13 Lower education associated with the lower paying jobs also may be associated with lower levels of participation. 23
Those who received more services and had greater costs per person during 2004 through 2006 were more likely to participate in the PWP once it became available in 2007 through 2009. This is consistent with a previous study that also showed an initially positive association. 3 Higher levels of services and corresponding greater cost per person may be associated with them being more health conscious (ie, participating in more health screenings and diagnostic workups). On the other hand, those who had a higher annual average cost per person in 2004 through 2006 were less likely to participate in the Wellness Program. Perhaps health constraints limited involvement in the wellness challenges for some of these people.
An increase in the average number of services received was observed over the study period for all employees, but more so for those who participated in 1 or more PWP during 2007 through 2009. This is likely because the PWP results would indicate areas for which further screening and diagnostic work would be in order. The initially lower level of average cost per person indicates healthier people are self-selecting into the Wellness Program. In addition, the lower rate of increase in the trends for average cost per person among those in the Wellness Program indicates that the Wellness Program is effective at slowing escalating costs. Additional years of data should be assessed, when available, to confirm this pattern.
A previous report assessed changes in health risks over time among those DMBA employees completing the PWP (J. Hull, unpublished data, 2010). For example, from 2008 through 2009 small improvements were observed in 7 of 12 clinical tests: systolic blood pressure (0.1%), total cholesterol (2.6%), triglycerides (1.4%), body mass index (0.4%), percent body fat (1.8%), waste/hip ratio (0.1%), and waist girth (0.1%). There also were positive changes that involved reduced cancer risk, better nutrition, better fitness, better handling of stress, improved substance use, improved safety habits, lower smoking/tobacco use, less alcohol consumption, lower cholesterol, improved aerobic score, better seat belt use, improved happiness, improved sleep habits, and fewer sick days. However, this information is only available for those who took the PWP. The current study compares those who participated in the PWP and Wellness Program to those who did not. Hence, medical claims information was used as a stand-in for health status.
Conclusions
Selection into completing the PWP and participating in the Wellness Program is associated with frequency and costs of health care claims. Those submitting more claims and incurring higher costs were more likely to complete the PWP but less likely to participate in the Wellness Program. There is little, albeit some, evidence that the PWP and Wellness Program are resulting in more than helping individuals maintain their current health status. However, because the PWP and Wellness Program have been available for only 3 years, it may be too soon to see noticeable beneficial effects on lowering health care costs.
Footnotes
Disclosure Statement
Mr. Hull is an employee of Deseret Mutual Benefit Administrators, which provided the claims data used in this analysis. Dr. Merrill and Mr. Hull disclosed no conflicts of interest with respect to the research, authorship, and/or publication of this article. The authors received no financial support for the research, authorship, and/or publication of this article.