




Abstract
A central goal of accountable care organizations (ACOs) is to improve the health of their accountable population. No evidence currently links ACO development to improved population health. A major challenge to establishing the evidence base for the impact of ACOs on population health is the absence of a theoretically grounded, robust, operationally feasible, and meaningful research design. The authors present an evaluation study design, provide an empirical example, and discuss considerations for generating the evidence base for ACO implementation. A quasi-experimental study design using propensity score matching in combination with small-scale exact matching is implemented. Outcome indicators based on claims data were constructed and analyzed. Population health is measured by using a range of mortality indicators: mortality ratio, age at time of death, years of potential life lost/gained, and survival time. The application is assessed using longitudinal data from Gesundes Kinzigtal, one of the leading population-based ACOs in Germany. The proposed matching approach resulted in a balanced control of observable differences between the intervention (ACO) and control groups. The mortality indicators used indicate positive results. For example, 635.6 fewer years of potential life lost (2005.8 vs. 2641.4; t-test: sig. P < 0.05*) in the ACO intervention group (n = 5411) attributable to the ACO, also after controlling for a potential (indirect) immortal time bias by excluding the first half year after enrollment from the outcome measurement. This empirical example of the impact of a German ACO on population health can be extended to the evaluation of ACOs and other integrated delivery models of care.
Background
H
To examine the impact of Triple Aim initiatives, the Institute for Healthcare Improvement (IHI) proposes a series of outcome indicators. 1,5 However, limited information is provided on the evaluation design and how causal inference can be enhanced. In practice, a wide variety of approaches may be found. 6 –9 Claims data have been used extensively to assess quality and safety of care so far, 10 but challenges of their usability in measuring Triple Aim outcomes require further studies.
This article aims to provide guidance on a robust evaluation design to measure the impact of ACOs on Triple Aim outcomes by using claims data. The evaluation design is applied to the GKT ACO. The focus will be on population health indicators, corresponding to the first Triple Aim dimension; the other 2 Triple Aim dimensions are addressed elsewhere. 11 –13 In this article, population health is defined as the health of the population of insurees attributed to the ACO by contract.
Specifically, this study aims to
• Identify an appropriate study design for evaluating population health outcomes of ACOs on the basis of claims data.
• Discuss methodological implications and the feasibility of the approach to evaluate ACOs using routine data from the ACO GKT.
• Evaluate the impact of the ACO GKT on population health.
• Provide guidance to future evaluations of ACO impacts on population health using routine data sources.
Methods
Study setting for the empirical application
The ACO GKT is located in a rural area in southwest Germany. Its central entity is the Gesundes Kinzigtal GmbH—created in 2006 and jointly owned by a long-established local physician network and the health care management company, OptiMedis. A long-term (10 years) shared saving contract with 2 statutory health insurers (SHIs)—the AOK Baden-Württemberg (AOK BW) and the LKK Baden-Württemberg (LKK BW)—ensured financial stability that allowed for long-term planning and implementation of population health interventions. The scheme covers about half of the region's population, corresponding to 32,595 insurees. The GKT concept is based on the cross-sectoral cooperation of physicians, hospitals, social care, nursing staff, therapists, and pharmacies; the involvement of all stakeholders in the community; and the encouragement of patients to actively participate in prevention and care. The patients' free choice of health care providers remains unrestricted. Patients may seek care services from any legally accredited provider regardless of whether the provider (eg, a general practitioner) does or does not have a contract with GKT. 14 Besides general care management, the range of GKT activities includes a set of community initiatives, specific financial incentives for cooperating providers, and about 20 preventive and health promotion programs for specific conditions, which are described in detail elsewhere. 14
The GKT focus on population health management toward the Triple Aim is realized through a data-driven approach, utilizing internal monitoring 8,15,16 and external evaluations. 12,17
Data source
The study is based essentially on claims data as it has been shown that they are valuable in assessing quality and safety of care 10 and they have the advantage of being easily and widely accessible in electronic form without the need for additional documentation, 5 an important factor in times of excessive external performance reporting requirements. 18
GKT obtains deidentified insuree-level master data of the 32,595 insurees (AOK BW = 31,101 in July 2014, LKK BW n = 1494 in January 2014) covered by the shared savings contract and associated data on outpatient care, hospital stay, prestationary and poststationary services, outpatient surgery, work incapacities, drugs or nonmedicinal remedies and aids, prevention, rehabilitation, and long-term care services from the 2 cooperating SHIs. From this group, 9568 (AOK BW = 9130 and LKK BW = 438 in October 2014) are enrolled in the ACO (ACO enrollees, see Fig. 1). Enrollment is voluntary and allows for special offers by the ACO and participation in 1 or more of the 20 special GKT health programs, where indicated or when certain requirements are fulfilled.
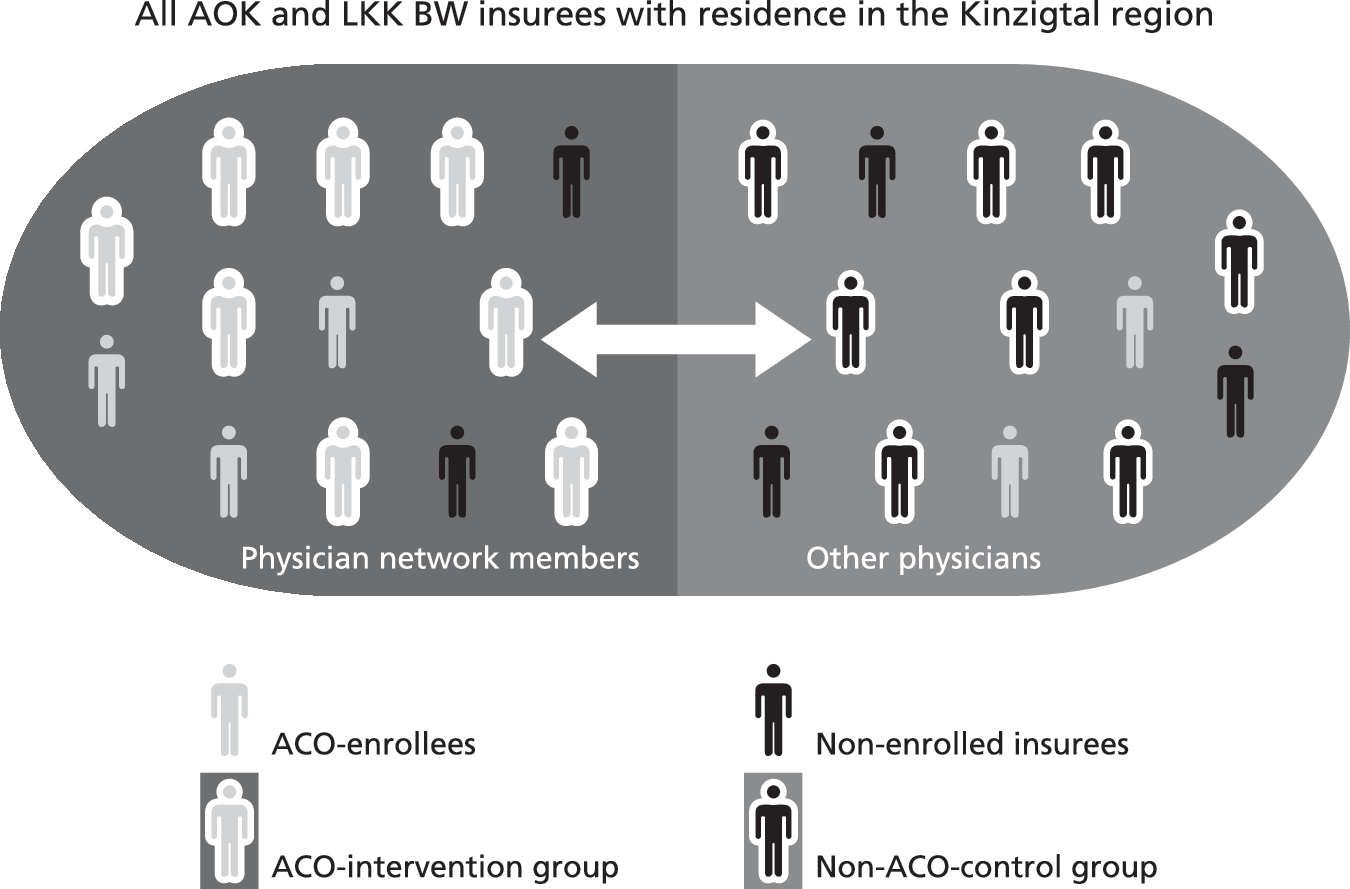
Study setting Gesundes Kinzigtal: total population and subgroups. ACO, accountable care organization; AOK BW, AOK Baden-Württemberg; LKK BW, LKK Baden-Württemberg.
This study limited the study group to ACO enrollees actively enrolled in the years 2006 to 2009 (n = 6922); 2006 was the first year of enrollment at GKT and 2009 was the last year included to ensure 4 years of after intervention time points for each ACO enrollee. Overall data for the years 2005 (baseline for 2006 ACO enrollees) to 2013 (fourth intervention year for 2009 ACO enrollees) were utilized in this study.
Study design
Potential evaluation designs for assessing ACO impact
The large number of possible evaluation designs can be divided into 3 categories: experimental, quasi-experimental, and nonexperimental. Experimental designs typically involve randomization, manipulation of independent variable(s) and control, and are usually longitudinal and prospective. Quasi-experimental designs also include manipulation, but lack the full control established in experimental designs as a separate control group might be missing or not assigned by randomization. Designs not fitting into these 2 classes can be considered as nonexperimental; they do not involve manipulation, randomization, or control groups. 19
Suitability of an evaluation design is mostly dependent on the research question and the context of the application. Nonexperimental designs are most appropriate for exploratory, descriptive, or correlational research questions. 19 The present study aims to analyze the cause-and-effect relationships of ACO intervention and its impact on population health in a counterfactual approach to causality 20 ; nonexperimental designs are inadequate and can be excluded from the present discussion.
Increased confidence of cause-and-effect relationships requires true or quasi-experimental designs. 21,22 True experimental designs, also referred to as randomized controlled trials (RCTs), are regarded as the gold standard for evaluating the effectiveness of health care interventions. 21 Individually randomized parallel group designs often are not feasible in population-level interventions because of the risk of contamination; that is, it is practically impossible for an ACO to train physicians (eg, in shared decision making) and then limit the application of the new knowledge and capacity to a selected group of patients for the same medical office. As a result, the control group will be impacted by the experience of the physician or his/her organization. 21,22
In case of a high likelihood of such contamination, cluster randomized controlled trials (c-RCTs) could be an option to separate intervention and control groups, where randomization is realized on the level of organizations or individual physicians. 21,22 However, c-RCTs are much more complex, and the number of cases must be much higher to account for the design factor resulting from the assumed intracluster correlation. In addition, in practice, it is difficult to recruit enough suitable organizations for comparison. 21 Other options for randomization exist, such as stepped wedge designs, preference trials, randomized consent designs, or N-of-1 designs. 22 In addition to these options—all variants of the traditional RCT that seek to maximize internal validity—pragmatic trials put stronger emphasis on the external validity (generalizability) of results. To achieve this, interventions are conducted under conditions that resemble normal practice (moving away from ideal settings and highly selected participants) and that allow leeway in implementing the intervention rather than strictly enforcing a study protocol. 23
Despite this multitude of RCT designs, the majority are not adequate enough to evaluate the impact of ACOs, the main reason being the irreversibility of the intervention and its application to the entire population at the same time and not in different steps. In addition, evaluators usually have no access to sufficient numbers of suitable organizations or regions for the purpose of comparison. Ethical reasons or costs of RCTs also can be an obstacle. 21,22 ACOs aim to improve efficiency in comparison to standard care and are not designed as research projects. ACOs with a shared savings contract, such as GKT, must be economically viable for providers and SHIs. In this circumstance, complex RCTs are not always the preferred option. 11,24
Quasi-experimental designs share the purpose of true experiments, testing the cause–effect relationships, but because they lack full experimental control and randomization, they are more vulnerable to threats of internal validity. 19,21,22 A multitude of quasi-experimental designs try to control these biases, and while discussing them in detail goes beyond the scope of this article, a few design characteristics might be worth noting as they allow a better understanding of the present study's selection of the evaluation design and the possibilities of reducing biases (as can be seen in the scheme by Shadish, Cook, and Campbell 19 ): designs without control groups, designs without pretest indicators, and combination designs. 25
Designs without control groups: A posttest-only design (observation only after the intervention) can be improved by pretest indicators if no control group is available. 25 Such a design with 1 measurement point before and after an intervention implemented in the same study site(s) is usually called an uncontrolled before and after study. In interrupted time series (ITS), additional pre- and posttest indicators are added. Although ITS, combined with appropriate statistical methods (time series regression models, autoregressive integrated moving averages modeling), reduce the threat of statistical regression or misinterpretation of underlying secular trends or cyclical effects, they do not provide protection against distortive external effects, 21,25 such as systematic inexorable advances in (medical) technology or changes in the external provider structure.
Designs without pretest indicators: On the other hand, studies in which ACOs lack data for pretest indicators could improve posttest-only designs through a control group. In such a situation, a nonequivalent control group might be used. However, these designs are prone to a selection bias (ie, subjects in the intervention group differ from those in the control group with regard to morbidity and social status, among other factors 25,26 ).
Combination designs: Whenever possible, a simultaneous use of pretest indicators and control groups is desirable. A study for which data are collected at 1 time point before and after the intervention is referred to as a controlled before and after study. Multiple data collection points are preferable 21,25 (control group ITS). The GKT claims database allows for such a design. Nonetheless, these combined designs also are susceptible to selection bias because they are not based on true experimental (randomized) data. Researchers rely on sophisticated statistical methods of bias control in quasi-experimental studies. 26 Commonly used are matched-pair approaches (eg, exact matching, propensity score matching [PSM], genetic matching), where possible distortions of a selection bias are minimized by taking into consideration observable risk factors. Insurees of the intervention group are compared with a control group with statistical twins of the same age, sex, morbidity, costs, and social status, among other factors. 27
The present study at GKT also adopted a matched-pair approach; the empirical application will be described in more detail in the following section.
Evaluation design chosen for empirical application in GKT
A matched-pair approach was chosen for the GKT population health study, in light of the practical, economical, and ethical shortcomings of RCTs. Existing claims data allowed for multiple before and after intervention time points, as well as the integration of a control group. For the purpose of this study, the study group was limited to ACO enrollees actively enrolled in the years 2006 to 2009 (n = 6922). The untreated matched pairs (Non-ACO control group) are drawn from the AOK and LKK BW insurees who also live in the region of Kinzigtal, but who are not enrolled in the ACO and are not primarily treated (less than 49% of their physician cases) by GKT contractual primary care physician network members (Nonenrolled insurees) (Fig. 1). Nonetheless, Non-ACO control group subjects also might access some ACO interventions, such as specialist treatment, seminars for patients on literacy and patient empowerment, occupational health management, and additional physician activities offered in sports clubs and gyms, a bias that needs to be considered.
Because of the limited available data set from which statistical twins may be drawn, a PSM approach was preferred over an exact matching approach. In the case of a limited data set, exact matching approaches, otherwise often the better option, 28 can lead to the exclusion of a relevant number of cases in the matching process and/or to the necessity to abandon covariates. The potential resulting bias can cause a more important distortion than less exact matched pairs (by PSM), but a more complete set of insurees. 28,29 However, exact matching and PSM can be used effectively in combination 28 ; therefore, the present GKT study combines the PSM with small-scale exact matching, thus achieving better matching with an acceptable level of exclusion of cases, as already seen in an earlier GKT study. 16
PSM is based on a logistic regression that estimates the conditional probability (propensity score) of an insuree to be an ACO enrollee on a scale from 0 to 1 using multiple predictors (Table 1) from a base year (the year preceding ACO enrollment). The calculated propensity score is used to find adequate pairs in a nearest neighbor approach. A maximal difference of ±0.01 (∼0.2 standard deviations) in caliper is thereby tolerated between the propensity score of the insuree in the ACO intervention group and its statistical twin in the Non-ACO control group. 29,30
ACO, accountable care organization; PSM, propensity score matching.
Following the recommendation of Stuart, 28 PSM is also combined with a small-scale exact matching, including the (socio-)demographic covariates of age, sex, and the person's SHI and insurance status; and the morbidity-related covariate Charlson score 31 (Table 1). As the LKK BW insured represent a special community, including mainly farmers (active insured or pensioner) and their family members, the research team considered it appropriate to do the matching only within the same SHI. In addition, the social gradient of health 32 has been taken into account in the exact matching by the person's insurance status. The insurance status provides certain information about income, considered one of the best predictors for socioeconomic status related to health. 32 For the matching, 4 classes were formed: compulsorily insured persons, voluntarily insured persons, the unemployed, and others. Whereas the salaries of voluntarily insured persons usually exceed the annual contribution income threshold (53,550 € per annum in year 2014), compulsorily insured persons must have earnings below this threshold, and the unemployed are a special income group.
Because of the low-prevalence criteria, rare diseases may be excluded from the PSM. As they are often associated with high morbidity and potential mortality, the Charlson score was used in the exact matching approach to adjust for that. A maximum difference of ±1 is allowed in the matching.
The research team used a 1:1 matching, meaning that 1 ACO intervention group subject is matched to 1 Non-ACO control group subject(s). In the limited data set, this will lead to an improved bias reduction. The matching is done without replacement as greedy matching: the first nearest Non-ACO statistical twin is selected, even though this twin might be a better match for another ACO subject. This would be taken into account in an optimal matching approach.
30
However, because optimal matching does not produce better balanced matched samples than greedy matching,
33
and greedy matching can be realized in an easier and faster way, the team decided to use greedy matching. To avoid the immortal time bias,
34
only Non-ACO subjects who are still alive at the time of enrollment of the ACO subjects are matched. Additionally, the team applied data quality criteria to prevent a data quality bias (Table 1). These criteria resulted in a loss of 501 ACO enrollees (7.2%). An additional 1010 (14.6%) ACO enrollees had to be excluded from the analysis because no adequate matched pair could be found, resulting in an analytic sample of 5411 insurees in both the ACO intervention group and the control group (Supplementary Appendix Table S1; Supplementary Data are available online at
To assess the quality of the matching, the research team compared the categorical variables between groups of patients concerned with diagnosis or medication pre and post matching. 35
For metric variables, it is recommended that arithmetic mean and standard deviation pre and post matching are compared, and standardized differences between groups are indicated. The standardized difference can serve as an indicator for the matching balance: the lower the value, the better the balance, 35,36 where ±10 is assumed to be good balance. 36
To estimate the impact of the ACO GKT on population health, the research team constructed and analyzed outcome indicators derivable from claims data.
Outcome indicators
Based on the IHI recommendations, 5 the research team adapted the following outcome indicators for the population health dimension for the study, taking into account restrictions related to the use of claims data.
• Mortality ratio (observed number of deaths/total of subjects in the studied population) is widely recognized as a simple, manipulation-resistant surrogate parameter for outcome quality and patient benefit. 5,37 With a fixed cohort study design (no new subjects to enter the study), an increase of the mortality ratio over time should be anticipated: members of the group are going to die anyway at some point in time, and the intervention can only postpone the time of death. This issue is better dealt with by other mortality indicators as they either compare the age of death to the expected time (life expectancy [LE]) and deduct the potential lost lives or look directly at survival time.
• Age at the time of death (statistically expected number of years of life in the studied population) is used to predict LE. 5
• Years of potential life lost and gained (YPLLG) is an adapted individually age-adjusted YPLL indicator. YPLL measures potential life lost because of premature death (ie, a person with a mean LE of 75 years dying at age 65 represents 10 years lost). 5,38 For the YPLLG indicator, LE is calculated for individuals using the generations' LE tables of the German Federal Statistical Office, 39 also accounting for potential life years gained. A person with an individual LE of 98 years dying at the age of 100 will contribute 2 years gained, a fact not reflected in the YPLL. Thus, this adapted YPLLG indicator aims to improve accuracy.
• Survival time (time between the start of the observation [enrollment in the ACO] and the end of the study period or an event [death]) estimates the probability of a study insuree's survival in a given time interval, measured by the Kaplan–Meier method. 40
A few considerations must be made regarding mortality indicators. As death is an irreversible end point, logically no pretest data can be collected (although it might be useful to have other pretest data for the matching approach and analysis). The status of the subject as being alive at the time of recruitment 25 is taken into consideration for Non-ACO subjects in the control group to avoid an immortal time bias 34 as only Non-ACO subjects still alive at the time of enrollment of the ACO subject may be matched. 34 In addition, an indirect immortal time bias may occur: this is the case for GKT physicians usually deciding against enrollment of terminally ill patients in the ACO as it represents additional stress and little benefit for these patients, 16 leading to the fact that patients with a high risk of imminent death are present in the control group rather than the intervention group. To control for this indirect immortal time bias, it is recommended to exclude the first half year after the start of the intervention. The research team allowed for this bias by differentiating the results of the first year after intervention in the analysis.
Results—Empirical Application: Gesundes Kinzigtal
Effectiveness of the matching approach
To assess the quality of the matching, the research team compared the categorical variables between groups of patients concerned with diagnosis or medication. For the top 40 diagnoses, the intergroup differences could be reduced from a maximum of 31.3% pre matching to a maximum of 2.1% post matching.
For metric variables, the team compared arithmetic mean and standard deviation pre and post matching and standardized differences between the groups. The before and after matching comparison confirms the requested equalization between the ACO intervention group and the Non-ACO control group in all variables and all enrollment years. No standardized difference post matching is greater than ±10. The maximum standardized difference post matching is −8.3 for insured person days in the 2009 cohort. Tables 2 and 3 show the results in detail for the year 2006.
ACO, accountable care organization.
ACO, accountable care organization.
Tables for all years and further analysis can be found at Schulte et al. 8
Impact of the ACO GKT on population health
Table 4 summarizes the differences of the population health outcome indicators—mortality ratio, age at the time of death, and YPLLG—for the ACO intervention group versus the Non-ACO control group. Mortality rates are lower in years 1 to 3, but higher in year 4 in the ACO intervention group. In total, over the 4 years, 222 insurees (4.1%) in the ACO intervention group die and 266 (4.9%) in the Non-ACO control group die, thus 44 fewer insurees die in the ACO intervention group. Differences are not significant (chi-square: P > 0.05). In addition, after exclusion of the first 6 months after enrollment (an adjustment to avoid an indirect immortal time bias), the results stay similar (33 less deaths).
ACO, accountable care organization; LE, life expectancy; YPLLG, years of potential life lost and gained.
Because of the shortcomings of the mortality ratio indicator discussed, this study will further concentrate on the other proposed outcome indicators. The average age at time of death is 1.4 years higher in the ACO intervention versus the control group (78.9 vs. 77.5). Over the considered period of 4 years (excluding the first 2 quarters to avoid an indirect immortal time bias), the YPLLG indicator showed 635.6 fewer YPLL in the ACO intervention group (2005.8 vs. 2641.4 years of potential life lost; t test: sig. P < 0.05*).
Figure 2 shows that the survival time estimated by using the Kaplan–Meier method is 6.7 days higher in the ACO intervention group (1433.8; 95% CI: 1430.3–1437.3) than in the Non-ACO control group (1427.1; 95% CI: 1423.0–1431.2) when censoring the deceased within the first 182 days and insurees who switched to another SHI (not significant at log rank >0.05, log rank = 0.082). When not censoring the first half year, the results are significant at the 0.05 level (log rank = 0.03). The ACO intervention group (1430.1; 95% CI: 1426.2–1434.1) has a 9.4-day longer survival time than the Non-ACO control group (1420.7; 95% CI: 1415.9–1425.5) in that case.
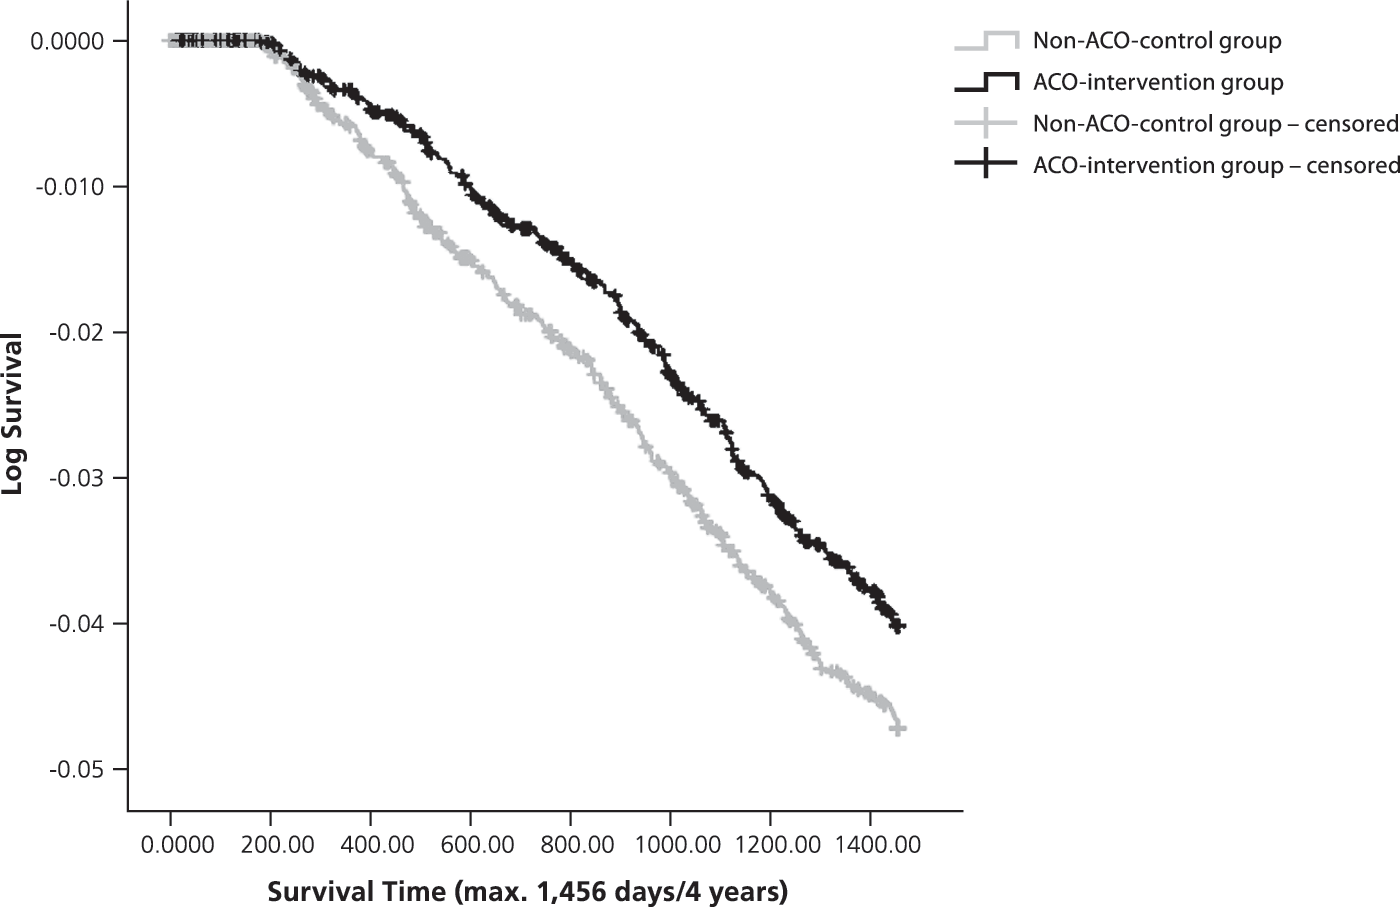
Log survival function ACO intervention group versus Non-ACO control group (log scaled, survival time in days, max. 1456 days, censoring the deceased within the first 182 days, as well as insurees who switched to another statutory health insurer. ACO, accountable care organization.
Discussion
The evaluation approach described in this article considers the complexity of evaluating the impact of ACOs on the population health Triple Aim dimension. A claims data-based quasi-experimental study design using PSM in combination with a small-scale exact matching approach is proposed to control for a possible bias caused by nonrandomized group assignment. In the application to the GKT context, it could be shown that intervention and control groups can be balanced by adopting such an approach.
Although matched-pair approaches simulate the randomization balance (intervention vs. control group) in experimental studies, they can do so only for observable risk factors. Claims data might not include important factors, such as in this GKT case, out-of-pocket medication or health service utilization or the health consciousness of patients and their treating physicians. Excluding these unobservable factors might lead to a bias, a fact to be considered when discussing results, 26,41 thus calling for validation through supporting evidence, where possible, in particular if just small effects are observable. 22 In addition, the applicability of the high-dimensional propensity score methodology should be tested in future studies as it has shown potential to control for residual and unmeasured confounding in recent claims data-based studies. 42
This study also demonstrated that because of their good electronic availability and low collection costs, as well as their comprehensive longitudinal and cross-health care provider view, claims data offer a good base for population health outcome measurement. Mortality indicators that can be measured on the basis of claims data have been applied to the GKT model: mortality ratio, age at time of death, survival time, and an adapted individually age-adjusted YPLLG indicator. The mortality indicators used show positive results toward the ACO, also after controlling for a potential (indirect) immortal time bias by excluding the first half year after enrollment from the outcome measurement. Because the Non-ACO control group had to be drawn from the AOK and LKK insurees living in Kinzigtal and not enrolled in the ACO—because of the limited data set—the impact of the ACO may be underestimated. This is because, as part of the shared savings contract, the Non-ACO control group also can access some ACO interventions. In an ideal case, all 32,595 GKT insurees from the Kinzigtal region covered in the ACO shared savings contract could be compared with a standard care group from other regions. The study then could move more toward measuring population health in the sense of the health of the population in a geographic area and not just the enrolled population of ACO patients. This is actually intended by the GKT ACO contract. In addition, the number of ACO enrollees who had to be excluded (n = 1010; 14.6%), because no adequate matched pair could be drawn from the limited data set, may be reduced with such an approach. In future studies, these excluded ACO enrollees must be investigated in more detail.
Taking into account that the time span of this case study (4 years) might be too short to perceive any realistic effects on mortality, further studies with longer observation periods will have to confirm the intermediate results presented here. The question of whether years of potential life gained are healthy years also has to be addressed in future studies.
In view of the limitations of the chosen evaluation design from unobservable factors in the matching procedure, a validation of the impact of the ACO on population health with supporting evidence through other quantitative and qualitative methods is recommended. In the case of GKT, other studies with different study designs as well as external scientific evaluations support the results of this article. For example, Köster et al 17 have shown improvements concerning overuse, underuse, and misuse of care, and respective quality improvements in GKT. Siegel et al 12 highlighted positive health-related behavior changes in GKT in their study.
This study describes the application to a specific ACO, in this instance, GKT. However, the research team believes that for its simplicity and ease of application, this evaluation approach also can be applied to other forms of ACOs and integrated care systems. The team would thereby, in general, strongly recommend long observation periods for the evaluation of such population-based interventions as effects from prevention programs, for example, may unfold their impact only over longer time periods. However, in many circumstances, contractual, funding, or other restrictions may prohibit such an approach. There also may be a need for more timely feedback to stimulate rapid learning processes. In these cases, additional shorter term intermediate outcome measures of population health will be needed, in addition to the mortality indicators presented in this article. In future studies, the research team plans to explore further claims data-based population health indicators and the transferability and usability of the present evaluation design and mortality measures for comparative evaluations.
Footnotes
Author Disclosure Statement
The authors declared the following conflicts of interest with respect to the research, authorship, and/or publication of this article: Mr. Schulte, Dr. Groene, and Dr. Hildebrandt are employees of OptiMedis AG. Dr. Pimperl also was employed by OptiMedis AG, but is currently a Harkness Fellow in Health Care Policy and Practice and does not receive any funding from OptiMedis AG. OptiMedis AG is the management partner and shareholder of Gesundes Kinzigtal GmbH, which is used as the study setting for the empirical application of the evaluation design described in this article. Dr. Hildebrandt is also the CEO of Gesundes Kinzigtal GmbH. The other coauthors declared no conflicts of interest. At the time this article was developed, Dr. Pimperl was engaged in the Harkness Fellowship in Health Care Policy and Practice, supported by The Commonwealth Fund, a private independent foundation based in New York, New York. The views presented here are those of the authors and not necessarily those of The Commonwealth Fund, its directors, officers, or staff.
References
Supplementary Material
Please find the following supplemental material available below.
For Open Access articles published under a Creative Commons License, all supplemental material carries the same license as the article it is associated with.
For non-Open Access articles published, all supplemental material carries a non-exclusive license, and permission requests for re-use of supplemental material or any part of supplemental material shall be sent directly to the copyright owner as specified in the copyright notice associated with the article.
