
Abstract
Home health agencies (HHAs) are known to exploit the Medicare reimbursement schedule by targeting a specific number of therapy visits. These targeting behaviors cause unnecessary medical spending. The Centers for Medicare & Medicaid Services estimates that during fiscal year 2015, Medicare made more than $10 billion in improper payments to HHAs. Better understanding of heterogeneous gaming behaviors among HHAs can inform policy makers to more effectively oversee the home health care industry. This article aims to study how home health chains adjust and adopt new targeting behaviors as compared to independent agencies under the new reimbursement schedule. The analytic data are constructed from: (1) 5% randomly sampled Medicare home health claim data, and (2) HHA chain information extracted from the Medicare Cost Report. The study period spans from 2007 to 2010, and the sample includes 7800 unique HHAs and 380,118 treatment episodes. A multivariate regression model is used to determine whether chain and independent agencies change their practice patterns and adopt different targeting strategies after the revision of the reimbursement schedule in 2008. This study finds that independent agencies are more likely to target 6 and 14 visits, while chain agencies are more likely to target 20 visits. Such a change of practice patterns is more significant among for-profit HHAs. The authors expect these findings to inform policy makers that organizational structures, especially the combination of for-profit status and chain affiliation, should be taken into the consideration when detecting medical fraud and designing the reimbursement schedule.
Introduction
H
The growing literature shows that home health agencies (HHAs) exploit the Medicare reimbursement schedule to maximize profits. 1,2 HHAs adopt certain practice patterns that would increase utilization and profits, but not necessarily meet patients' health care needs (herein referred to as “gaming behaviors”). The Centers for Medicare & Medicaid Services (CMS) estimates that, during fiscal year 2015, Medicare made more than $10 billion in improper payments to HHAs. 3
Studies reveal heterogeneous gaming behaviors among HHAs. For example, for-profits and new entrants demonstrate more aggressive participation in gaming behaviors. 4 The understanding of different gaming behaviors informs regulatory agencies to more effectively identify inefficient Medicare spending and prevent medical fraud. However, perhaps because of the unavailability of HHAs' chain affiliation status, the impacts of chain affiliation on gaming behaviors is largely overlooked. To fill this gap in the literature, this paper studies whether HHAs that are part of multiple facilities chains (herein referred to as “chain agencies”) participate in these gaming behaviors differentially from those agencies that operate independently and are not affiliated with chains (“independent agencies”).
Chain affiliation has become a common organizational structure in the US health delivery system, including hospitals, 5 nursing homes, 6 and outpatient dialysis facilities. 7 Many studies have examined the effect of chain memberships on prices, 8 quality, 9,10 and resource variations. 11 Although large chains often have been associated with medical fraud in the media, 12,13 the relationship between chain affiliation and gaming behaviors may be more complex than the public perception.
Theoretically, large chains face greater pressures from shareholders to maximize profits 14 ; chain agencies can adopt corporate-level standardization to guide their affiliated agencies, 15 or chains might facilitate inter-unit knowledge transfer, including skills, methods, and administrative procedures. 6 These plausible actions suggest that chain agencies are more likely to game systematically. On the other hand, chains may face stricter scrutiny and greater risk to their reputation, 16 –18 and therefore be more averse to exploiting the reimbursement schedule.
In addition, both chain and independent agencies can participate in gaming behaviors but adopt different strategies because of differences in their sizes and resources. A better understanding of the relationship between chain affiliation and gaming behaviors can inform policy makers as they seek to regulate, monitor, and redesign reimbursement schedules in a more effective manner.
The study period spans from 2007 to 2010. In 2000, CMS introduced a retrospective reimbursement schedule to control escalating home health spending. Because of the nonlinear fee schedule for therapy visits, HHAs strategically targeted the tenth therapy visit per treatment episode, given that Medicare payment rates increased substantially only at the tenth visit. 1,4 In response to HHAs' targeting of 10 visits, in 2008 CMS revised the Medicare prospective payment system (PPS) and drastically changed the financial incentives for HHAs. Under the updated PPS, the strategic profit-maximizing visits per treatment episode shifted from 10 visits to 6, 14, or 20 visits, because the increases in payment rates at these points are relatively higher than those at other numbers of visits.
A recent study finds that HHAs rapidly adjust their practice patterns and target these new profit-maximizing numbers of visits. 19 Extending the literature, this study examines whether chain and independent agencies respond differently and adopt differential gaming strategies.
Home health care, 2008 Medicare reimbursement revision, and gaming behaviors
Medicare home health provides health care visits at a patient's home for homebound patients who need intermittent or part-time skilled care. In 2011, 9.6% of Medicare beneficiaries received home health visits. Unlike other Medicare post-acute care services, Medicare home health care does not require patients to have a prior stay in hospitals or skilled nursing homes to be eligible for services. In 2011, only 34% of home health services were preceded by a hospitalization or other cases of post-acute care use. 2 Because Medicare home health care is free to patients, this paper focuses primarily on HHAs' responses to financial incentives provided by Medicare PPS.
Medicare PPS reimburses home health agencies with fixed dollar amounts for each patient for every 60-day-long treatment period (an episode of care), based on each patient's health conditions at the start of care. The well-known exception is reimbursements for therapy visits. (Therapy visits include physical therapy, occupational therapy, and speech therapy.)
Figure 1A illustrates the difference between the PPS prior to 2008 and the PPS after 2008. The dashed line represents the previous PPS, and the solid line illustrates the revised PPS. Before 2008, reimbursement rates for therapy visits stayed the same until a patient received the tenth therapy visit, after which it increased by approximately $2000. The $2000 increase at the tenth visit was more than 10 times higher than the cost of a therapy visit (eg, $105 for 1 physical therapy visit in 2001). This payment rate per episode remains the same at other numbers of visits greater than 10 unless the patient becomes eligible for outlier payments.
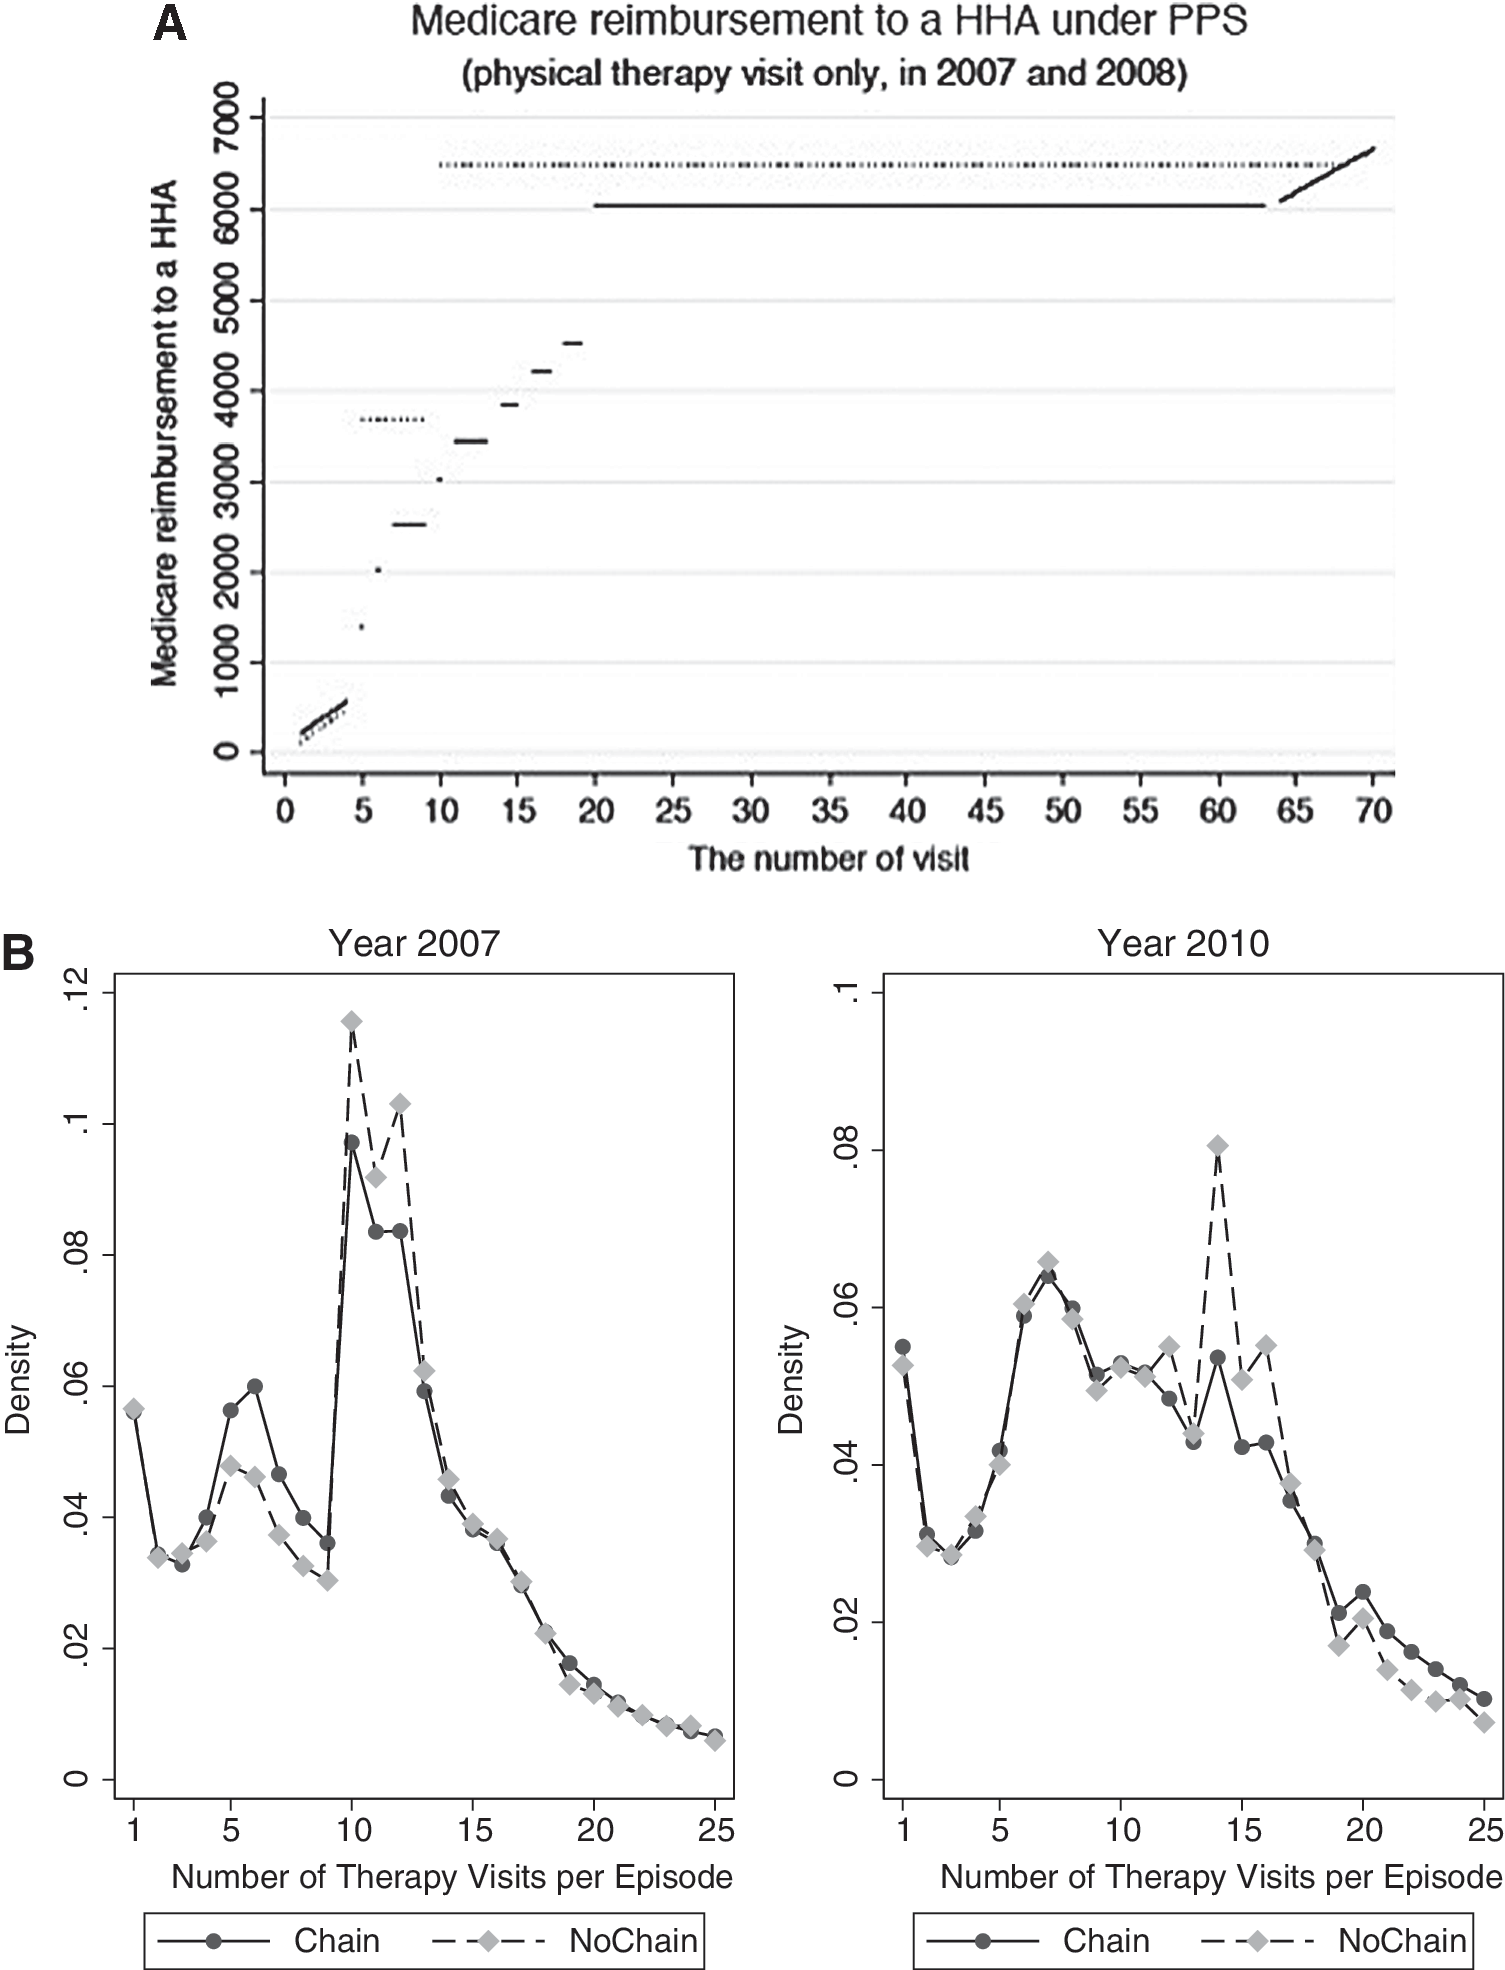
This design was an incentive for agencies to provide at least 10 visits per episode, or agencies might decrease the number of visits closer to 10 to reduce costs, even when patients required additional visits. Responding to this financial incentive, HHAs seek to target the provision of 10 therapy visits per episode to exploit the substantial reimbursement rate increase. 1,4,19 –21 These targeting behaviors are often considered potential medical fraud by the Department of Health and Human Services and the Department of Justice. 22 (Targeting behavior can be either (1) to cut the number of visits when patients need more than 10 visits, or (2) to increase the number of visits when patients need fewer than 10 visits. It is unknown which is the case because these data are not available.)
To discourage HHAs' targeting behaviors, Medicare revised the reimbursement schedule for therapy visits in 2008. 23 The updated schedule has incremental rate increases from 5 to 20 visits, with the largest increases from 5 to 6 and 13 to 14 visits in addition to another substantial increase from 19 to 20 visits. Therefore, providing 10 therapy visits is no longer the most lucrative approach.
Specifically, depending on patient case mix, the differences in reimbursement rates between the fifth and sixth, the thirteenth and fourteenth, and the nineteenth and twentieth visits can be up to $650, $850, and $1900, respectively. Those incremental differences in reimbursements are greater than at other thresholds (usually between $300–$500) and surpass the average cost of 1 therapy visit ($124 in 2010). Based on this revised reimbursement schedule, this study identifies 6, 14, and 20 visits as the 3 treatment intensities that HHAs are most likely to target. 19 The study then examines whether chain and independent agencies target these new thresholds (6,14, and 20 visits) and whether they target different thresholds.
Chain and independent home health agencies
Studies of HHAs suggest that agencies' organizational characteristics are strongly associated with participation in reimbursement gaming behaviors. For example, compared to nonprofits and incumbents, for-profit 4 and new entrants 19 are more likely to engage in such gaming behaviors. However, it is not yet clear how chain and independent agencies may engage in gaming behaviors differentially. To guide the empirical analysis, the hypothesis was developed from the broader literature on chains.
Chain agencies, especially those owned by large for-profit corporations, may face greater pressures from shareholders 24 and have greater incentives to game the reimbursement schedule. Corporate headquarters may standardize administrative and clinical processes, 15 and such standardization can facilitate learning and implementation across units within the chains. 25,26 Although standardization theoretically is designed to ensure service quality and reliability, it also can enable chain agencies to adopt new targeting behaviors systematically as a response to the revised reimbursement schedule.
On the other hand, large home health chains may face stricter regulatory scrutiny, and higher litigation and reputation risks. 16,17,26 This leads to the competing hypothesis that chains may be more averse to gaming behaviors.
In addition, chains may provide better access to external resources to their units, including capital, skilled workers, 27 and better relationships with referral institutions (eg, hospitals, nursing homes). These differences may influence chain and independent agencies' decisions regarding the adoption of differential gaming strategies.
Methods
The empirical analysis extracts the facility-level information of HHAs from the CMS Medicare Cost Report and patient-level information from the 5% randomly sampled Medicare home health claims. Because detailed information of chain affiliation is only available after 2007 through the Medicare Cost Report and the revision of Medicare PPS reimbursement occurred in 2008, this study examines the change in practice patterns during the period between 2007 and 2010. The unit of observation is at the treatment episode level. The sample is restricted to Medicare beneficiaries ages 65 years and older, excluding those who were enrolled in Medicare Advantage, and only considers treatment episodes that included at least 1 therapy visit. The analytic sample includes 380,118 treatment episodes provided by 7800 agencies.
A difference-in-differences approach is used to estimate changes in targeting behaviors between chain and independent agencies before and after revision of the Medicare reimbursement schedule implemented in 2008. A linear probability regression model is used and estimates the episode-level regression as follows:
where i, j, h, m, and t refer to episode, patient, HHA, market, and year, respectively. The dependent variable Y, represents the 3 targeting behaviors that HHAs may adopt: (1) 6 visits, (2) 14 visits, or (3) 20 visits per treatment episode. Chain is a dummy variable that takes a value of 1 if the agency belongs to multiagency chains or 0 if the agency is an independent entity. Because the revision of the reimbursement schedule may affect an agency's decision to join or leave chains, an HHA's chain affiliation is defined based on its chain status before the reimbursement change (ie, 2007).
The coefficient of the interaction term, Chainh × Postt , estimates the differential likelihoods of a patient receiving 6, 14, or 20 visits per treatment episode between independent and chain agencies before and after the 2008 revision of reimbursement rates. If chain agencies are more likely adjusting to new targeted visits, δ will be positive. In contrast, a negative δ suggests that independent agencies are more responsive to the new reimbursement schedule.
X is a vector of the agency-level characteristics, including years of operation, for-profit status, and number of employed nurses, physical therapists, and home health aides. P represents a vector of patient-level control variables, including age, race, sex, Medicare buy-in program participation status, and health conditions (eg, diabetes, hypertension, heart failure). M is the market-level control variables, including the Herfindahl-Hirschman index (HHI) that is used to measure the concentration level of local markets. The calculation of HHI uses the numbers of patients of each agency to measure the market share and uses the hospital referral region as the definition of geographic markets. 4 S is an indicator variable controlling for seasonality. The standard error is clustered at the agency level.
Next, because previous studies find that for-profit and nonprofit HHAs have different responses to gaming behaviors, 4 it is important to examine whether for-profit and nonprofit chains respond differently to the reimbursement schedule. Therefore, this study identifies HHAs based on the combination of chain status and ownership types: independent/nonprofit (as the reference group), independent/for-profit, chain/nonprofit, and chain/for-profit. Government HHAs are excluded from the sample. Interaction terms are then created between each chain/ownership type and the variable indicating the revised reimbursement schedule. The coefficients of the interaction terms help to determine whether for-profit chains demonstrate greater gaming behavior regarding the reimbursement schedule.
Finally, the sample also is stratified by referral sources and primary diagnosis and the main analysis is repeated. This subgroup analysis helps to determine if particular referral sources or specific types of patients drive the change of practice patterns.
Results
Descriptive statistics
Figure 1B shows drastic shifts of practice patterns before and after the reimbursement revision in 2008. Under the PPS before the revision, both chain and independent agencies targeted 10 visits. After the introduction of the revised PPS, HHAs quickly adjusted to target the sixth, fourteenth, and twentieth visits. Divergent practice patterns are observed between chain and independent agencies. The independent agencies are more likely to provide 6 and 14 visits, while chains are more likely to provide 20 visits.
Table 1 displays summary statistics. The percentages of episodes with 6 and 14 therapy visits increase by 1.4% and 3%, respectively, among independent agencies, both of which are greater than the corresponding changes among chain agencies. On the other hand, the proportion of episodes with 20 therapy visits increases by 5.5% among chain agencies. This increase is greater than that among independent agencies. Several differences are observed between chain and independent agencies. For example, chain agencies are more likely to be nonprofit and less likely to be operated by the government, employ more nurses and therapists, and have longer years of operation.
In terms of referral sources, before the revision of the reimbursement schedule chain agencies had a higher percentage of their patients with a prior hospital or skilled nursing home stay compared to independent agencies (7.66% higher). Although the difference narrows after the revision (to 3.5%), chain agencies still have a higher portion of their patients referred from hospitals or nursing homes. Interestingly, both chain and independent agencies increase portions of their treatment episodes with patients referred from community settings, by 5.61% and 3.07%, respectively.
Compared to episodes initiated at chain agencies, episodes initiated at independent agencies are more likely to have patients with a primary diagnosis of arthritis, diabetes, and osteoporosis. On the other hand, chain agencies seem to more likely provide care to patients with conditions including heart failure, cardiac dysrhythmias, pneumonia, and other forms of heart diseases. The different compositions of patients seem consistent with the different referral sources between chain and independent agencies.
Observation of the primary diagnosis of treatment episodes reveals that both chain and independent agencies seem to have much sicker patients over time. For example, under the new PPS, 21.75% and 15.74% more treatment episodes initiated at chain and independent agencies have a primary diagnosis of hypertension, respectively, compared to the previous PPS. The comparisons of referral sources and the primary diagnosis are consistent with the report by the Office of Inspector of General (OIG). 22 Among OIG-investigated cases of home health fraud, there are higher percentages of episodes that not preceded by a hospital or nursing home stay and with a primary diagnosis of diabetes or hypertension. The OIG report finds that HHAs solicited beneficiaries in the community to receive home health care, regardless of their medical needs.
Chain agencies are larger in size than independent agencies. In the 5% randomly selected sample, chain agencies on average have 43.02 patients and 56.81 treatment episodes, compared to only 8.86 patients and 11.97 treatment episodes at the independent agencies.
Main regression results
The main regression results are presented in Table 2. Results show that, under the revised PPS, both chain and independent agencies adjust practice patterns and target the new profit-maximizing numbers of visits (ie, 6, 14, 20). However, the magnitudes vary substantially depending on agencies' chain status. Within the treatment episodes initiated at independent agencies, the probabilities of a patient receiving 6 and 14 visits increase by 1.70 and 2.76 percentage points (P < 0.01); however, the probabilities only increase by 0.06 and 0.08 (P < 0.01) percentage points for the treatment episode initiated at chain agencies. On the other hand, for treatment episodes initiated at the chain agencies, the probability of patients receiving 20 visits increases by 5.67 percentage points (P < 0.01); for episodes initiated at independent agencies, the probability only increases by 2.18 percentage points (P < 0.01).
This table estimates the likelihood of patients receiving 6, 14, and 20 visits per episode (columns 1, 2, and 3). Statistical significance at the 10%, 5%, and 1% level is indicated by *, **, and ***. Standard error is clustered at the agency level.
A sensitivity analysis also is performed to check the probability of patients receiving 5–7, 13–15, and 19–21 therapy visits (Table 3). Consistent with the hypothesis and main results, significant and substantial increases in the probabilities are seen only at 6, 14, and 20 visits.
The table shows the practice patterns around the 3 theoretical targets (ie, 6, 14, and 20 visits, bold) that home health agencies are likely to use to game the reimbursement schedule.
For-profit versus nonprofit
The analysis of for-profit/nonprofit and chain/independent agencies is presented in Table 4. In this analysis, the reference group is the nonprofit independent agency. After 2008, nonprofit independent agencies are 0.96 and 0.51 percentage points more likely to provide 6 and 14 therapy visits, respectively. While the coefficients are statistically significant, the magnitudes are relatively small. Compared to nonprofit independent agencies, this study finds that nonprofit chains do not have different practice patterns both before and after 2008. The coefficients on the interaction terms of nonprofit chain agencies and new reimbursement schedule are all statistically insignificant, and the magnitudes are small.
This set of regressions regroups home health agencies into 4 types: for-profit/independent, nonprofit/independent, for-profit/chain, and nonprofit/chain. The nonprofit/independent agencies are the reference group. All the regressions include the same control variables as were used in the main regressions. Statistical significance at the 10%, 5%, and 1% level is indicated by *, **, and ***. Standard error is clustered at the agency level.
On the other hand, for-profit HHAs exhibit very drastic changes in practice patterns. Compared to nonprofit independent agencies, for-profit independent agencies were less likely to provide 6, 14, or 20 therapy visits before 2008. However, after 2008, compared to nonprofit independent agencies, for-profit independent agencies are more likely to provide 6, 14, and 20 visits. Specifically, the probability of for-profit independent agencies to provide 6, 14, and 20 therapy visits increase by 1.94, 3.80, and 3.20 percentage points, respectively.
For-profit chains also significantly change their practice, mostly focusing on 20 therapy visits. Under the new PPS, compared to nonprofit independent agencies, for-profit chains have a slightly lower probability of providing 6 visits (0.89 percentage point), a moderate higher probability of providing 14 visits (3.29 percentage points), and a substantial higher probability of providing 20 visits (7.30 percentage points). Taken together, both for-profit chain and independent agencies are more likely to adjust their targeting behaviors, although independent agencies target 6 and 14 visits and chain agencies target 20 visits.
Differences in referrals and patient mix
To explore the plausible mechanisms for different practice patterns between chain and independent agencies, a series of subsample analyses are run across patients with different referral sources and primary diagnoses. These regression results are presented in online Supplementary Table S1 (Supplementary Data are available online at
Discussion
Overall, these results show that, on average, HHAs do respond to the change of reimbursement schedule and adjust their gaming behaviors accordingly. Patients are more likely to receive 6, 14, and 20 visits per treatment episode. However, chain and independent agencies respond differently by targeting distinct numbers of visits. Under the revised PPS, independent agencies are more likely to target 6 and 14 visits and chain agencies instead focus on providing 20 visits. Considering the differences in gaming behaviors of for-profits/nonprofits and chain/independent agencies, all types of HHAs target 6 and 14 visits. However, the magnitude of targeting behaviors is smallest among nonprofit chain and independent agencies, larger among for-profit chains, and largest among for-profit independent agencies.
On the other hand, only for-profit HHAs target 20 visits, and the magnitude of targeting is the largest among for-profit chains. Overall, for-profit HHAs are more aggressively gaming the revised reimbursement schedule, and for-profit chain and independent agencies adopt different strategies. The same divergence of practice patterns is not found between chain and independent agencies among nonprofit HHAs.
The difference in referral sources and types of patients theoretically may be the driver of the differential targeting behaviors in providing 6, 14, and 20 visits between chain and independent agencies. Chain agencies have higher percentages of treatment episodes referred from hospitals and nursing homes and with primary diagnoses of acute conditions. However, the data show that the difference in referral sources between chain and independent agencies narrows after the introduction of the new PPS in 2008. Compared to chain agencies, in 2007 independent agencies had 7.9 percentage points more patients referred from physicians and clinics (community), and after 2007 this difference narrows to only 5.6 percentage points.
In 2007 chain agencies had 7.7 percentage points more patients referred from inpatient settings. After 2007 the difference narrows to only 6.3 percentage points. Given the narrowing difference in referral sources, the divergent practice pattern between chain and independent agencies is less likely driven by the change of referral sources.
However, chain agencies are still more likely providing care to patients referred from hospitals and nursing homes, and to patients with acute health conditions. Instead, perhaps because of the economy of scale and more financial resources, 26 the availability of more and better skilled staff members at chain agencies combined with higher financial incentives of more intensive treatment may explain why chain agencies increasingly provide 20 therapy visits under the new PPS.
Limitations and suggestions for future research
This study has 2 major limitations. First, because Medicare Home Health claim data do not provide detailed information regarding patients' health conditions, inferences cannot be made about the optimal level of therapy visits. Therefore, the study team is not able to analyze whether the new gaming behaviors (ie, 6, 14, 20 visits) may improve or worsen patients' health outcomes, and cannot directly evaluate whether the new PPS causes more inefficient use of home health care.
Second, it is known if the patients are referred from inpatient or physician and clinical settings, but it is not known if the patients had surgery or other major clinical procedures prior to the use of home health care. This limits the ability to directly test if the divergent practice pattern between chain and independent agencies is related to patients' different clinical needs or related to gaming. Future research may consider merging home health claims data sets with hospital inpatient data sets; in that way, researchers can better assess patients' health needs and determine if the more intensive use of treatments may be justified.
Conclusion
This analysis finds that HHAs change their practice patterns drastically after introduction of the revised PPS in 2008. Chain and independent agencies rapidly adjust their target number of therapy visits from 10 to 6, 14, and 20 therapy visits. Independent agencies are more likely to target 6 and 14 visits while chain agencies target 20 visits. Interestingly, only for-profit independent and chain agencies develop significantly different targeting behaviors. Because chain agencies have a higher portion of patients referred from inpatient settings and more staffing (nurses, therapists, aides), the ability to provide more therapy to these patients may be a plausible explanation for the differential practice patterns observed in this paper.
With better data, future studies focusing on patient health outcomes may provide additional insights regarding whether the change and increased use of home health care can be justified by the improvement in patients' health status.
Based on the differential responses to the reimbursement schedule, these results suggest that policy makers and payers may consider the potential impacts of for-profit chain agencies in designing the reimbursement schedule, especially when these chains target the more expensive treatment threshold (20 visits). One actionable policy recommendation is to implement a smaller price increase between 19 and 20 therapy visits and a series of smaller rate increases for treatment episodes beyond 20 visits. This should reduce the financial incentives for targeting 20 visits per treatment episode.
Because both for-profit independent agencies and chains are more likely to adjust their practice patterns and target a specific threshold number of visits, it is recommended that regulatory agencies, such as the Health Care Fraud Prevention and Enforcement Action Team, demonstrate stricter scrutiny with for-profit HHAs and evaluate whether the targeting behaviors can be justified based on patients' needs.
Footnotes
Acknowledgments
We thank 2 anonymous reviewers, Alice Ellyson, and the conference participants at the 2015 iHEA World Conference and SEA conferences for valuable comments. Any errors remain our own.
Author Disclosure Statement
Drs. Huang and Kim declared no conflicts of interest with respect to the research, authorship, and/or publication of this article. This work was partly supported by awards from Rackham Graduate School of the University of Michigan, The Fahs-Beck Fund for Research and Experimentation, and the Blue Cross Blue Shield of Michigan Foundation.
References
Supplementary Material
Please find the following supplemental material available below.
For Open Access articles published under a Creative Commons License, all supplemental material carries the same license as the article it is associated with.
For non-Open Access articles published, all supplemental material carries a non-exclusive license, and permission requests for re-use of supplemental material or any part of supplemental material shall be sent directly to the copyright owner as specified in the copyright notice associated with the article.