
Abstract
A growing literature documents the substantial burden that a small proportion of high-cost, medically complex patients impose on health care systems. However, it is not clear whether high-cost patients remain costly over time. This study looks at the monthly distribution of billed charges for a cohort of high-cost, medically complex patients enrolled in an intensive care management program in a university health care system, and finds that the billing trajectory is heterogeneous and highly nonlinear, characterized by a substantial spike in billed charges prior to identification, followed by a considerable drop prior to enrollment and a sustained drop thereafter. The conclusion is that many high-cost patients experience costly events that resolve without intensive case management. These results also suggest that interventions should target only those high-cost patients with expected continued high cost and that pre-post study designs may overstate the impact of interventions for high-cost, medically complex patients.
Introduction
A
In previous work, Wodchis et al 3 studied high-cost patients in Ontario, Canada from 2009–2011. They found that the costliest 1% of this population accounted for 33% of costs, and the costliest 5% of the population accounted for 65% of costs. In terms of persistence in costs over this 3-year period, 45% of people who were in the top 5% the first year remained in at least the top 10% over the subsequent 2 years. Johnson et al 4 studied a group of “super-utilizers” (defined as those with 3 or more hospitalizations over a 12-month period or 2 or more hospitalizations plus a mental health diagnosis) utilizing the Denver Health delivery system. Their original group of super-utilizers had baseline spending of $113,522 per capita, but this fell by almost 60% over 2 years. At the end of a year, only 28% of previously identified super-utilizers remained as such.
Without a clear understanding of the trajectory of health care costs associated with high-cost patients, it is very difficult to evaluate the effectiveness of interventions that reduce spending in the subset of patients with multiple chronic illnesses, such as chronic care models with case management proposed by Bodenheimer et al. 6,7 Previous studies of disease management programs and chronic care management programs have had mixed results with regard to control of cost and utilization. Ofman et al 8 reviewed results of 102 studies of disease management interventions from articles published from 1987 to 2001 and showed improvement in quality of care, but little evidence of cost reduction. Also, Peikes et al 9 evaluated 15 randomized trials on the impact of care coordination among Medicare beneficiaries and found little effect on hospitalization or cost. For the one program that showed reductions in cost, the reductions were among the most severely ill patients.
A number of authors have suggested a need for a better understanding of characteristics and cost trajectories of high-cost patients to develop effective interventions that could reduce high spending. 4,5 In this paper the study team characterizes temporal spending patterns at monthly intervals in high-cost patients developed as part of a previously reported study by Horn et al 10 that demonstrated that a case management program for high-cost patients reduced future costs compared to a control group. Although the study team's previous paper demonstrated the effectiveness of a chronic care management program for patients who were screened and selected based on their likelihood to benefit from case management, the team was curious about the time course of the changes in spending that were found both in the intervention and control groups. The temporal patterns illustrated in this study clarify the impact of the intervention on high-cost patients and the importance of temporal trends, which should be considered when designing and evaluating intervention-based projects for high-cost patients. 11
Methods
Setting
The University of New Mexico Health Sciences Center (HSC) is the state's principal referral center. It contains the state's only medical school, the state's only Level I trauma center, and is the only public hospital in Albuquerque and Bernalillo County to serve the general public. Each year, HSC has more than 750,000 visits. The Care One program is an intensive care management program designed to target the highest-cost (top 1%), medically complex patients at HSC. The program works to overcome access to care barriers and empanels patients into primary care. Patients whose high costs are believed likely to continue are identified through a chart review and interview, and are invited to enroll. Those with presumptive 1-time events such as trauma or those whose geographic residence would make case management impossible were excluded from the program.
The study team has previously compared the billed charges of participants in the Care One program to a control group made up of a cohort of slightly less expensive patients and found that the Care One patients had a greater drop in spending compared to the control group. The team also compared characteristics of the Care One and control patients including age, sex, race/ethnicity, insurance, and comorbid conditions. The Care One and control groups were similar with regard to sex (46.1% vs. 48.6%, P = 0.34) and had a similar proportion of white to nonwhite patients (66.0% vs. 62.3%, P = 0.14). Also, Care One patients were similar in terms of cerebrovascular disease, myocardial infarction, rheumatological disease, chronic pulmonary disease, mild to severe chronic kidney disease, peptic ulcer disease, mild liver disease, and hemiplegia or paraplegia. In terms of differences, Care One patients were younger than controls (mean age [in years] for Care One, 52.2 and for controls 58.7 years; difference 6.5 years, P < 0.001). Care One patients also were more likely to have Medicaid, congestive heart failure, diabetes mellitus (with and without complications), and less likely than the controls to have Medicare, a malignancy, moderate to severe liver disease, dementia, and/or HIV/AIDS. Horn et al 10 used a multivariate analysis to control for these differences and showed a significant treatment effect from the Care One program. They also utilized a propensity score matching approach, which did not significantly impact the results.
Sample and outcome measurements
A complete description of the Care One program and the inclusion criteria were published previously. 10 Briefly, data for this study were collected for patients who were enrolled in Care One from January 2006 to December 2012. Monthly billed charges were obtained for Care One participants and a control group of patients from the same health system whose charges were just below the 12-month accrued cost cutoff for referral to the Care One program in the 2011 calendar year. To match identification points, data for the comparison group were lagged by 3 months and all billed charges were converted to 2013 dollars using a medical Consumer Price Index deflator from the Bureau of Labor Statistics. 12,13 In Horn et al, 10 the study team showed that the controls and program patients were similar in disease characteristics but had slightly different payer characteristics.
Analysis
A mean billed charge was calculated for each month starting 9 months prior to enrollment and extending 9 months after enrollment. Each point on every figure represents the mean charges for that month for the group of interest. A locally weighted, nonparametric scatter plot smoothing algorithm was used to graphically smooth cost trajectories over time. Locally weighted regression techniques rely on nearest neighbors to generate a summary measure at each data point in the analysis. 14 The LOWESS procedure in Stata 13 (StataCorp LP, College Station, TX) was used to generate group specific smoothed curves, using a bandwidth parameter of 0.4. A bandwidth parameter of 0.4 means that the nearest 40% of the entire data set to each data point was used to provide a smoothed value. The LOWESS procedure uses a tricube weighting function. 14 Stratified curves were created by conditioning on both pre 9-month costs and post 9-month costs. To better visualize the relative patterns of costs, semi-log graphs were generated whenever plots were too crowded to observe relationships. The logarithmic transformation is often used in economic time series data to reduce this crowding and to reduce heteroscedasticity commonly observed in financial figures measured over time. 15
Results
The data set contained 18 months of data (9 months before and 9 months after enrollment) for 753 Care One patients and 794 control group patients. Figure 1 presents the inflation-adjusted monthly average billed charges for both the Care One cohort and the control group. The dashed lines indicate mean billed charges and the solid lines indicate locally-weighted, nonparametrically smoothed curves. Also, time cut-points are indicated by vertical black lines, with the first black line indicating the approximate date Care One participants were identified for Care One (on average it took 3 months for participants to move from referral to active) and the second black line indicating the date on which Care One participants were enrolled in the program.
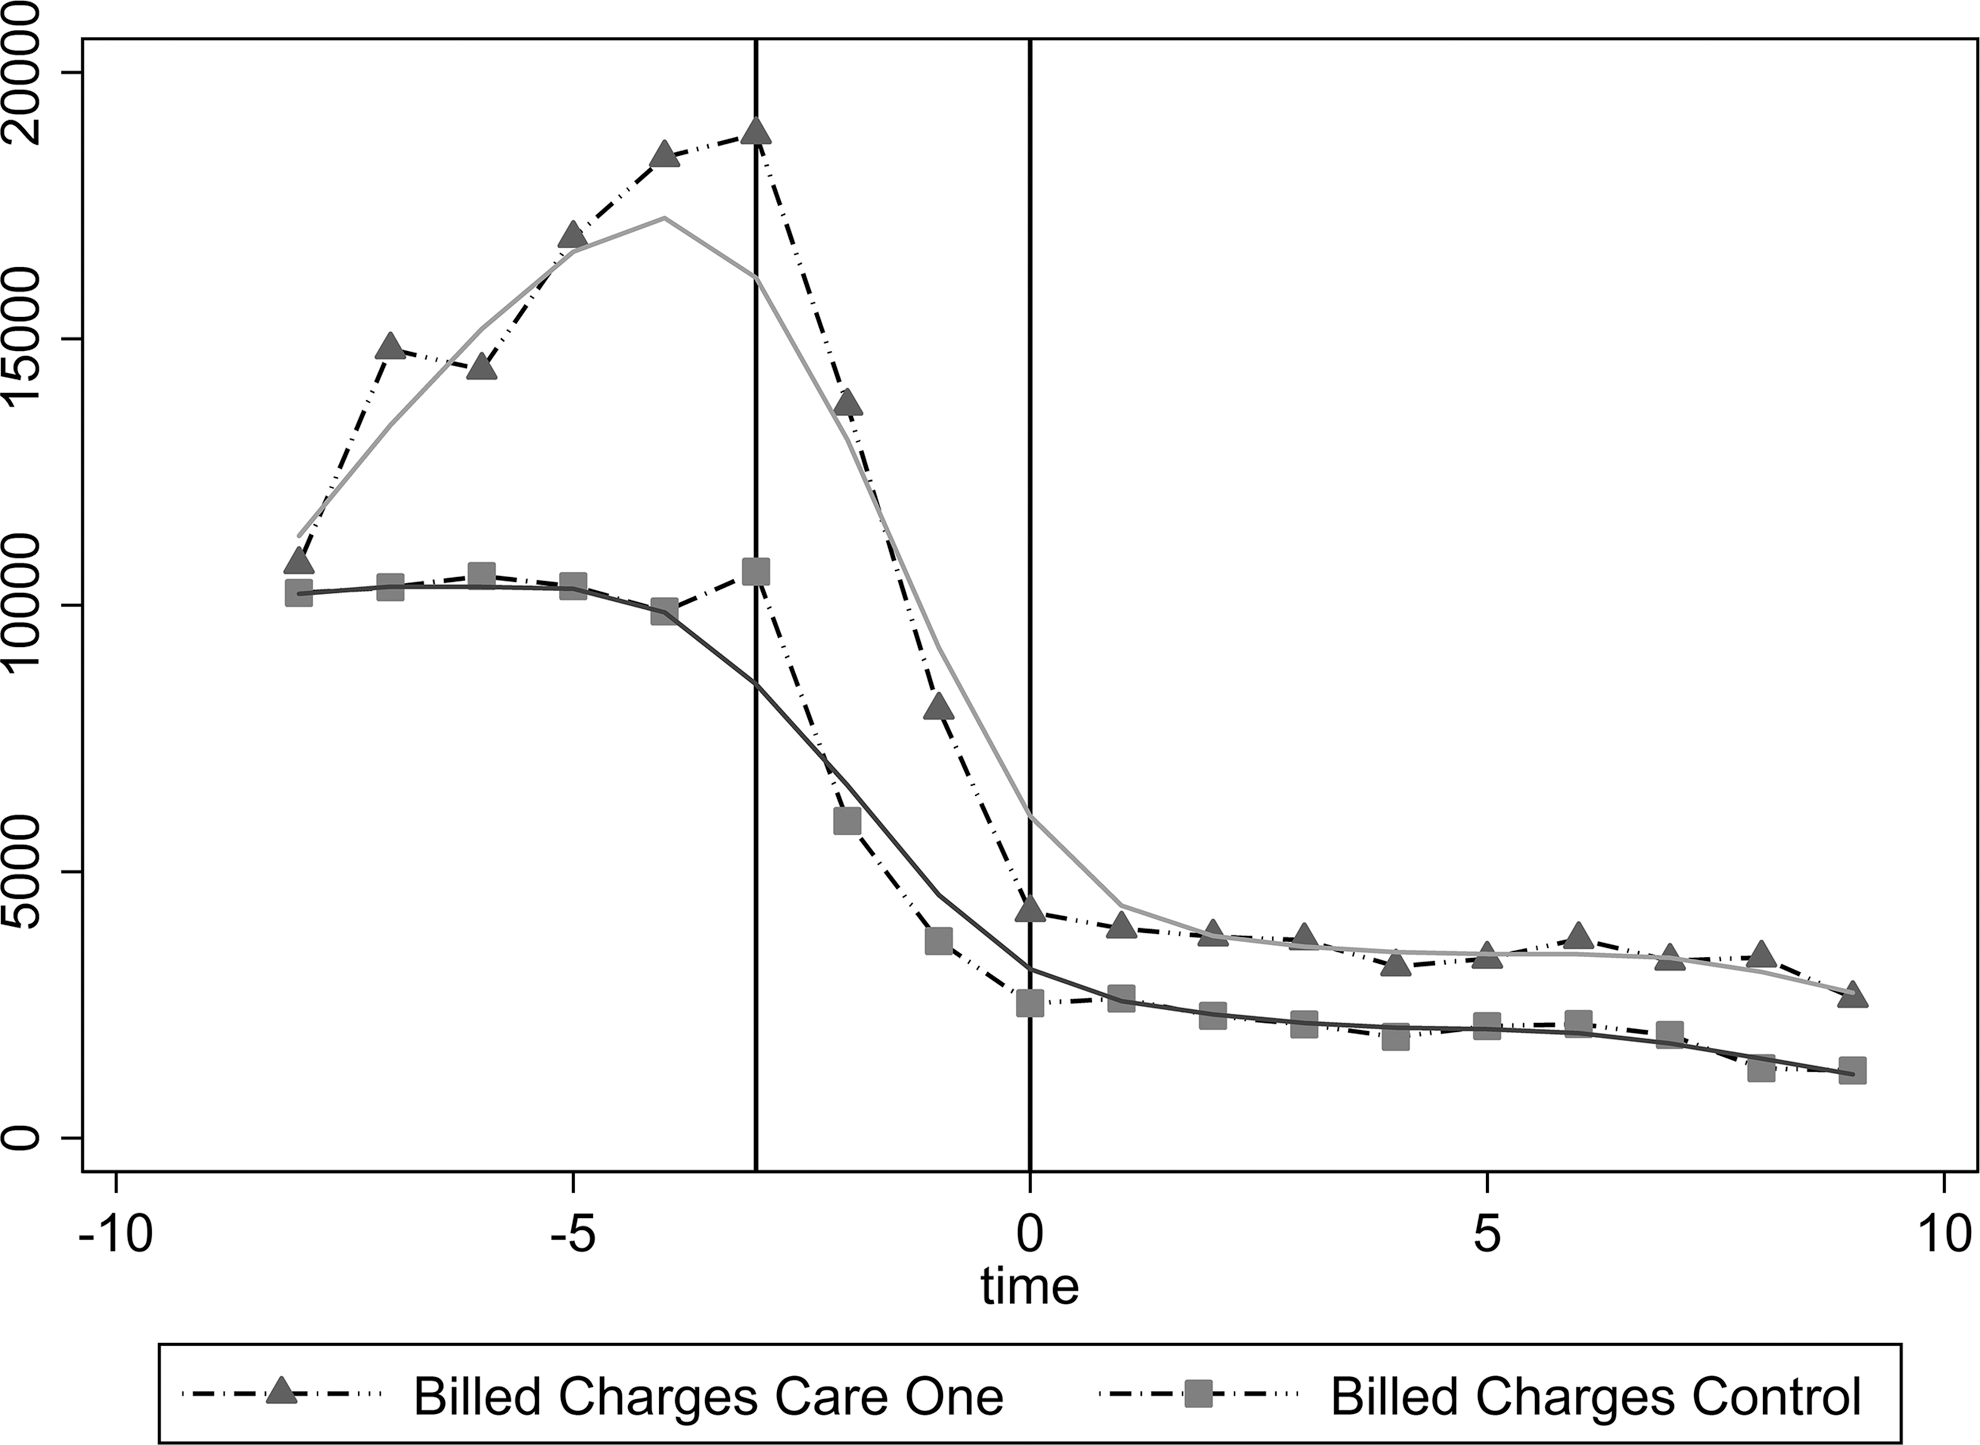
Inflation-adjusted monthly billed charges demonstrating a fall in billed charges 3 months prior to entry into case management.
The distribution of costs for the Care One cohort is highly nonlinear (Fig. 1). Nine months before enrollment Care One patients had mean monthly billed treatment charges of $10,773. Average monthly billed charges continually increased and peaked at $18,840 at the referral for intervention time period. After peaking, billed charges substantially declined until patients were officially enrolled (3 months later) to $4242. At this point, billed charges reduced much more gradually to $2631 at 9 months after the active date. Enrollment involved empanelment in primary care, expedited access to specialty care, pharmacy, social work, and psychiatric care.
The control group and Care One patients have very similar patterns (Fig. 1). Control monthly average costs are also high at the simulated referral date ($10,629), decrease substantially by simulated enrollment ($2529), and then generally level off to $1267 at the end of the study period. Thus, a large part of reductions in spending (approximately 75%) occurred for both the Care One group and the control group in the 3 months after the highest costs were incurred.
Figures 2 and 3 stratify cost curves of Care One patients by pre expenditures (prior to enrollment) and post expenditures (after enrollment), respectively. Figure 2B plots natural logarithm transformed charge figures for better graphical display. Although all pre expenditure stratified groups follow a similar distribution, Figure 2A, B demonstrate considerable differences in peak levels for the highest 10% of high-cost patients. The most expensive 10% cohort peaks at $55,965, the 10%-25% cohort peaks at $43,014, and the 25%-50% cohort peaks at $26,204. Interestingly all groups converge to a similar post expenditure trajectory; however, the bottom 50% exhibit a less drastic reduction in charges and the most expensive 10% remain slightly higher than the other stratified groups.
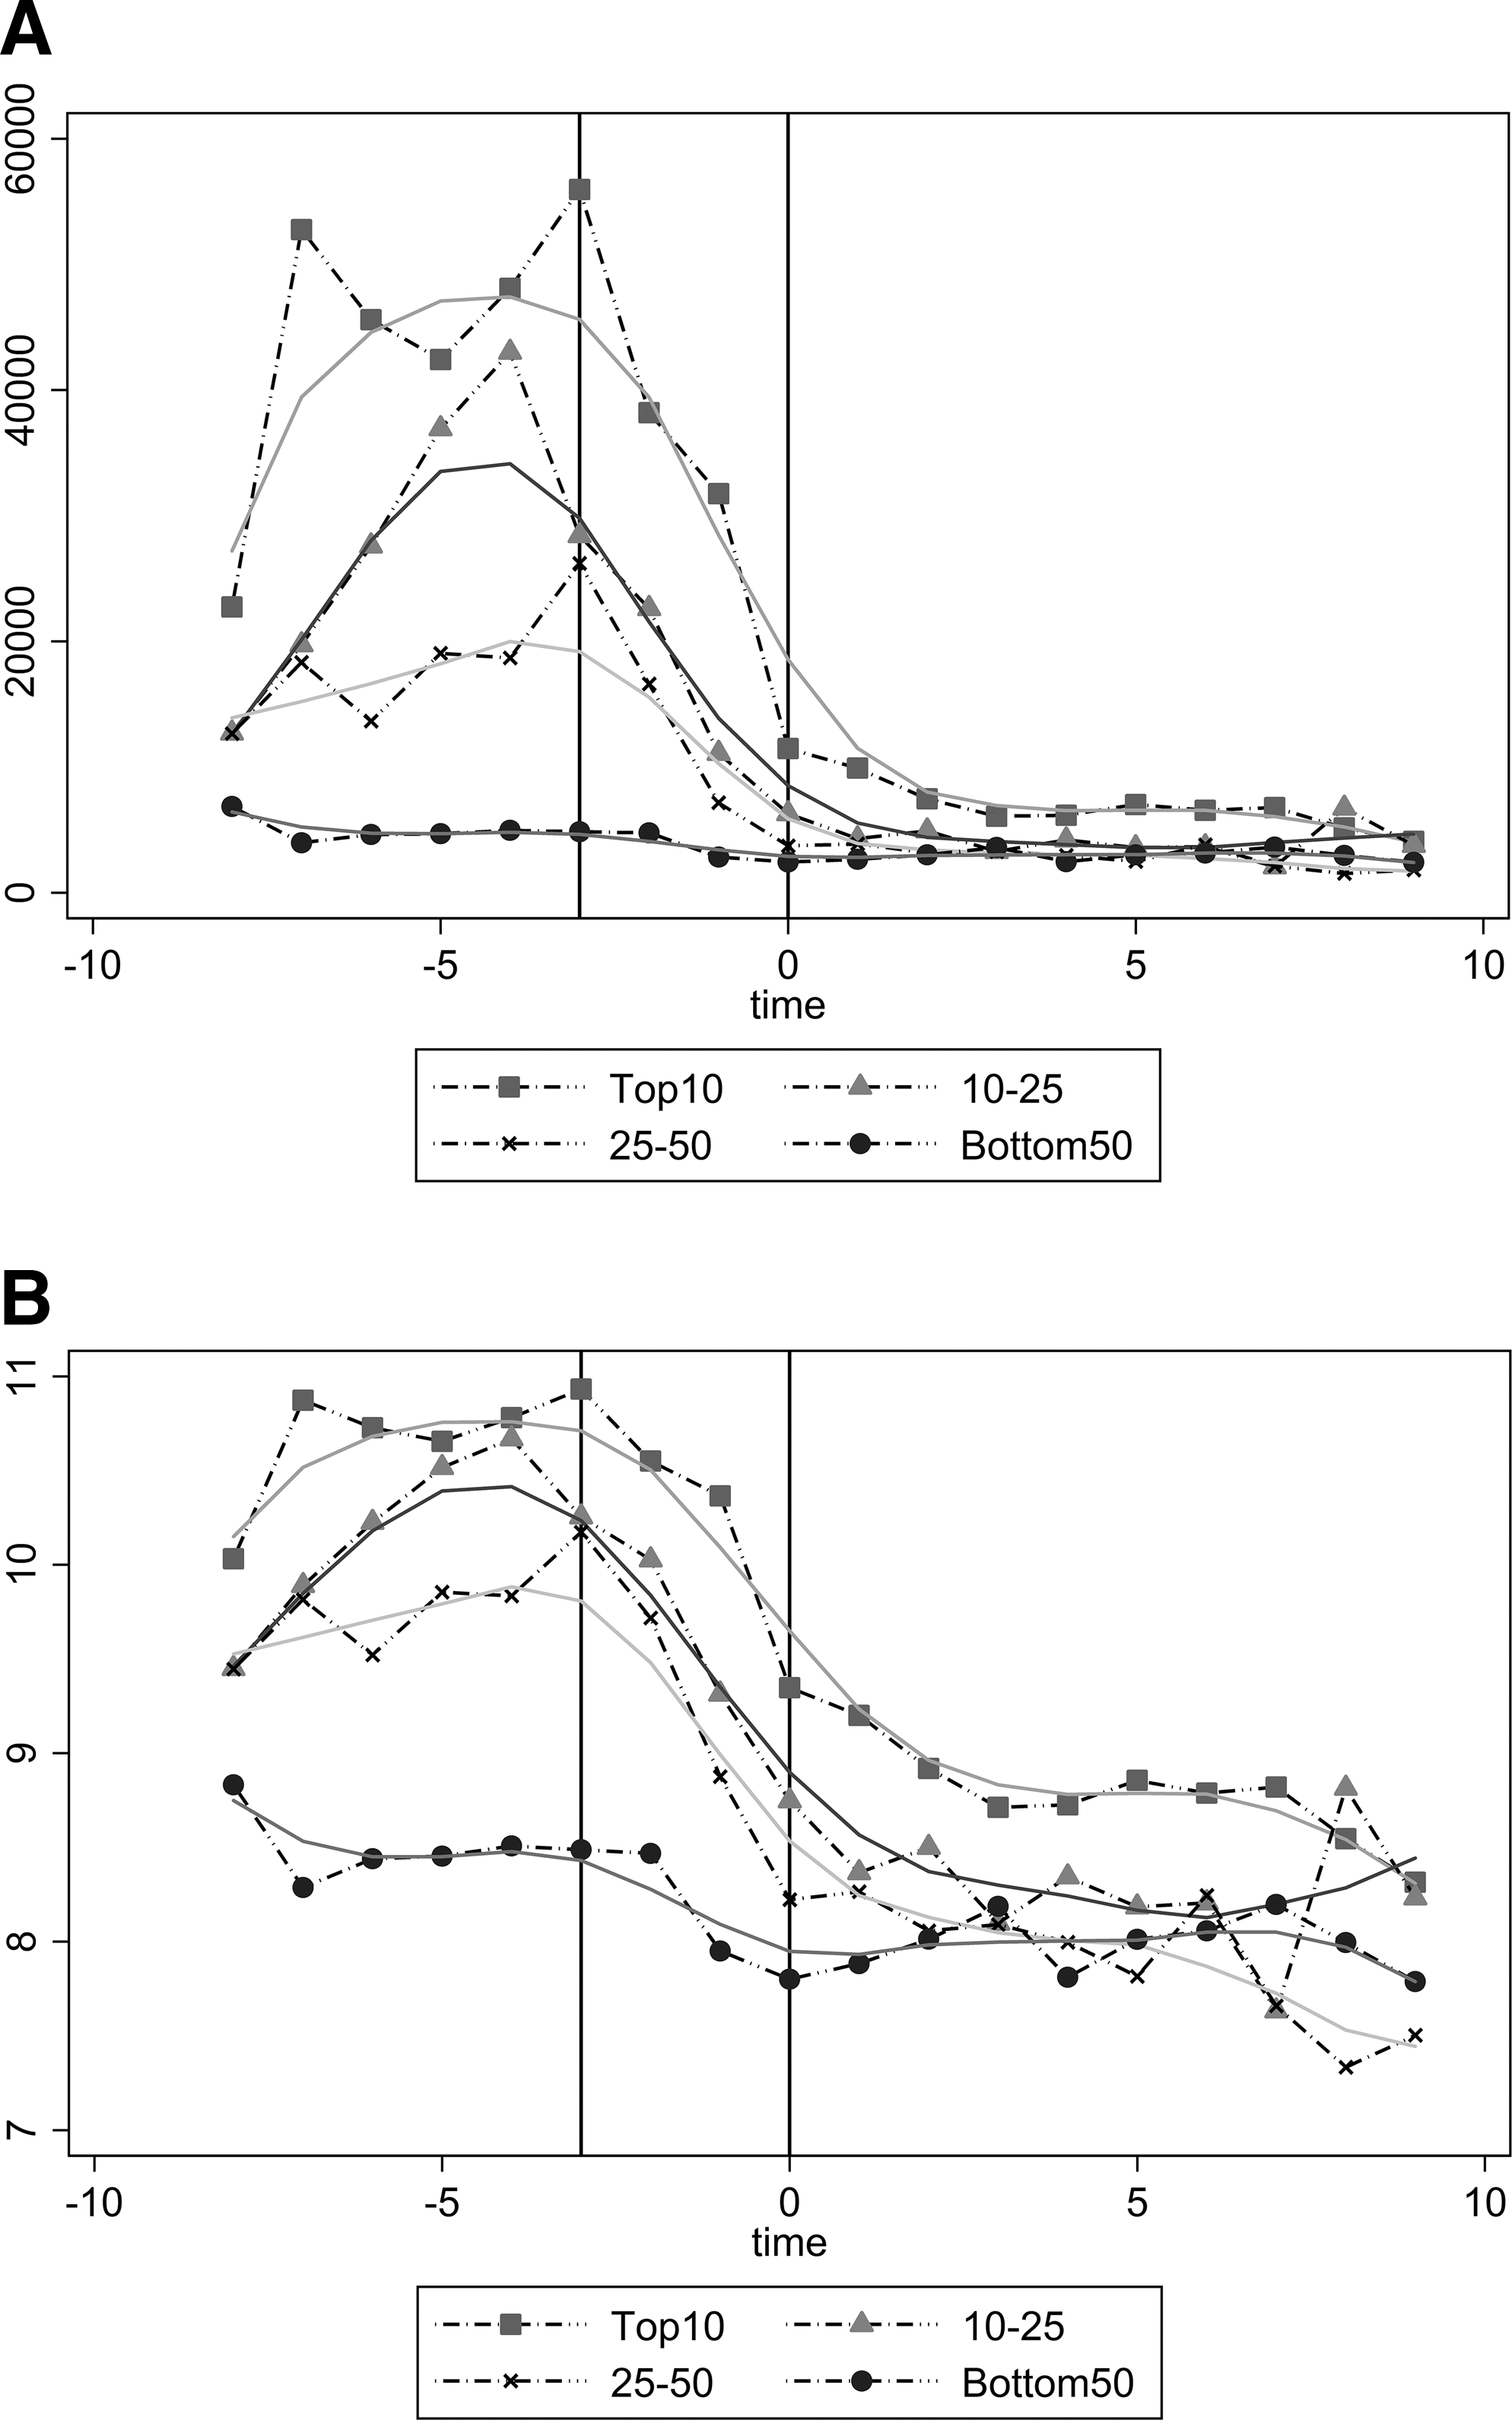

Inflation-adjusted monthly billed charges stratified by preintervention costs demonstrating a subset of patients with persistent high charges despite management.
Figure 3 shows that although most Care One patients exhibited significant reductions in billed charges, the most expensive 10% post expense billed charge patients remained persistently costly. Costs for this stratified group peak at $28,040 and then level off at approximately $17,000 post intervention.
Discussion
Evaluating the trajectories of billed charges for the Care One cohort of high-cost, medically complex patients, this study demonstrates a nonlinear trajectory of charges. Notably, charge trajectories spike substantially then drop considerably to a sustained level of charges. This may reflect “the natural history of illness that flares up and then improves over time, the impact of care on the course of disease, and mortality,” suggested by Johnson et al 4 in their study of super-utilizers. Although the high-cost patients identified in the present study were based on spending rather than hospitalizations (as in the Johnson et al study 4 ), there is a similar population demographic characterized by high proportions of uninsured and publically insured populations.
In terms of initial costs, the average per-person billed charge for the 9 months before the intervention was $120,166 and a substantial reduction in billed charges was found. Mean postintervention expenditures were $29,912. The average charges for patients in the Johnson et al 4 study were $113,522 and then reduced to $63,434 after 1 year, and $47,017 after 2 years. A multivariate analysis found a pre-post per-patient reduction of $92,227 and a difference-in-difference reduction of billing charges of approximately $44,000 compared to a control group (see Horn et al 10 for more details). Note that the present study sample represents patients who received intensive care management; thus, the larger reduction in this sample could in part be related to the contributions of the Care One program.
Another important aspect of this analysis is the comparison of the trajectories of the Care One treatment group with the high-cost comparison group. The control group followed a very similar pattern of spending reduction to that of the intervention group, potentially indicating a statistical phenomenon known as reversion to the mean. Reductions in spending may reflect the concentration of spending to address a high-cost event such as a stroke, heart attack, or pneumonia that requires hospitalization and expensive treatment, but that ultimately returns to a baseline stabilized condition. It is important to note that if other high-cost populations follow the same trajectories as this Care One cohort, pre-post studies may overestimate the impact of the intervention. Additionally, this study's high-cost patients' spending patterns exhibit considerable variability, which Wodchis et al 3 and Johnson et al 4 also noted.
Stratifying the sample by baseline charges, the present study found a large heterogeneity in costs in a selected cohort of high-cost patients. This suggests that studies that simply focus on retention in the high-cost group (top 1%) may miss important information about cost changes within the group. However, it is interesting to note that all preintervention cost stratified groups appear to converge on a similar post expenditure trajectory (with the top 10% staying slightly higher than the other 50%). Additionally, the substantial reductions in billed charges did not happen with all patients. There is a subset of patients (stratified top 10% most expensive post enrollment) who demonstrated a return to high-cost spending after a brief small dip. An analysis focused on this subset of continued high-cost patients has the potential to provide information about the reasons for continued high costs and the best approach to reducing them. Johnson et al 4 demonstrated marked variability in sustained spending in their high-utilizer group, identifying renal dialysis patients and terminal cancer patients as 2 groups who maintained or increased their high utilization after identification. Other groups, such as trauma patients, orthopedic surgery patients, those with mental health diagnoses, and those with multiple chronic diseases, demonstrated reductions. Recognition of this marked heterogeneity of high-cost patients and targeted interventions appears to offer a promising approach to further reductions in spending for high-cost groups.
Overall, the results of this paper demonstrate substantial reductions in spending on high-cost patients after expensive events. Opportunities to target and manage high-cost patients have been identified. Bodenheimer et al 6 have described models for chronic care management that include engaged leadership, data-driven improvement, empanelment, and team-based care. McCarthy et al 16 summarized attributes of successful care models for high-cost patients. Attributes included: targeting individuals most likely to benefit from the intervention, comprehensive assessment of patients' health-related risks and needs, and coordination of care and communication among the patient and care team. These are attributes of the Care One program. Additionally, recent imposition of penalties for hospitals for high readmission rates through value-based purchasing may provide incentives to improve the relationship and coordination of care for chronically ill patients. 17 Many recent payment interventions have targeted the chronic care needs of patients after a hospitalization. The Centers for Medicare & Medicaid Services has recently provided payments for chronic care management 18 and for transitions from the hospital in the hope of reducing further hospitalizations.
The economic impact of programs targeting high-cost, medically complex patients is an open research question. Emeche 19 and Newton and Lefebvre 20 have recently discussed and debated the benefit of targeting super-utilizers to reduce health care costs. Although both perspectives recognize the value of identifying high-utilizers, Newton and Lefebvre caution that high-utilizer programs should target those who can be managed based on their underlying problem and should not distract from the need to improve primary health care more efficiently for all patients.
Moreover, a number of studies have evaluated the impact of programs designed for high-cost, medically complex patients utilizing relatively weak study designs. 21 The present analysis suggests that the natural course of high-cost, medically complex patients is a large spike in costs followed by a substantial reduction in costs. Given this natural course, pre-post studies may overestimate the impact of interventions for high-cost patients. Thus, incorporating a control group into the analysis in the empirical model is important.
Unfortunately, generating a high-cost, medically complex control group can be difficult. This study utilized a control group made up of a cohort of slightly less expensive patients, but the structural difference between the top 1% most expensive patients and the next group of slightly less expensive patients is not well known. There were differences between the top 1% and the next most costly group in the study population. Moreover, the trajectories of charges for both the Care One group and the constructed control group are highly nonlinear. Although the difference-in-difference model estimated by Horn et al 10 is a considerable improvement over standard pre-post models, it is designed for linear structural breaks; thus, it is not perfectly suited for the considerable nonlinear trajectories found in billed charges for high-cost, medically complex patients (such as the Care One cohort). This adds justification for the implementation of randomized controlled studies and for further work to be conducted deriving more sophisticated models that do not require the linear trends assumption, such as a proportional effects model or a semiparametric Cox model. As noted previously, a randomized controlled study of Medicare beneficiaries showed little improvement in overall net savings for care coordination. 9 However, these programs did not focus on the highest cost patients as the present study did.
A limitation of this study is that the data represent 1 institution. Institutions with different patient mixes might experience different payment reductions over time as suggested by Powers and Chaguturu. 5 Also, the high-cost group includes effects from a care management intervention. The study team cannot estimate how the spending curve might have differed without this intervention, although the team believes it would have followed a pattern similar to that of the control group. The study team also screened out certain patients from the intervention group whose spending was not anticipated to be affected by management and primary care empanelment, such as trauma patients. Inclusion of this group likely would have resulted in an even greater reduction in post-entry spending in the Care One group than what was found in the study.
Thus, overall future work should focus on identification of the causes and management of high-cost events, their time course, various subsets, and obtaining reliable comparison groups. Recognition of the patterns of high-cost events also could lead to research on how to detect impending high-cost events at an earlier stage to prevent or mitigate them. The monitoring of patient care utilization through data management systems may offer the opportunity for an early warning system of impending high-cost events based on the patterns of use. Such an approach could supplement current case management programs that focus on high utilizers after the high-cost events have occurred.
Conclusion
This study provides valuable information about the trajectories of spending patterns for high-cost, medically complex patients. It is found that these trajectories are highly nonlinear, characterized by a spike in charges prior to enrollment, followed by a considerable and sustained drop in charges afterward. This suggest that the natural course for many high-cost patients is marked reduction in spending and absent any intervention, mean billed charges for high-cost, medically complex patients likely will decrease. Intervention programs are best targeted on those who will benefit because of anticipated continued cost. Better understanding of the time course and variability of spending can provide insight to programs designed to reduce spending and improve health in this cohort, particularly focusing attention on those patients with sustained high spending. Additionally, the study results reinforce the importance of utilizing a control group when evaluating any intervention focused on high-cost patients. It is only through the process of comparison of spending with those not subject to an intervention that one can assess whether improvements in spending occur above and beyond the substantial reductions that occur without interventions.
Footnotes
Acknowledgments
The authors would like to thank Michael Hensley, MA, and Maurice Moffett, PhD, for initial help conceptualizing the economic impact of the Care One Program. Also, the authors would like to thank Kurt Lavetti, PhD, and Alok Bohara, PhD, for helpful comments regarding distributional analysis.
Author Disclosure Statement
Drs. Horn, Crandall, Binder, and Sklar declare no potential, perceived, or real conflicts of interest with regard to the authorship and/or publication of this article. Financial support for this article was provided by the Robert Wood Johnson Foundation Center for Health Policy at the University of New Mexico.