
Abstract
Sleep disturbance is negatively associated with workplace productivity. This study sought to identify whether or not changes in sleep from 2012 to 2013 were associated with changes in health risks, medical conditions, or workplace economic outcomes. Employees of a Fortune 100 financial services corporation were categorized based on changes in self-reported hours of sleep from 2012 to 2013 and compared based on their health risk factors, medical conditions, health care costs, and productivity measures. Consistently poor sleepers had more health risks and medical conditions compared to consistently optimal sleepers. Sleep improvers had a significant reduction in lost on-the-job productivity while consistently poor sleepers and downgraders had significantly more lost productivity compared to optimal sleepers. Employers may wish to incorporate sleep education initiatives as part of their overall health and wellness strategy.
Introduction
Q
Insufficient sleep has an economic impact on organizations in both direct and indirect ways. 6 Insomnia is associated with increased health care utilization 7 and the economic impact of direct and indirect costs has been estimated in the tens of billions of dollars annually. 8,9 Indirect costs such as absenteeism, productivity loss, and motor vehicle accidents associated with insomnia were estimated to top $100 billion. 8 Measuring the economic impact of presenteeism (lost on-the-job productivity) related to sleep disorders can be difficult, but employers are increasingly concerned with those costs as well. 10
Although corporations have utilized health risk appraisals (HRAs) to measure the health of their employee population for more than 3 decades, sleep often has not been included as one of the common health risk factors. Typical HRA questionnaires in the past inquired about average sleep duration and often incorporate that measure into a stress score. As a stand-alone employee health risk factor, however, it is only recently being studied.
A companion study 11 to the current study found health care costs, absenteeism, short-term disability (STD) claims, and presenteeism all showed a U-shaped relationship with hours of sleep with the nadir occurring at 7–8 hours of sleep per night. Employees averaging less than optimal levels of sleep (≤6 hours) as well as those who sleep more than the recommended amount (≥9 hours) were found to have a higher average number of health risks and economic measures compared to those averaging optimal sleep amounts (7–8 hours). Similarly, employees in the non-optimal sleep categories were more likely to have several individual health risks and medical conditions compared to other employees.
Prior studies of employee health risks have found that changes in health risks are associated with changes in workplace outcomes such as health care costs and absenteeism. 12 –15 The current study examines the changes in health risks and productivity measures associated with changes in employee sleep levels over time.
Methods
Study population
Subjects in this study were employees of a multinational Fortune 100 financial services corporation with major offices across the United States. In 2012, the corporation employed more than 20,000 employees in the United States. The average age of employees was 43 years and 60% of employees were female. Employees were eligible to enroll in a Consumer-Directed Health Plan with a health spending account as their only health plan option. In addition, the company offered a global well-being (“wellness”) program, which features best-in-class resources, and an annual confidential HRA. The wellness program goals are to improve employee health, business productivity/performance, and to control health and productivity cost trends.
Measures
This company offers an annual confidential HRA to all employees as part of the health and wellness program. The current study population is comprised of the 7143 employees who completed both the 2012 and 2013 HRA questionnaires and were enrolled in the company's health care plan. In 2012, the HRA was offered between February and June. In 2013, the HRA was offered from July to September, so there were at least 13 months between HRAs and at most 19 months. These 2-time HRA participants had an average age of 43.1 years, 63.7% were female, and 90.6% worked a daytime shift. These demographics were not statistically different from the entire group of 2012 HRA participants. Although only 1.7% of the 2-time HRA participants self-reported insomnia as a chronic condition, 20.6% reported “quite often” or “almost always” feeling tired during waking hours.
The HRA questionnaire includes self-reported biometric measurements as well as a variety of other health-related questions. Participants were asked to report how many hours, on average, they slept each day and were informed that this number can be quite different from the number of hours spent in bed trying to sleep. Other questions measured health risks such as tobacco use, alcohol use, and physical activity as well as medical conditions such as asthma, allergies, heart disease, and others. For the purposes of this study, employees were grouped into 2 sleep categories based on their self-reported average hours of sleep. Employees with 7 or 8 hours of sleep per night were classified in the “optimal” sleep category. Employees sleeping ≤6 hours or ≥9 hours were classified in the “poor” sleep category because many studies 16 –19 have shown that 7–8 hours of sleep is most associated with optimal overall health. Because the HRA was completed by employees in both 2012 and 2013, each employee was classified according to his or her sleep at both time points. The change in sleep analysis compares employees who “remained poor,” “downgraded (optimal to poor),” “improved (poor to optimal),” and “remained optimal” from 2012 to 2013.
An 8-item version of the Work Limitations Questionnaire (WLQ), 20,21 which has been tested for validity and reliability, 22 was included in the HRA to assess the health-related impact on work performance known as presenteeism. Presenteeism is operationalized in different ways in the worksite wellness literature. In some studies, presenteeism is the amount of time employees choose to attend work even though they have an acute illness such as a cold or flu. In other studies, including the current study, it is a broader measure of the reduction in on-the-job work productivity associated with physical or mental health-related factors. The presenteeism questions evaluated the percentage of time at work that an emotional or physical problem interfered with 1 or more of 4 work domains: time management, physical work activities, mental/interpersonal activities, and overall output or productivity. Employees were asked to base their responses on their previous 2 weeks of work and to rate any impairment on a 5-point scale of all of the time (100%), most of the time, half of the time (50%), some of the time, and none of the time (0%). Additionally, the response option does not apply to my job also was provided. The brief version of the WLQ was scored as 4 subscales, representing the 4 work domains. A separate dichotomous score for each subscale (yes/no) indicated whether or not any work limitations were noted for either of the 2 items that made up each subscale (ie, amount of limitation for either item) on both the 2012 and 2013 HRAs. The response for each subscale was judged to be valid if a rating was provided for at least 1 of the 2 items in each scale. A dichotomous overall work limitation score also was constructed to indicate whether any of the 4 work domains was affected and a percentage of presenteeism was calculated for each subject.
Using de-identified data, STD absences, medical, pharmacy, and HRA responses were linked by a third-party vendor for 2012 and 2013 participants and these de-identified data were transmitted to a major US university for analysis. This study was conducted in accordance with that university's Institutional Review Board.
Analysis
SAS 9.0 (SAS Institute, Inc., Cary, NC) was used to conduct all statistical analyses. Demographic variables were tested using t test for the continuous variables and chi-square test for the categorical variables to determine whether those who completed the HRA were different from those who did not participate. Generalized linear modeling and multiple logistic regression were used to test for changes in outcome measures by sleep change category while controlling for age, sex, ethnicity, job category, work shift, and other confounding factors.
Results
Demographics
Among the study population of 2-time HRA participants, 29.8% remained poor sleepers from 2012 to 2013. A total of 11.8% experienced worsened sleep from optimal to poor and is a group this study terms “downgraders,” 10.0% improved from poor to optimal (“improvers”), and 48.5% remained in the optimal sleep category. A comparison of the demographics of employees in each of these 4 categories can be found in Table 1.
SD, standard deviation; STD, short-term disability.
Health risk change by sleep change category
For employees who changed their sleep category (downgraders who worsened from optimal sleep to poor sleep vs. improvers who moved from poor sleep to optimal sleep), the change in prevalence of high health risk for each of the health risk factors was studied. Several risk factors showed significant changes in prevalence when comparing downgraders versus improvers. The results can be seen in Figure 1.

Change in health risk prevalence by sleep change category. *P < 0.05 Chi-square comparing change in risk prevalence in one sleep category with another.
The health risks that showed a significant difference in prevalence change between sleep downgraders and improvers were: high stress, insufficient physical activity, life dissatisfaction, and tobacco use. For example, downgraders saw an increase in the percent at high risk for stress of 4.9 percentage points while sleep improvers saw a decrease in the percent at high risk for stress of 4.3 percentage points. These differences in change were significant, even after controlling for the confounding factors of age, sex, ethnicity, work shift, and job type. The average number of health risks is another indicator of the health of an employee population. The average number of health risks for each sleep change group was calculated for both 2012 and 2013. The results can be found in Figure 2.
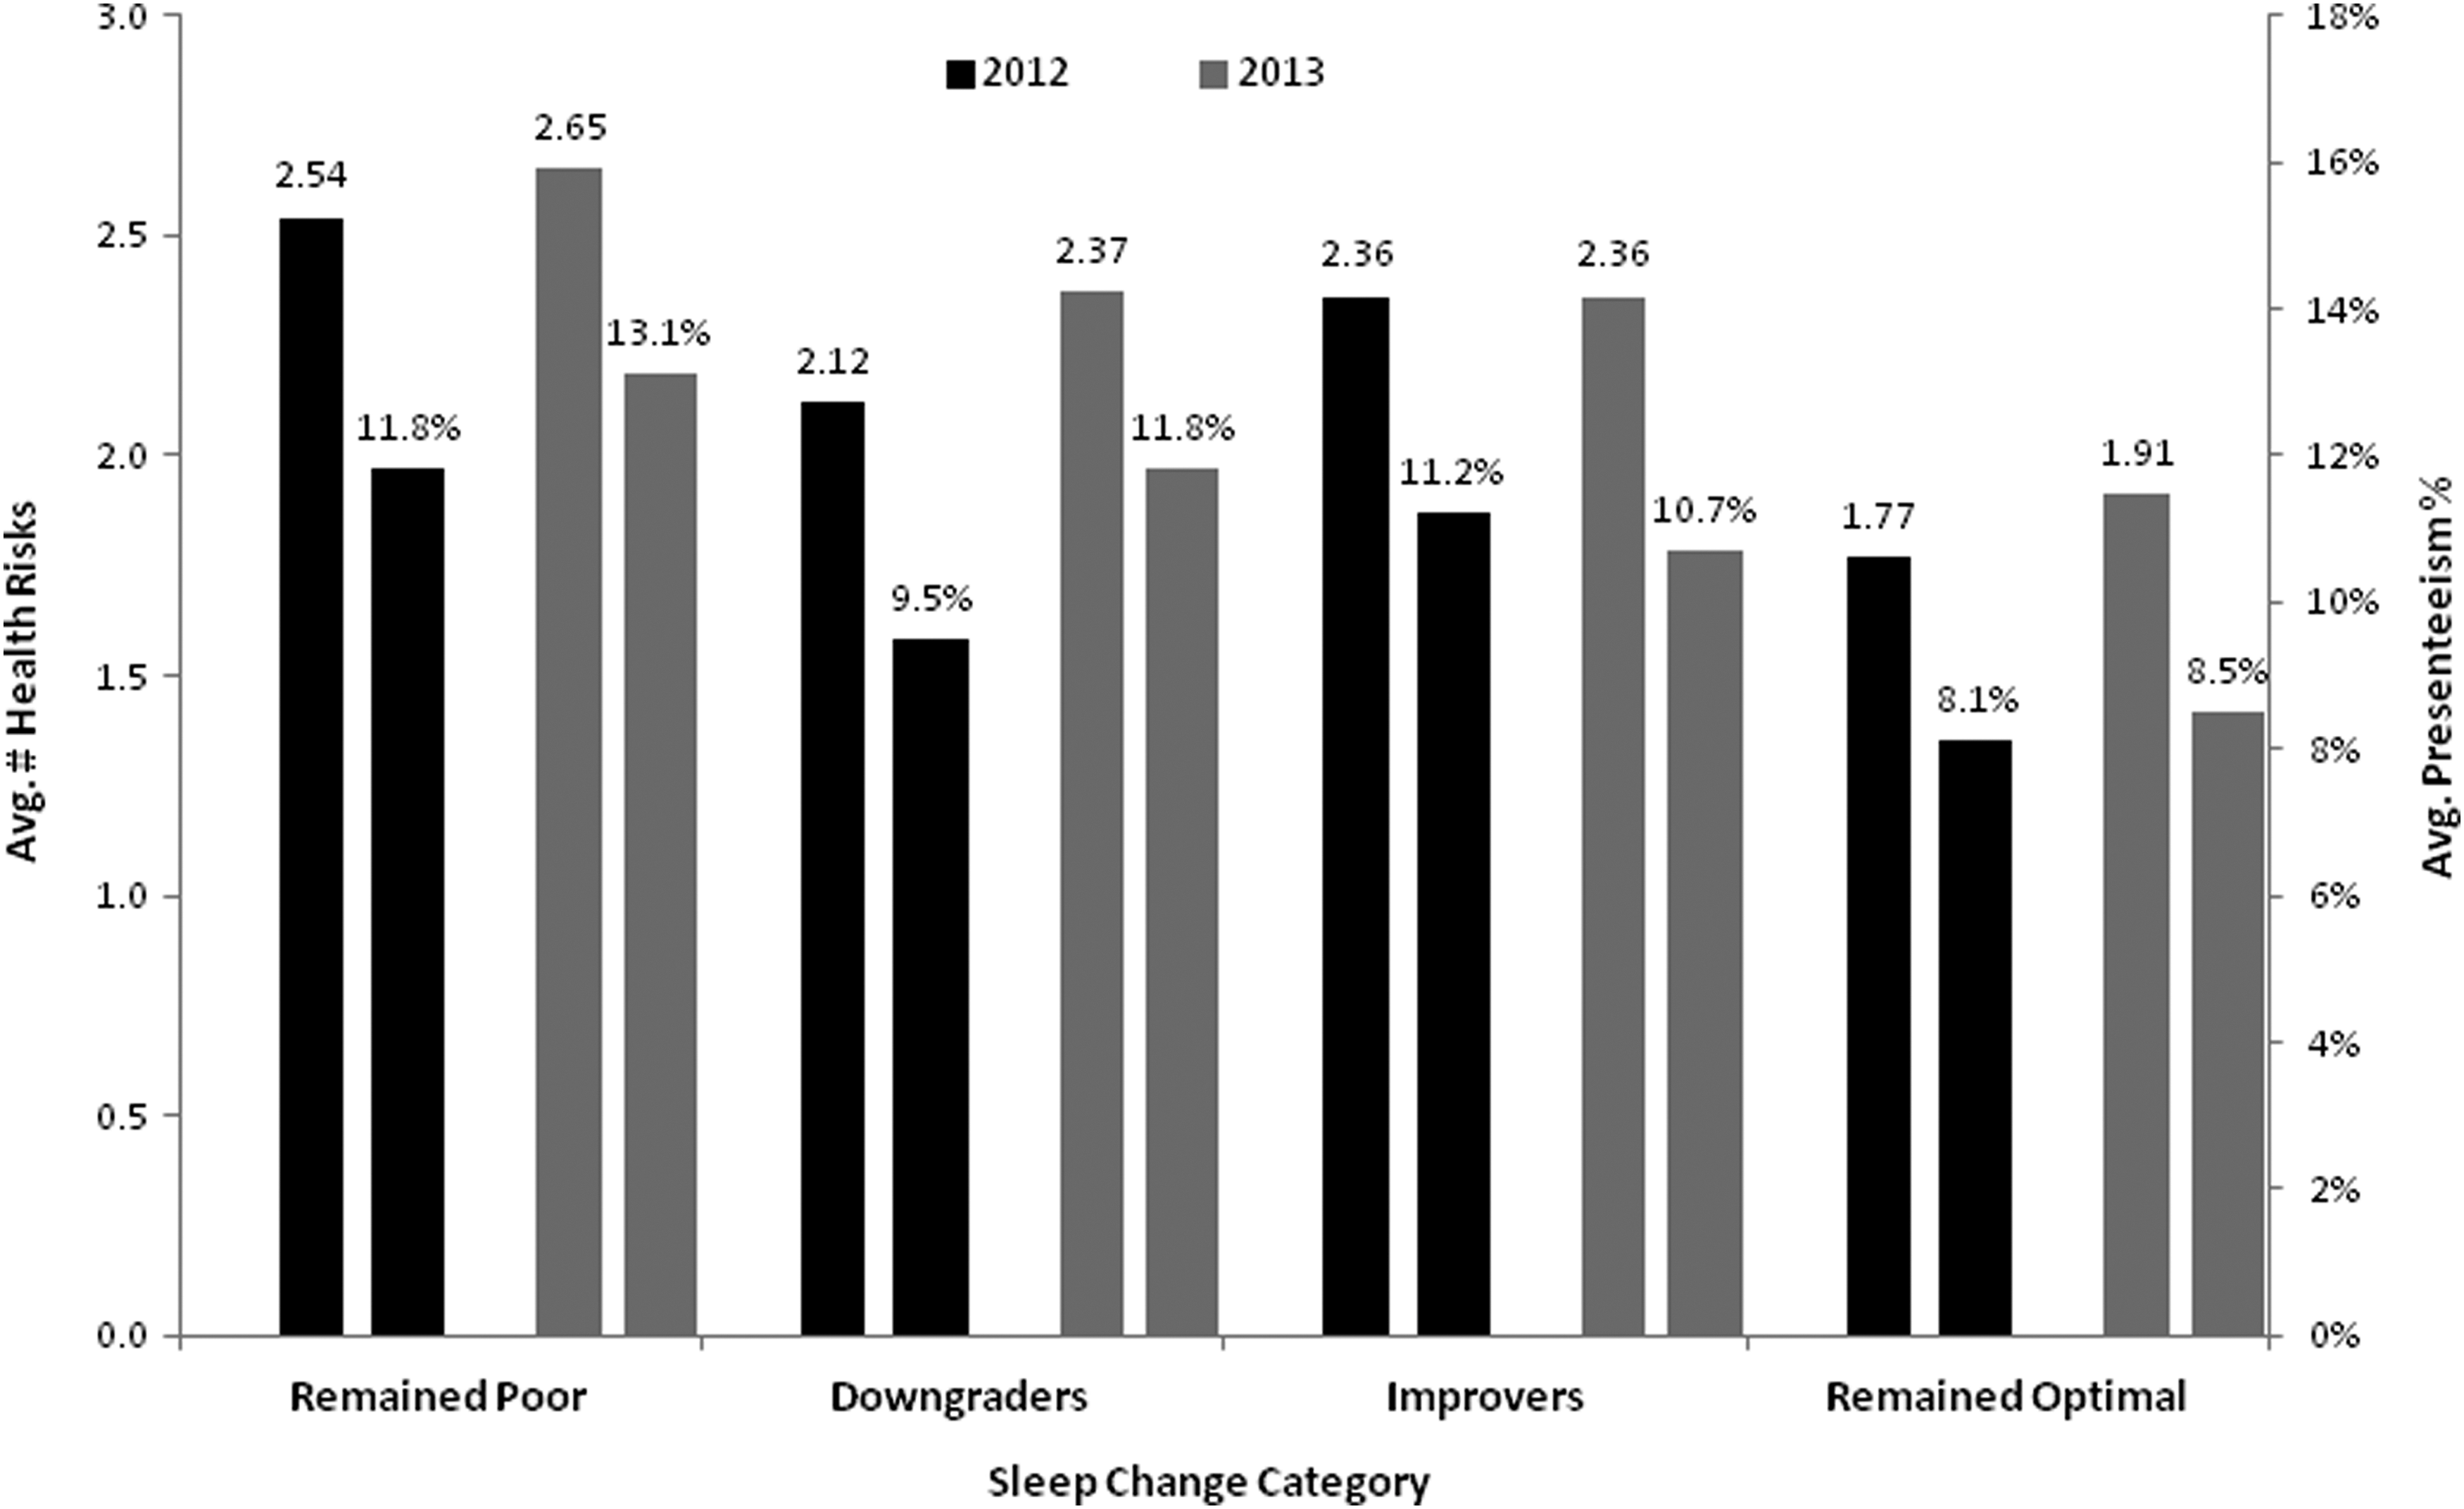
Average health risk factors and average presenteeism percentage in 2012 and 2013 by sleep change category.
Employees who remained in the poor sleep category or in the optimal sleep category had a similar change in the average number of health risks from 2012 to 2013 (0.11 risks and 0.14 risks, respectively). However, the magnitude of health risks was much different, with consistently poor sleepers having 0.77 more health risks, on average, than consistently optimal sleepers in 2012 and 0.74 more in 2013. Interestingly, the average number of health risks remained unchanged for the sleep improvers. Sleep downgraders reported a 0.25 increase in health risk factors. It is interesting to note that in 2012, the downgraders were in the optimal sleep category that year but their average number of health risks (2.12) was larger than the 1.77 health risks for the optimal sleepers who remained optimal in 2013. Similarly, the improvers, who were poor sleepers in 2012, had fewer average health risks in that year compared to the poor sleepers who remained poor in 2013. These changes in health risk factors were significantly different across all groups, when controlling for confounding factors.
Change in presenteeism
As was mentioned in the Methods section, the HRA questionnaire used by this organization contains a set of questions used to assess presenteeism, which is the health-related loss of productivity while on the job. The presenteeism scale has 4 components (time limitation, physical limitation, mental limitation, and output limitation) as well as a total score indicating any work limitation and a calculation of the average presenteeism (percentage loss of on-the-job productivity). Table 2 shows the presenteeism results by sleep change category.
P < 0.05 Chi-square test of odds of having limitation in 2013 compared to “remained optimal” group, controlling for age, sex, ethnicity, job type, and work shift.
P < 0.05 generalized linear modeling testing difference in change in presenteeism compared to “remained optimal” group, controlling for age, sex, ethnicity, job type, and work shift.
Results show that a majority (63.3%) of the consistently poor sleepers reported any work limitation in 2012, which compares to 57.1% of the downgraders, 63.1% of the improvers and 52.9% of the consistently optimal sleepers. Multivariate logistic regression tests were performed to determine whether the odds of having presenteeism in 2013 were different for sleep change groups compared to the reference group of the consistently optimal sleepers. Both the consistently poor sleepers and the downgraders were significantly more likely to have any work limitation in 2013 compared to the consistently optimal sleepers, while controlling for confounding factors. The consistently poor sleepers also were significantly more likely to report limitations in all 4 domains compared to the consistently optimal sleepers. Downgraders were more likely to report mental and output domain limitations compared to optimal sleepers. Improvers were less likely to report an output domain limitation in 2013 compared to consistently optimal sleepers. The change in average presenteeism percentage also was significantly worse for the consistently poor and downgraders compared to the consistently optimal sleepers.
Self-reported medical conditions
The HRA used by this corporation also includes a set of questions asking whether or not employees had certain medical conditions such as arthritis or depression. Respondents indicated whether or not they currently had any of the medical conditions and then whether or not they were under medical care and/or taking medication for the condition. The prevalence of each medical condition on the 2013 HRA was examined for each of the 4 sleep change groups. Results can be seen in Figure 3 where it is clear that consistently poor sleepers have a higher prevalence of all 16 medical conditions compared to consistently optimal sleepers. The medical condition that was most prevalent was high blood pressure, experienced by 23.1% of the consistently poor sleepers, followed by hay fever/seasonal allergy (20.4%), and lower back pain (19.5%). Sleep downgraders and improvers experienced mixed results, with a larger or similar prevalence of 9 of the 16 medical conditions among improvers compared to downgraders.
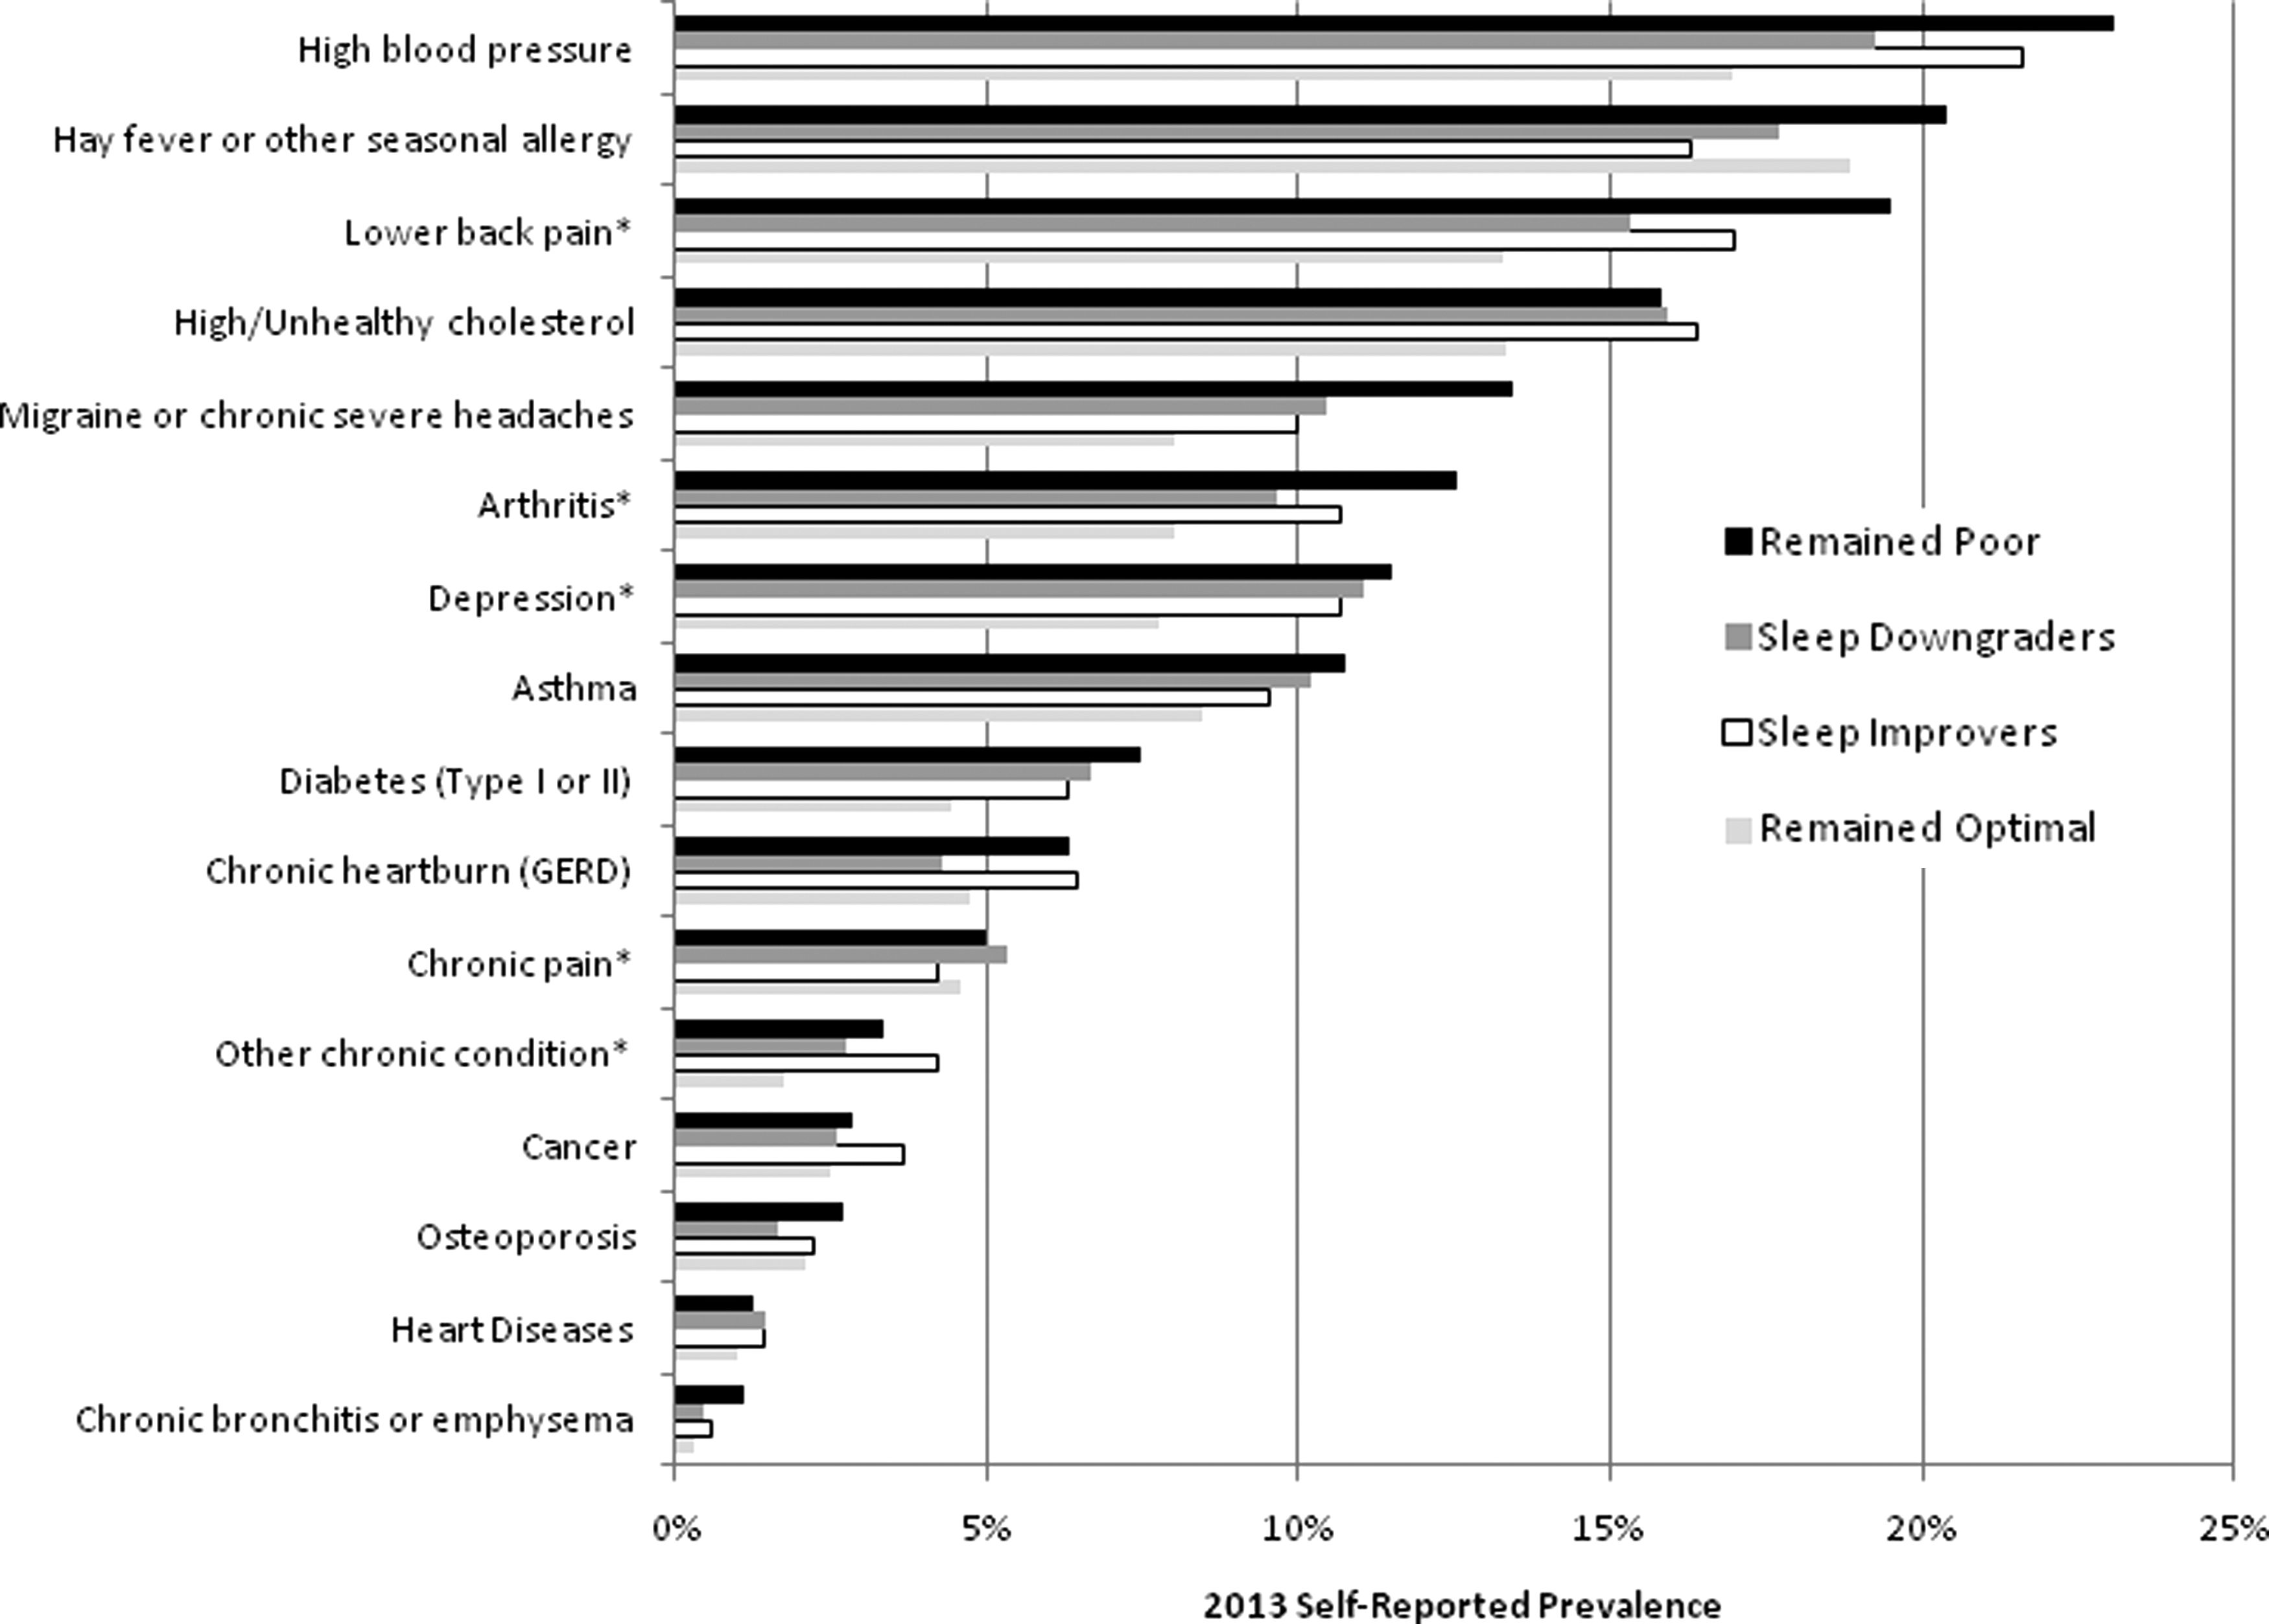
2013 Self-reported prevalence of health conditions by sleep change category. *P < 0.05 comparing “remained poor” with “remained optimal” group. GERD, gastroesophageal reflux disease.
Self-reported measures of sleep
The sleep change categories used in this study were created based on the self-reported average number of hours of sleep for each employee who took the HRA in 2012 and 2013. It was interesting to compare the sleep change groups on 2 other self-reported measures of sleep from the HRA. The first measure asked employees if insomnia was a chronic condition for them. As can be seen in Table 3, consistently poor sleepers were consistent in their reporting of insomnia (3.2% in 2012 and 3.7% in 2013). They also were consistent in their reporting of the second measure which was quite often or almost always feeling tired during waking hours. The other sleep change groups reported these answers commensurate with their sleep change category, with downgraders reporting an increase in both measures from 2012 to 2013 and improvers reporting a decrease during the same time period. As would be expected, the consistently optimal sleep group had the lowest prevalence of both measures.
Discussion
Sleep plays an important role in the health and well-being of all people. Getting enough quality and quantity of sleep at the right time can improve a person's chances of good physical and mental health. Sleep is vital to many physical functions and lack of sleep can impair those processes as well as a person's ability to make good decisions, cope with change, and work well with others. Achieving adequate levels of sleep can sometimes be a challenge for working adults, especially if they are balancing family life with young children or elder care or are working rotating or nighttime shifts. Given the importance of sleep, it is easy to see how chronic insufficient sleep might impact employee productivity and well-being.
Many employers are interested in helping their employees improve or maintain good health. It is often of interest to employers to determine whether or not changes in employee health behaviors or health risks over time are associated with changes in other workplace outcomes such as health care costs or productivity measures. The purpose of this study was to examine sleep among employees who completed confidential HRAs in both 2012 and 2013. Each employee was classified into a sleep change category based on their self-reported average hours of sleep on both HRAs. Then, various measures of employee health and productivity were calculated for each sleep change group.
The 4 sleep change categories were comprised of those who remained poor sleepers, those who moved from optimal to poor (“downgraders), those who moved from poor to optimal (“improvers”), and those who remained optimal. Average age was similar in all 4 groups of employees–between 42 and 44 years of age. The gender distribution found the largest percentage of females in the consistently poor sleep group (66.4% female) compared to the other groups that were 62% or 63% female. This finding is supported by a British study of 8480 adults that found that women spend 15 minutes longer in bed each night but sleep 11 minutes less than men, on average. 23 Another study using home-recorded sleep logs and actimetry also found more nighttime awakenings and poorer sleep quality among women compared to men. 24 The consistently optimal group had the largest percentage of salaried employees and daytime shift workers. The average total health care costs in 2012 were similar across all 4 groups (ranging from $3434 for the consistently optimal group to $3687 for the improvers). Changes in health care costs from 2012 to 2013 were not significantly different across the 4 sleep change groups. There are several possible explanations why change in sleep was not associated with changes in health care costs in this study. Most likely, a longer follow-up period is needed to determine if changes in sleep are associated with future costs. The metabolic effects of poor sleep may not be reversed in the short and medium term. For example, it has been shown that a smoker's health care costs return to the level of a nonsmoker after about 10 years. 25
STD claims appeared to be slightly higher in downgraders (7.6% filed a claim in 2013), consistently poor sleepers (7.7%), and improvers (8.8%) compared to consistently optimal sleepers (5.7%), but these differences were not statistically significant. Because of differences in demographics among the 4 study groups, all further analyses controlled for age, sex, ethnicity, job category, and work shift.
Several health risks were associated with changes in sleep category. Downgraders had significant increases in the percentage of employees at high risk for life dissatisfaction, stress, insufficient physical activity, and tobacco use compared to sleep improvers from 2012 to 2013. Correlations between mental health and sleep were noted, consistent with the medical literature. Adults feeling or anticipating increased levels of stress are less likely to achieve optimal sleep 26 –28 and vice versa. Research has shown that sleep loss results in elevated stress hormones on the following day 29 and that sleep deprivation can exacerbate the response to stressful events. 30 The same type of complex relationship has been found with sleep and depression and anxiety. 31,32 That is, people who are depressed or anxious are not achieving adequate sleep and sleep problems may cause or contribute to those mental health problems as well. Similarly, if employees do not take time for proper sleep, they most likely do not take time for sufficient physical activity. 33 The reverse also can also be true because higher levels of physical activity have been shown to improve sleep. 34 –36
Consistently poor sleepers had the highest average number of health risks in both 2012 and 2013 (2.54 and 2.65, respectively) and consistently optimal sleepers had the fewest health risks (1.77 in 2012 and 1.91 in 2013). Those whose sleep got worse (downgraders) also saw an increase in their average number of health risk factors (2.12 in 2012 to 2.37 in 2013) and sleep improvers were the only group to maintain the same average number of risks (2.36 in both 2012 and 2013).
Of note, in 2012 downgraders were in the optimal sleep category, but they had 0.35 more health risks, on average, than the optimal sleep group in that year. This is an indication that they were not as healthy as the consistently optimal sleepers, even in 2012 when they reported the recommended amount of sleep. Similarly, improvers were poor sleepers in 2012, but they had 0.18 fewer health risks than consistently poor sleepers in 2012. They improved their sleep levels in 2013 and their health risks remained level (2.36 risks) while the health risks of consistently poor sleepers increased (from 2.54 in 2012 to 2.65 in 2013). Other studies have shown that improvements in average number of health risks are associated with reductions in overall health care costs. 12,37,38 Perhaps people in the downgrader and improver groups are very close to getting the recommended amounts of sleep and bounce back and forth around the goal of getting 7 hours of sleep each night from the time of the first HRA to the second. They may represent a group who sometimes get enough sleep and sometimes do not and therefore have a mixture of poor and optimal sleep characteristics. According to Figure 1, the improvers and downgraders show large changes in the stress and physical activity risk factors that are commensurate with their sleep changes. For example, sleep improvers had a 4.3 percentage point reduction in the prevalence of the stress risk factor and sleep downgraders had a 4.9 percentage point increase in the prevalence of the stress risk factor. Perhaps stress management programs might help employees manage their life stressors and limit their negative impact on sleep.
Prior studies on sleep and presenteeism have focused on specific job types (eg, long-haul truck drivers 39,40 ) or the impact of irregular shifts on work productivity and/or sleepiness. 41 –43 The current study examined changes in self-reported presenteeism and changes in sleep category from 2012 to 2013. The largest percentage of lost productivity was reported by consistently poor sleepers in 2012 (63.3% reporting any limitation and 11.8% average presenteeism). The 11.8% presenteeism result indicates that, on average, there is some type of work limitation 11.8% of the total working time for this group of employees. On the other hand, consistently optimal sleepers reported the least amount of lost productivity in 2012 (52.9% reporting any limitation and 8.1% average presenteeism). The percentage reporting any work limitation increased among sleep downgraders and decreased among sleep improvers, as did the average presenteeism. These results indicate that changes in sleep category are associated with commensurate changes in on-the-job productivity losses and that the best sleepers have the least amount of productivity loss. This result is in line with other studies of sleep reviewed in the Introduction, which show negative outcomes associated with poor quantity or quality of sleep. Consistently poor sleepers also consistently report the greatest levels of work limitation on the 4 productivity domains–time, physical, mental and output–while the reverse is true for consistently optimal sleepers. Sleep hygiene programs that educate and assist employees in improving their quality and quantity of sleep may be associated with improvements in workplace productivity, as they have found to be effective in improving sleep measures in past research. 44 –46
In terms of the self-reported medical conditions, the results were not clear for the downgraders compared to improvers. Downgraders had a higher prevalence of 7 medical conditions while improvers had a higher prevalence of 9 medical conditions. However, it was very clear that consistently poor sleepers had a higher prevalence of all of the 16 medical conditions compared to consistently optimal sleepers. The significant (P < .05) differences in prevalence occurred for lower back pain, arthritis, depression, chronic pain, and other chronic conditions.
It is understandable that employees who experienced pain, 47 in the form of back pain, arthritis, or migraines, would have more trouble sleeping than other employees. Recent research also has found an association between insomnia-related hyperarousal with increased chronic secretion of stress hormones such as cortisol, which may lead to hypertension, which also showed a large difference in prevalence between poor and optimal sleepers. 48 The relationship between poor sleep and development of type 2 diabetes is not well understood yet, 49 but studies have shown that patients with type 2 diabetes report more sleep problems than patients without diabetes, as was also shown here in the prevalence of that condition, although it did not reach statistical significance. A prospective study in Sweden showed that the 12-year risk of developing type 2 diabetes was independently predicted by self-reported difficulties in falling asleep, even after adjusting for obesity, lifestyle factors, and other risks. 50 Another study found that sleep duration showed a U-shaped relationship with insulin sensitivity and β-cell function in clinically healthy people. 51 There may be some underlying pathway either being interrupted by insomnia or causing insomnia, which also contributes to type 2 diabetes.
As a confirmation of the sleep change categories, the results of 2 self-reported sleep measures were compared with the sleep change groups. Not surprisingly, consistently poor sleepers reported consistent levels of chronic insomnia and feeling tired during waking hours. Downgraders saw an increase in those measures while improvers saw a decrease from 2012 to 2013. Consistently optimal sleepers had the lowest levels of insomnia and waking hour tiredness.
Because of the importance of optimal sleep for employee health and productivity, employers should consider including healthy sleep for employees as a component of their employee wellness program. The study organization has found positive results in an evaluation of their workplace-based sleep education program. 46 Employees participating in their intranet-based educational program reported improvements in many aspects of sleep quality and quantity, as well as productivity measures, from baseline to post program. A few other studies of sleep improvement programs also have reported improved outcomes. 44,45,52 Workplace policies, such as increasing employee exposure to natural light 53 or recommending that employees limit the use of mobile devices for checking work emails at night, 54 also may be an effective option to help employees improve sleep.
Limitations
A potential limitation of this study is the use of self-reported hours of sleep rather than objectively measured sleep. Some studies have used wearable technologies to measure sleep. 39 However, the confirmation of other sleep indicators (chronic insomnia and “quite often” or “almost always” feeling tired during waking hours) gives an indication that the sleep categories were valid. Many validated, comprehensive sleep assessment tools are available to researchers such as the SLEEP-50, 55 the Epworth Sleepiness Scale. 56 However, many sleep questionnaires are designed to identify a clinical sleep disorder, which was not the purpose of the current study. Moreover, the HRA questionnaire used in this employee population contains many questions because it is measuring so many aspects of employee health and well-being. It is always a priority of this organization to keep the questionnaire as short as possible, while still obtaining the desired measures.
Another limitation is measuring sleep at just 1 time point in 2012 and again in 2013 (the HRA asks about the average amount of sleep in the previous month). Seasonal variations in sleep could be different and might alter the sleep change categories that were created in this study. It is possible that changes in sleep need to be maintained over a longer time period in order to show associations with health care costs. Future research in this area might benefit from a longer measurement period. Another limitation is that there was no way to identify or exclude employees with obstructive sleep apnea from this study. This group potentially needs specific medical interventions to address their quality of sleep and its impact on productivity from daytime drowsiness.
Conclusions
This study examined 4 groups of employees based on changes in self-reported hours of sleep from 2012 to 2013. Groups were compared on a variety of employee health risk factors, medical conditions, health care cost, and productivity measures. Changes in sleep were not associated with significant changes in health care costs or STD absence days. However, consistently poor sleepers had more health risks and medical conditions compared to consistently optimal sleepers. Sleep improvers had a significant improvement in their on-the-job lost productivity while consistently poor sleepers and downgraders had significantly more lost productivity from 2012 to 2013 compared to the consistently optimal sleepers. Employers and other organizations should consider incorporating sleep education initiatives as part of their overall health and wellness strategy.
Footnotes
Author Disclosures
Drs. Chen, Schultz, Burton, and Mr. Li declared that they have no conflicts of interest with respect to the research, authorship, and/or publication of this article. The authors received no financial support for this article.