
Abstract
Elderly seasonal migrators share time between homes in different states, presenting challenges for care coordination and patient attribution methods. Medicare has prioritized alternative payment models, putting health care providers at risk for quality and value of services delivered to their attributed patients, regardless of the location of care. Little research is available to guide providers and payers on the service use of seasonal migrators. The authors use claims data on fee-for-service (FFS) Medicare beneficiaries' locations throughout the year to (1) identify seasonal migrators and (2) describe the care they receive in each seasonal home, focusing on primary care and emergency department (ED) visits and the relationships between the two. In all, 5.5% of the Medicare aged FFS population were identified as seasonal migrators, with 4.1% following the traditional snowbird pattern of migration, spending warm months in the north and cold months in the south. Migrators had higher rates of ED visits and primary care treatable (PCT) ED visits than the nonmigratory groups, controlling for location, age, race, sex, Medicaid status, season, and comorbidities. They also had more visits with specialist physicians, more days with outpatient services, and more days seeing a physician in any setting. Having local primary care strongly reduced rates of both PCT ED visits and total ED visits for all migration categories, with the greatest reduction seen in PCT ED visits by migrators (local primary care was associated with a 58% reduction in PCT ED visits by snowbirds and a 65% reduction in PCT ED visits by other migrators).
A
Development of migratory–sensitive payment models will require information on the prevalence of seasonal migration and the health care utilization of these Medicare beneficiaries. No national data sources currently focus on this population; the best recent study uses data from 2000–2003 and looks only at seasonal migrants into Florida. 2 Nor are there any recent studies of the health care service use of this population as they move between their seasonal homes. 3 This study addresses these important gaps in the literature, providing information immediately relevant to the design of new payment models.
This study uses claims data on fee-for-service (FFS) Medicare beneficiaries' locations throughout the year to (1) identify seasonal migrators and (2) describe the care they receive in each seasonal home, focusing on primary care and emergency department (ED) visits and the relationships between the two. Previous studies have used similar techniques to identify seasonal migration, but have not reported in detail on the types of services used by migrators in each seasonal home. 4 –6
In addition to describing health care services use of migrators, this study explores the effect of having local primary care on the use of other health care services, with particular focus on whether local primary care reduces rates of primary care treatable (PCT) ED visits. The ED can be a difficult place to receive primary care, particularly for elderly people. Older people are more likely to have multiple morbidities, 7 more likely to be frail, 8 and more likely to use 5 or more prescriptions than younger people. 9 These differences make them more difficult to diagnose and treat appropriately in a setting such as the ED, where their health history may be less accessible and time in shorter supply than in a primary care setting. 10,11 Nevertheless, studies have found high proportions of non-severe (Kaskie et al 12 : 34% of visits) or PCT (Pukurdpol et al 13 : 30% of visits) ED visits among elderly people. Improving access to primary care could reduce the number of these visits by providing preventive care to avoid emergencies or by providing timely access to lower acuity care. 11,14 –18
Methods
Description of sample
Analysis was performed using the Medicare Limited Data Set 5% sample for the years 2011 and 2012. US resident, aged, FFS beneficiaries were included. The 24 months of claims data were summarized into 8 seasons: January to March (winter), April to June (spring), July to September (summer), and October to December (fall) for each year. Because the data are routinely collected, de-identified administrative claims, the study was deemed exempt from Institutional Review Board oversight.
There were 1,483,567 beneficiaries eligible for the analysis. Most received some medical care over the course of the time they were observed. However, 5.2% received no location-attributable care; that is, they had no medical claims from which to infer their location. In total, the study team observed the location of a beneficiary in 81.7% of the seasons in which they were eligible for the analysis.
Location information in claims data
Medicare data give one place of residence for each beneficiary per year: their stated location as of December. This information is available in the denominator file for every Medicare beneficiary, regardless of whether they use health care services. Other sources of location information for each beneficiary come from claims data. Each claim includes the county where the beneficiary said he/she lived at the time the claim was submitted. Organization (eg, hospital) and physician National Provider Identifier numbers were linked to the National Plan and Provider Enumeration System file to determine the zip code in which care was given. 19 The study team did not use claims for home health services, durable medical equipment, or laboratory tests to determine beneficiary locations because those providers could provide services to people far away.
Several indicators of care were summarized by season and geography. (To account for people living on the border of 2 geographies, any care received within 250 miles of their residence was allocated to their residence geography. In other words, a person living in Oregon but receiving care across the state line in California would be treated as resident in Oregon as long as the California care was provided within 250 miles of his/her Oregon residence.) These indicators included: the number of claim line items with that location listed as the beneficiary residence, the number of inpatient days, outpatient days, days receiving physician services, days receiving outpatient evaluation and management (E&M) services from a primary care physician, and days receiving outpatient E&M services from a specialist. The Medicare specialty codes used to define primary care visits were those associated with general practice, family medicine, internal medicine, geriatrics, nurse practitioner, clinical nurse specialist, and physician assistant. 20 All other physicians were considered specialists.
The distance from a beneficiary's county of residence (from the denominator file) to the county where care was provided was calculated. 21 For each season in which each beneficiary was eligible for the analysis, the care indicators were summarized according to how far the county of care was from the county of residence. Each beneficiary was assigned a location for each day on which care was received. People who had no claims information for an entire year were included in the analysis with their denominator file residence as a fall (October to December) observation because the denominator file residence is recorded as of December.
Each beneficiary was allowed to be in multiple geographies in a single season. Each beneficiary–season–geography observation was included in the analysis; for example, a beneficiary who received care in both Texas and Minnesota in winter 2011 would have 2 observations for winter 2011. Seasons in which a beneficiary received no care were not included in the analysis, except as noted for people with no care through the entire year.
Classification of beneficiaries' seasonal migration patterns
Locations of care and residence were classified by a state/region scheme. Bureau of Economic Analysis (BEA) regions 22 were used with 1 modification: the Far West BEA region was divided into northern (Alaska, Washington, Oregon) and southern (California, Hawaii, Nevada) Far West regions. States that are of particular interest for seasonal migration (eg, Arizona, New Jersey) were considered separately from the rest of their BEA region to provide more granular information on these areas. This state/region scheme yields 23 geographic entities that were compared in the analyses (Fig. 1).
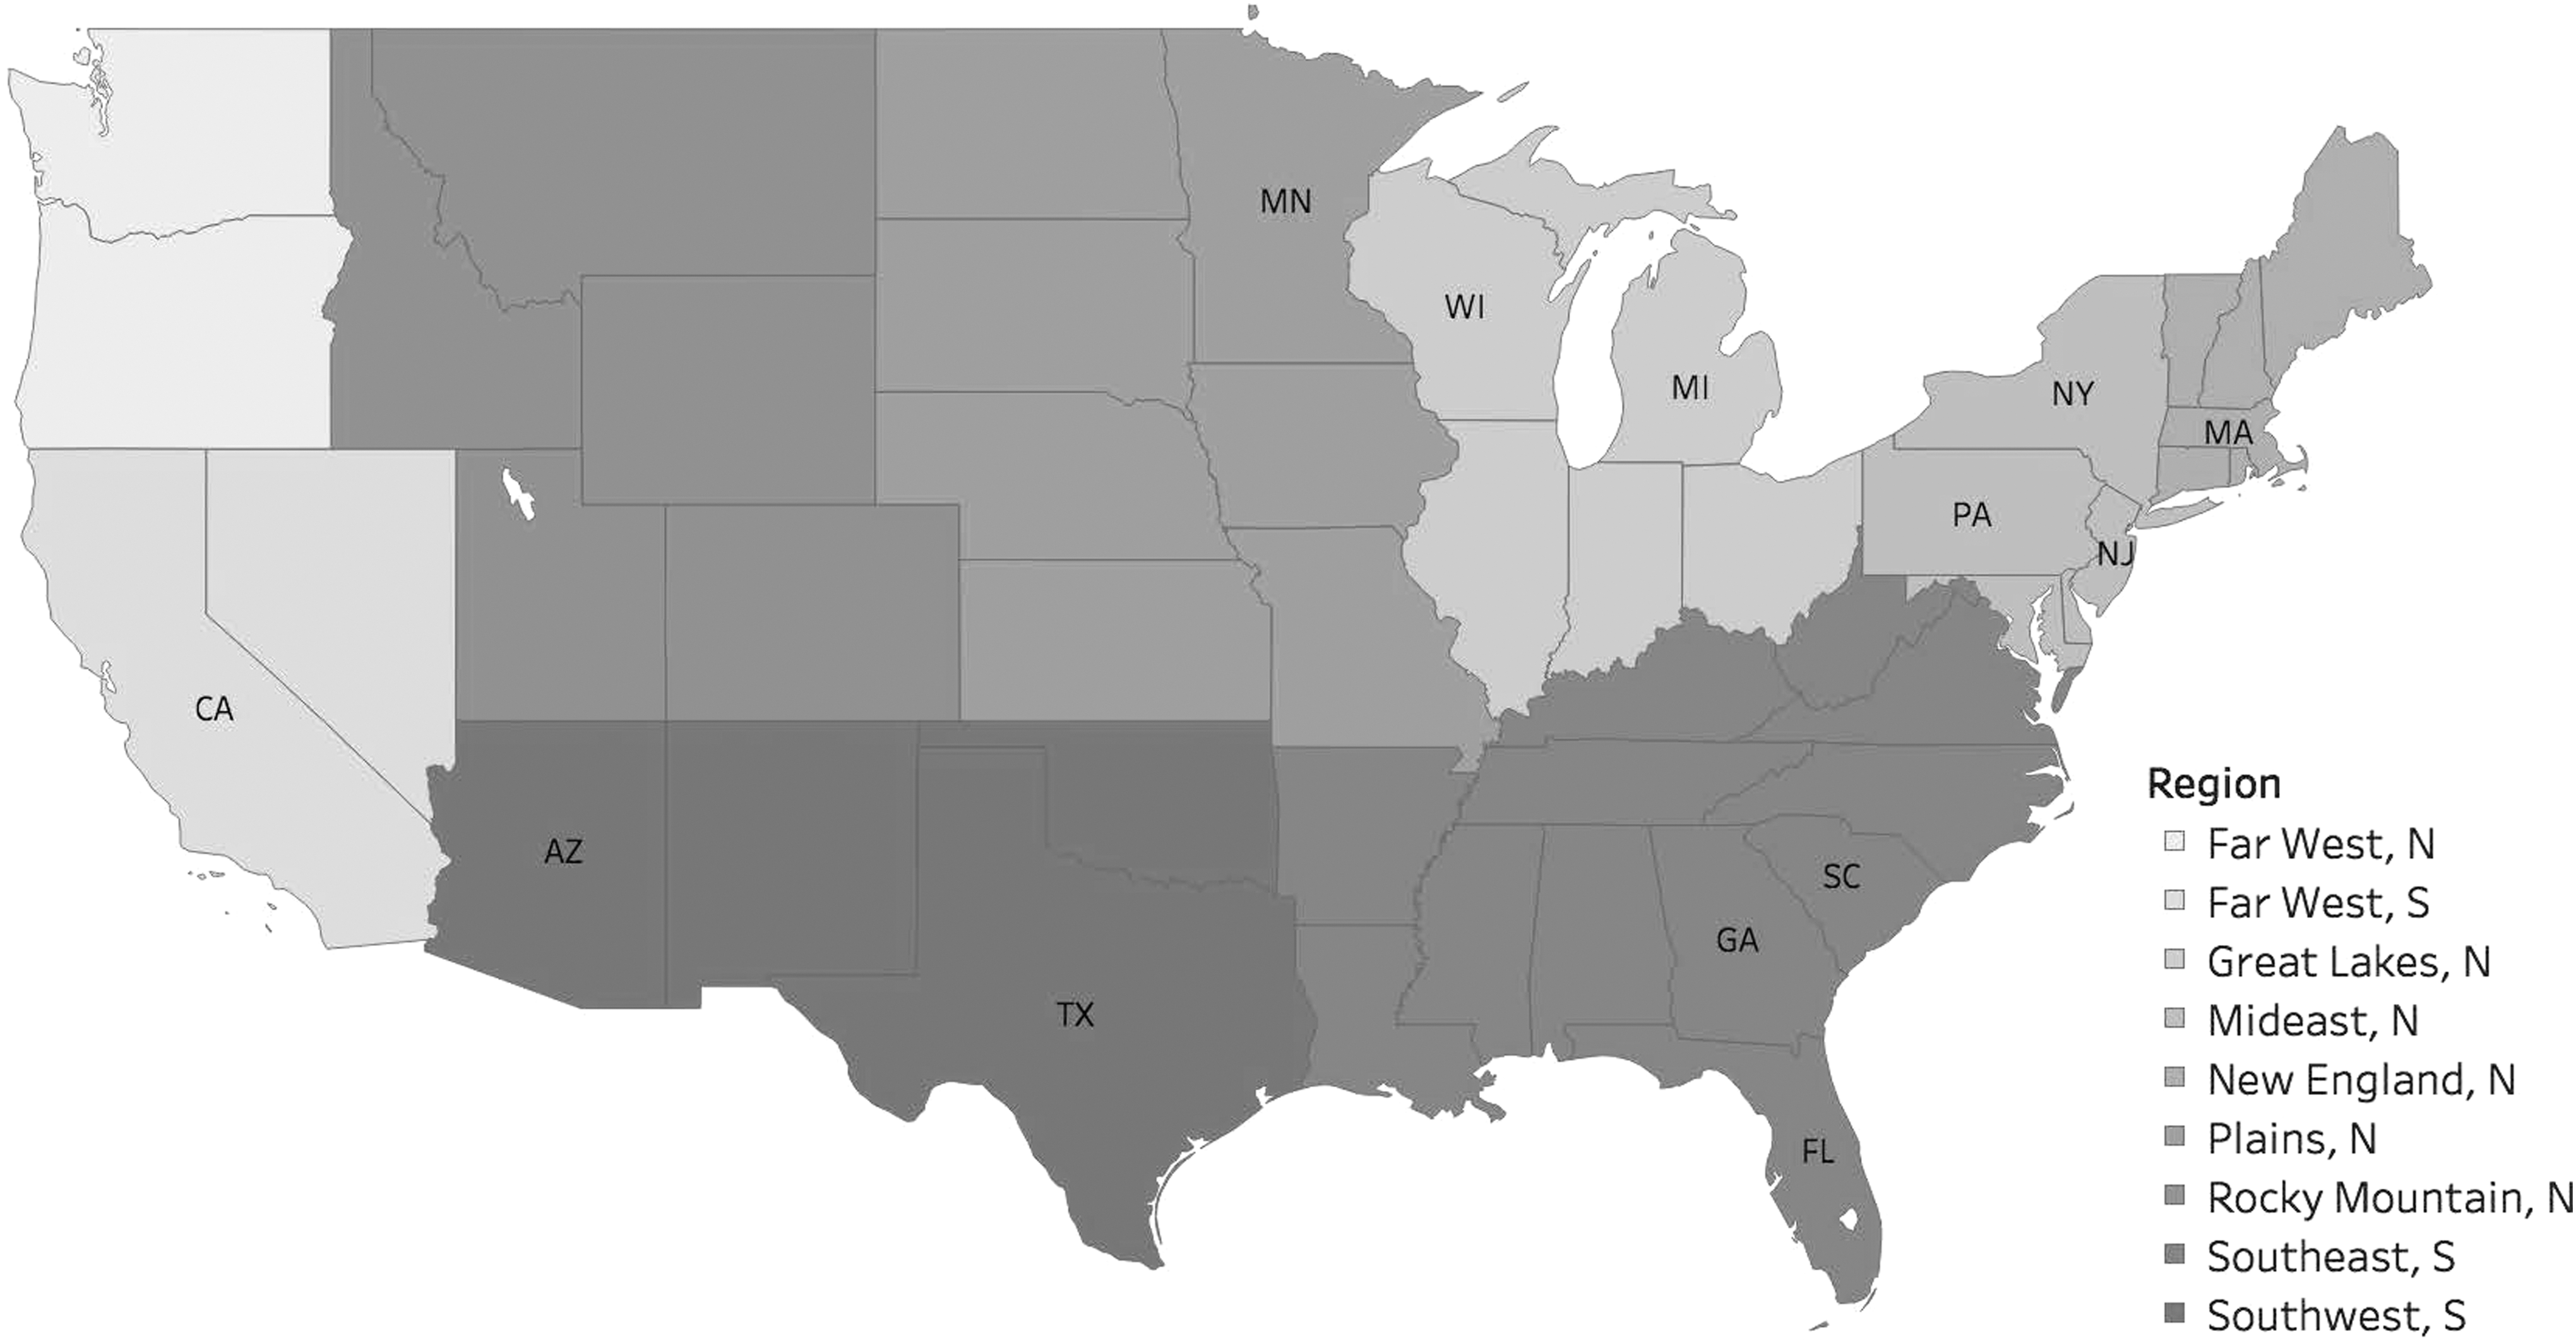
Geographic regions for analysis. Labeled states were included in the regression separately from the rest of their region. N, north; S, south.
People who were observed only in northern or southern geographies were classified as North only (47.7%) or South only (46.8%). People who received some winter or spring care in the south and some fall or summer care in the north were classified as snowbirds (4.1%). People who didn't fit any of the other patterns were classified as other (1.4%); this category also includes people who had no medical care, but changed their address from a northern location to a southern location (or vice versa) from 2011 to 2012.
The study team did not have a strong sense of the people in the “other” category. Most are reverse snowbirds – in essence, spending the hot season in the south and the cold seasons in the north. They may not be true migrators; instead, they may have (permanently) moved or received health care services while visiting another part of the country.
Measures
Four measures of health care use are explored: PCT ED visits as characterized by the Minnesota algorithm, 23 total ED visits, days of inpatient hospitalization, and visits with specialists. Each measure is summarized by beneficiary, location, and season.
Modeling
Population-averaged negative binomial regression was used to model the counts of health care services used by season and location for each eligible beneficiary. Beneficiary–seasons with no observed location information were not included in the analyses. That is, the study team did not impute any beneficiary locations during months in which beneficiaries did not receive care (with the exception described for people who received no care during an entire year).
Counts of health care services used are modeled by season and location for each beneficiary. Seasons each contain 3 months, but all beneficiaries are not observed in each of the 3 months. The study team does not know why beneficiaries are not observed in months during which there are no health care claims. It could be that they don't need any care, or it could be that no Medicare-reimbursable care is available to them during that period. For example, they could be in a different country. To consider all beneficiaries on an equal basis, the team normalizes seasonal counts of health care services to a rate of events per month observed (ie, per month with any services received). The functional form of negative binomial models allows this to be done by including the natural log of the number of months per season observed, with its coefficient constrained to 1. 24
The model was estimated using generalized estimating equations to account for correlation related to repeated observations on the same beneficiaries. 25 The Huber–White “sandwich” variance estimator was specified, as was an exchangeable working correlation matrix.
All models included main effects for migration category, having local primary care, location, beneficiary age, race (white vs. nonwhite), sex, Medicaid status (any months of state buy-in coverage), season, and a measure of comorbidities (quintiles of the Hierarchical Condition Category community score). Interaction terms crossing migration category by primary care status were included. Results are presented as incidence rate ratios per month receiving any health care. Predicted rates of PCT ED visits and total ED visits per month of health care receipt also are provided by migration category x primary care status groups to facilitate interpretation.
Results
Table 1 shows the characteristics of the various migration groups. Overall, snowbirds make up 4.11% of the population. The other migration category is much smaller. People living in the North only and in the South only make up nearly equal proportions of the remainder of the population.
Estimates not significantly different from each other at P = 0.01 (within row).
Percentage of aged fee-for-service Medicare beneficiaries.
Beneficiaries receiving any months of state buy-in coverage.
Percentage of beneficiaries receiving no location-attributable medical care during the entire time they were eligible for the analysis. Note that the definition of migration categories precludes any snowbirds with no medical care.
Percentage of total eligible beneficiary-seasons in which any location-attributable medical care was received.
Months of parts A and B coverage received as recorded in denominator file.
HCC, Hierarchical Condition Category; N, north; S, south; SD, standard deviation.
Proportions and means in Table 1 that are not significantly different at the P = 0.01 level are indicated. Large sample sizes result in some statistically significant difference that have little practical significance (eg, the proportion who are female in the North only and South only groups). However, some very clear differences are apparent. Snowbirds were more likely to be white and less likely to be on Medicaid than other migration categories. By design, all snowbirds had to have received some medical care, but they also have a larger proportion of seasons during which they received any medical care.
Both snowbirds and other migrators are more likely to have received any primary care. This difference persists when the sample is limited to beneficiaries with a full 24 months of eligibility for the analysis and when the sample is limited to beneficiaries who received any medical care over the course of the study (results not shown).
Table 2 gives unadjusted rates of health care service use per month of eligibility for inclusion in the analysis. These are the rates as observed, not adjusted for beneficiary characteristics (see Table 3 for adjusted estimates). Again, rates that are not different at P = 0.01 are indicated. When comparing these results, it is important to remember that migration categories are defined based on use of health care services and the location in which those services are received. In particular, people categorized as nonmigrators could differ in important, unobserved ways from people categorized as migrators; still, it is useful to describe their services use to provide information on geographic practice variability that could offer an alternative explanation for reductions in ED use associated with having local primary care.
Estimates not significantly different from each other at P = 0.01.
Confidence intervals for ratio estimates calculated using linearized standard errors.
CI, confidence interval; ED, emergency department; PCT, primary care treatable.
ED, emergency department; N, north; PC, primary care; ref, reference; S, south.
Both migratory groups had higher rates of ED visits and PCT ED visits than the nonmigratory groups. They also had more visits with specialist physicians.
Estimated incidence rate ratios from the population-averaged negative binomial regression models are presented in Table 3. (Full results are presented in Supplementary Data; Supplementary Data are available online at
However, the main effect for migration category doesn't tell the whole story. Having local primary care strongly reduced rates of both PCT ED visits and total ED visits for all migration categories, as shown in the main and interaction effects of the local primary care variable. To ease interpretation of these interactions, predicted rates of PCT and total ED visits per month of health care received are provided in Table 4. The study team provides a within-migration category percent reduction for the effect of having local primary care. The predicted rate of PCT ED visits for people in the North-only migration category who have local primary care is 0.012 PCT ED visits per month of health care received, while the predicted rate for the same people with no local primary care is 0.017 PCT ED visits per month of health care received—a 29% reduction associated with having received local primary care. For snowbirds, this effect is much larger: a 58% reduction in PCT ED visits associated with having received local primary care.
Marginal effect calculation uses migration categories as observed, varying only the local primary care variable.
CI, confidence interval; ED, emergency department.
The percentage reduction of local primary care on PCT ED visits associated with having local primary care is larger than the percent reduction for total ED visits for all migration categories. This may suggest that primary care is best at reducing ED visits for minor problems, but does not necessarily improve health enough to reduce more serious ED visits.
Discussion
This study identified 5.46% of the Medicare aged FFS population as seasonal migrators, with 4.11% of Medicare beneficiaries (75% of migrators) following the familiar snowbird pattern of spending warm months in the north and cold months in the south. There are no national estimates of prevalence of seasonal migration among elderly people to compare. 2,3 Smith and House 2 estimate 4.7% of the Florida population aged 55 and older are temporary residents, staying more than a month, but reporting that Florida is not their usual place of residence. However, this definition is sufficiently different from that used in the present study (by including those aged 55 to 64 and requiring that people say they don't “usually” live in Florida) that it is difficult to compare. Estimates in Hogan 26 based on a special 1980 Census question suggest that about 1.1% of people aged 65 and older were nonpermanent residents of either Arizona or Florida as of April first. However, this estimate is noted to be low, as many snowbirds would have returned to the north by April. Furthermore, the current group of people aged 65 and older is of a different generation than those aged 65 and older in 1980, and may have different patterns of seasonal migration.
Given these other estimates, the present study estimate of 4.11% may be a bit high, possibly including people who received health care while on vacation, rather than true temporary residents. One might consider that those snowbirds with primary care in both the north and south are almost certainly seasonal migrators (48.7% of snowbirds), giving a lower bound estimate of about 2% of the Medicare aged FFS population being true Snowbird seasonal migrators.
The estimated rates of health care service use by snowbirds are a new contribution to the literature on seasonal migration, as is the estimate of the association between having local primary care and rates of PCT ED visits. These data suggest that snowbird rates of PCT ED visits are reduced more than 50% when they have local primary care.
This finding underscores an important relationship between presence of a local primary care provider and beneficiary care-seeking decisions. In the context of snowbirds and other seasonal migrators, it indicates that providers and payment model administrators should work with beneficiaries to identify a local primary care provider in each seasonal location. In addition, it may be prudent to provide beneficiaries with the opportunity to select their primary local primary care provider (eg, their home provider) through the adoption of voluntary alignment in payment model attribution. Payment model administrators might strengthen the role and value of this selection by providing the home provider with the tools and information necessary to coordinate services and exchange information across a patient's multiple local primary care providers. This might entail directly surveying payment model beneficiaries to identify snowbirds and other migrators types. With this information in hand administrators and providers might institute specialized preseasonal move primary care transition visits with a beneficiary's multi-locality primary care team to facilitate a “warm handoff” and improved care coordination across the primary care provider team. These visits might be facilitated through telehealth services.
Efforts to promote care coordination across snowbirds' local providers might include an Alternative Payment Model centered on coordinated, dual primary care locations for the seasonal migrator population. Virtual physician groups created by geographically dispersed physicians may present an opportunity to structure specialized care networks for this population. As the Centers for Medicare & Medicaid Services moves forward with defining requirements for the virtual group, regulators should consider the potential for this adaptation. There is a need for careful evaluation and collection of evidence on the effectiveness of innovative model designs for this population.
Limitations
Some beneficiaries were poorly tracked by claims data because they rarely received health care. This group could include people who are very healthy, people who receive care through the Veterans Affairs system, and people who receive care that is not covered by Medicare (eg, some types of complementary medicine such as acupuncture). The study team categorized these people using the information available; their migration category is likely less accurate than that of beneficiaries for whom there were more observations in the claims data.
Because of data availability, people on Medicare Advantage plans were excluded, and they comprise a significant proportion of Medicare beneficiaries (25% in 2011). 27 As a result, this analysis doubtless misses many seasonal migrators who did not need medical care while away and may mislabel as migrators others who received medical care while on vacation. The study team performed a sensitivity analysis separately considering snowbirds who were observed to travel back and forth between the North and the South at least twice from those who were observed to travel back and forth less frequently. The main finding that ED visits and PCT ED visits are reduced by primary care access stands. Full results are available from the authors on request.
Despite limitations, in the absence of any other information about the health care service use of this population, this analysis should yield insight about the population the study team is able to track relatively well using claims. These findings may encourage further research to identify and understand elderly seasonal migrators. The size of this population is nontrivial; the sample represents more than 1.2 million snowbirds and merits consideration in refining national (and local) payment policies.
Conclusions
As physician groups, ACOs, and other new delivery models bear increased financial risk for the utilization and spending incurred by attributed beneficiaries, regardless of their location, they must consider the health care service use of seasonal migrators. These results suggest that having a local primary care physician is associated with significantly fewer PCT ED visits, as well as a smaller reduction in total ED visits. ACOs may want to consider programs that encourage their members to identify a local primary care provider in their temporary residence locations, as well as programs to coordinate care outside their geographic area.
Footnotes
Author Disclosure Statement
The authors declare that there are no conflicts of interest. The authors received the following financial support: This study was made possible by the Mayo Clinic Robert D. and Patricia E. Kern Center for the Science of Health Care Delivery and financial support from the Agency for Healthcare Research and Quality in the form of a National Research Service Award predoctoral training grant.
References
Supplementary Material
Please find the following supplemental material available below.
For Open Access articles published under a Creative Commons License, all supplemental material carries the same license as the article it is associated with.
For non-Open Access articles published, all supplemental material carries a non-exclusive license, and permission requests for re-use of supplemental material or any part of supplemental material shall be sent directly to the copyright owner as specified in the copyright notice associated with the article.