
Abstract
Colorectal cancer (CRC) causes more than 50,000 deaths each year in the United States but early detection through screening yields survival gains; those diagnosed with early stage disease have a 5-year survival greater than 90%, compared to 12% for those diagnosed with late stage disease. Using data from a large integrated health system, this study evaluates the cost-effectiveness of fecal immunochemical testing (FIT), a common CRC screening tool. A probabilistic decision–analytic model was used to examine the costs and outcomes of positive test results from a 1-FIT regimen compared with a 2-FIT regimen. The authors compared 5 diagnostic cutoffs of hemoglobin concentration for each test (for a total of 10 screening options). The principal outcome from the analysis was the cost per additional advanced neoplasia (AN) detected. The authors also estimated the number of cancers detected and life-years gained from detecting AN. The following costs were included: program management of the screening program, patient identification, FIT kits and their processing, and diagnostic colonoscopy following a positive FIT. Per-person costs ranged from $33 (1-FIT at 150ng/ml) to $92 (2-FIT at 50ng/ml) across screening options. Depending on willingness to pay, the 1-FIT 50 ng/ml and the 2-FIT 50 ng/ml are the dominant strategies with cost-effectiveness of $11,198 and $28,389, respectively, for an additional AN detected. The estimates of cancers avoided per 1000 screens ranged from 1.46 to 4.86, depending on the strategy and the assumptions of AN to cancer progression.
Introduction
C
CRC screening has been shown to be cost-effective at even modest levels of willingness to pay (WTP) for life-years gained (eg, $20,000), and to be cost saving in some cases. 3,4 The rising cost of medications to treat CRC increase the likelihood of cost saving through screening. 5 With the value of CRC screening now well established, further research on the method of CRC screening is warranted. Cost-effectiveness analysis provides a robust method to help decision makers choose between the several methods of CRC screening available.
A common method of CRC screening is fecal immunochemical testing (FIT). FIT has advantages over older fecal tests – namely better test performance (increased sensitivity) 6 and patient convenience (ie, lack of need for dietary restrictions, medication discontinuation). The detection of advanced neoplasia with FIT allows targeted application of colonoscopy toward patients at the highest risk for CRC. This matters because colonoscopy resources typically are limited and colonoscopy-based screening is much more expensive than FIT-based screening. However, there is residual uncertainty over whether CRC screening with FIT would be optimally effective with a single FIT kit per screening round, or with multiple FIT kits per round. 7,8 Additionally, the sensitivity of the most widely studied FIT (which is that used at this study site) can be increased further by lowering the cutoff of hemoglobin concentration for a positive test result. 9 It has been unknown what the trade-off in false positives and cost would be with a lower cutoff or with an additional FIT kit per screening round, if used in an average-risk screening population.
The decision to use a single FIT or multiple tests involves balancing improvements in test performance associated with multiple testing against its attendant decrease in patient adherence with screening and increased screening costs. This study used data from a large integrated health system in the United States, Kaiser Permanente Northwest, to evaluate the cost-effectiveness of CRC screening, with an outcome of advanced neoplasia detection.
Methods
The study team examined the costs and outcomes of a 1-FIT regimen compared with a 2-FIT regimen, at various diagnostic cutoffs of hemoglobin concentration for a positive test, for the detection of advanced neoplasia. Data from several sources were used to populate a probabilistic decision–analytic model, following best practice in economic evaluation. 10,11 The primary outcome from the analysis was the cost per additional advanced neoplasia detected among all patients overdue for CRC screening, mirroring the populations from the studies that were used to estimate inputs for the decision model. Costs and outcomes were not discounted in the primary analysis because of the short follow-up time (6 months). The study team also undertook a secondary analysis (to be described) that incorporated costs of cancer treatment and life-years gained. All analyses were performed from the perspective of the health insurer (payer), and focused on replication costs by removing costs related to the research environment (eg, extensive tracking, focus groups) that likely would not be used in practice. 12
Decision model
The model structure for a single hemoglobin concentration cutoff is shown in Figure 1; the model used contained identical structures for all 5 cutoffs. Thus, there are a total of 10 comparisons made in the analysis, namely 1-FIT and 2-FIT for each of the 5 cutoffs. Excel (Microsoft Corporation, Redmond, WA) was used for the decision modeling and Monte Carlo simulations (1000 iterations) were performed to generate probabilistic estimates. The study team calculated the incremental cost-effectiveness ratio (ICER) as (cost b − cost a )/(effect b − effect a ), where a and b represent the FIT strategies ranked by cost. An ICER reveals the added cost per additional unit of effect (benefit) for each strategy, compared to the next least costly strategy. But sometimes the added cost does not yield additional benefits. In that case the more costly strategy is said to be “dominated” by the less costly strategy. The team also displays cost-effectiveness information through the use of cost-effectiveness acceptability curves (Figure 2). Such a visual representation illustrates the optimal strategy for each level of a decision maker's WTP for an additional unit of benefit. The optimal strategy is the one that has the highest probability of being cost-effective at a given WTP.

Decision tree. AN, advanced neoplasia; CRC, colorectal cancer; FIT, fecal immunochemical test.
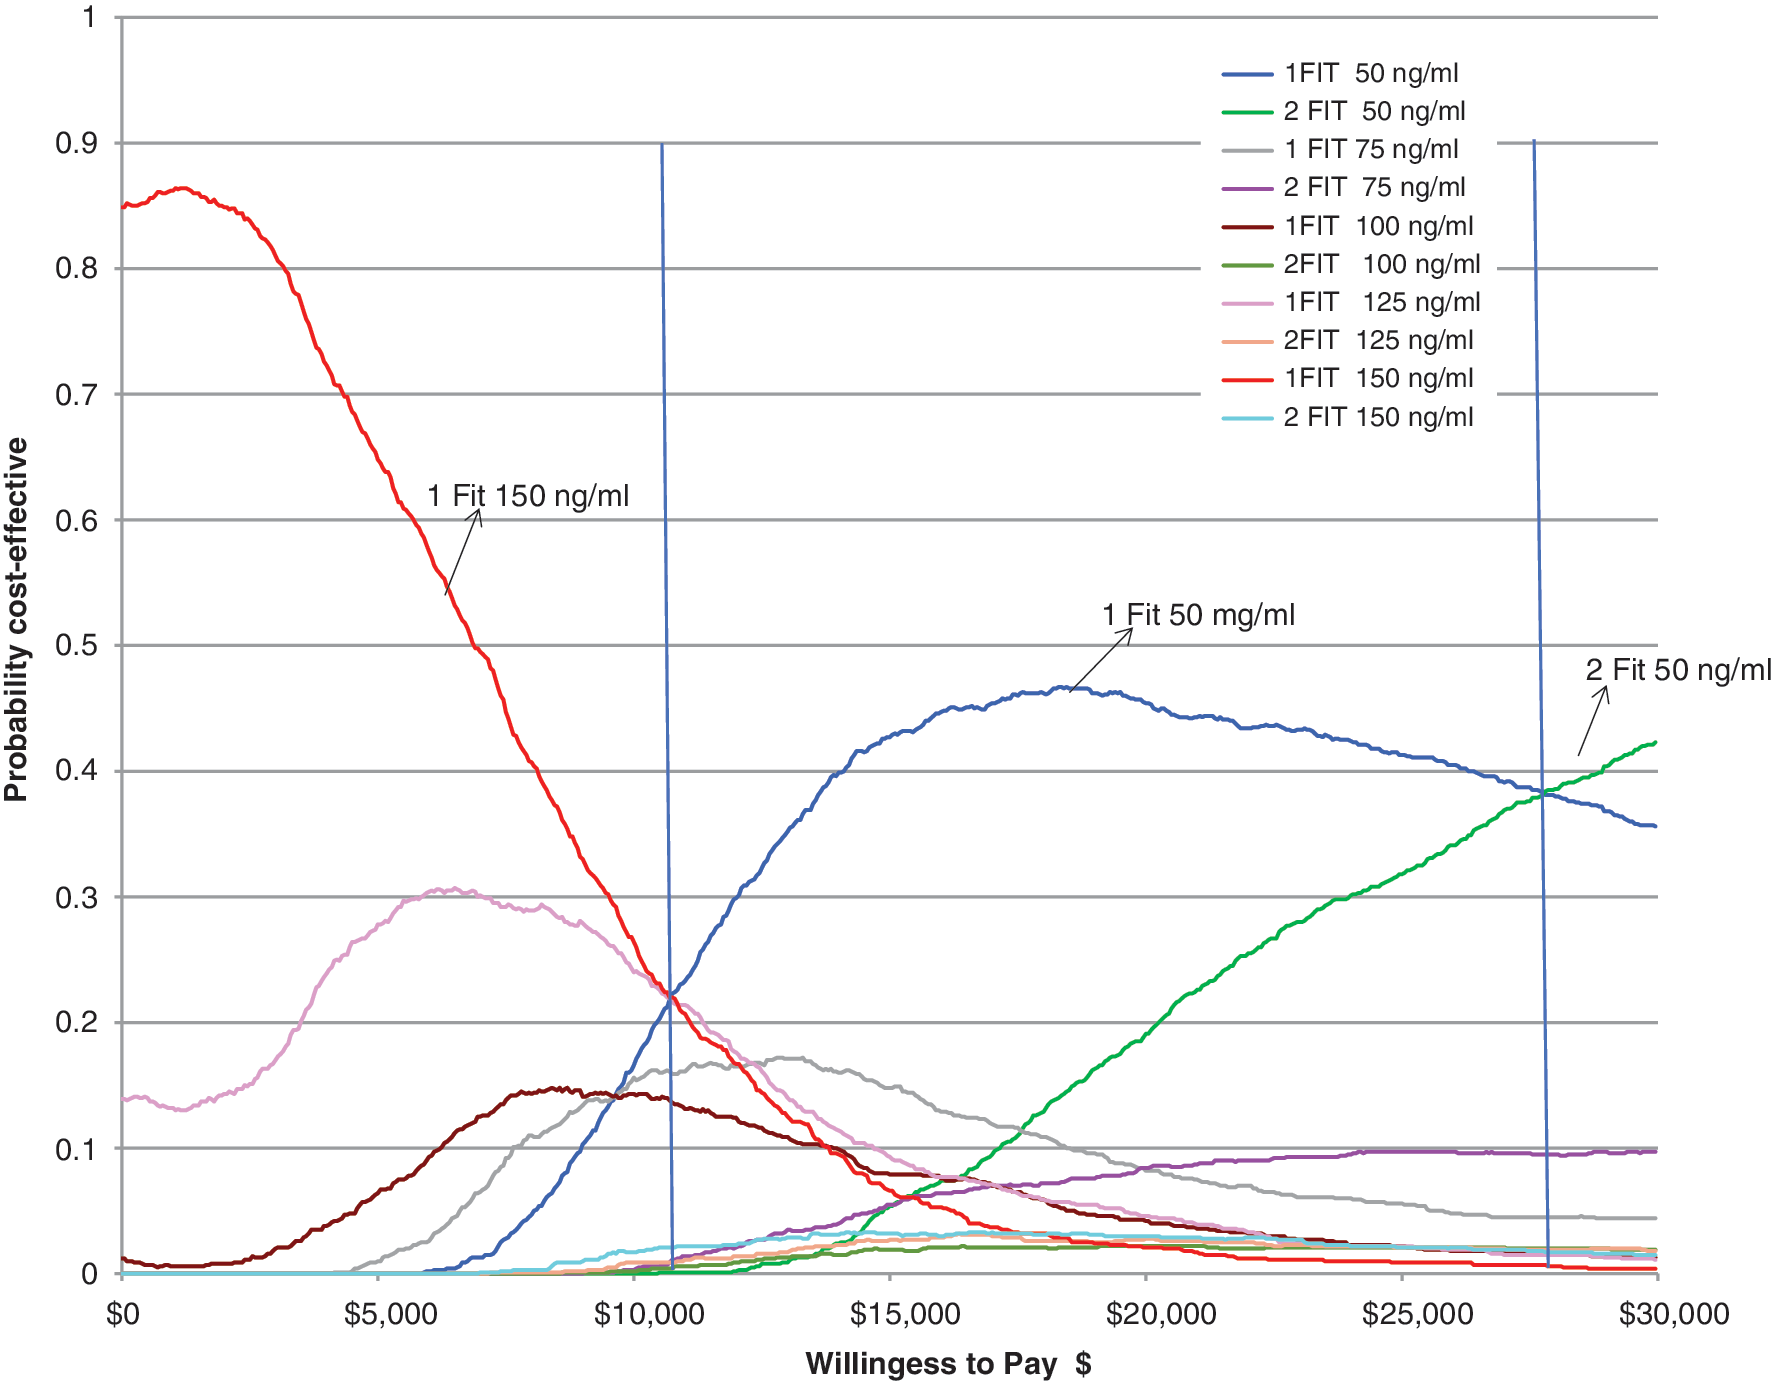
Cost-effectiveness acceptability curve. FIT, fecal immunochemical test.
The study team used studies related to CRC screening that were designed to support inputs for this economic model. These analyses, to be described, were performed at Kaiser Permanente Northwest (KPNW), an integrated, group model health maintenance organization serving more than 500,000 members, in the Portland, Oregon metropolitan area. This research was reviewed and approved by the KPNW Human Subjects committee.
Patient uptake, or adherence, is a key factor in assessing costs and outcomes from a 1-FIT regimen compared with 2-FIT. The study team used data from a previously published randomized trial from their group comparing adherence with 1-FIT screening to 2-FIT among 3,121 patients who were overdue for CRC screening. 13 In that study, randomized participants aged 50–75 years who were at average risk of CRC were mailed illustrated, English language instruction on how to sample feces from a bowel movement and how to complete the collection and return the sample by mail to a local laboratory. Participants in the 2-FIT group had the same instructions, but also were asked to sample from another bowel movement and to send both kits in 1 envelope. No dietary or medication restrictions were recommended. After 6 months of follow-up, that trial showed a completion rate of 43.3% for 1-FIT and 39.6% for 2-FIT. The investigators found no evidence of effect modification by age, sex, or prior CRC screening. Adherence with diagnostic colonoscopy also was estimated from those data by assessing the proportion of patients who completed their colonoscopy. The study team combined those data on adherence differential by number of FIT required with data on detection of advanced neoplasia.
Another key factor is the probability of advanced neoplasia detection with various cut points. For the probability of advanced neoplasia detection, the study team used data from a study 14 by their group that examined colonoscopy-verified detection of advanced neoplasia with FIT (OC-Micro, Polymedco, Cortland Manor, New York, USA), at 5 positivity cut points (50 ng/ml, 75 ng/ml, 100 ng/ml, 125 ng/ml, and 150 ng/ml). In that study, 2-FIT kits were mailed to patients who were scheduled to undergo a screening colonoscopy, after which their medical records were abstracted to determine the occurrence of advanced neoplasia with each of the cut points. These patients were similar in age and CRC risk to the randomized trial 13 participants whose data were used for the adherence parameters. For estimates related to a 1-FIT strategy, the laboratory value of first kit returned was used; for estimates related to a 2-FIT strategy, the FIT kit with the highest resulting value was used. The study team obtained data on the number of patients tested and those with a positive test at each cutoff and used this to inform the distributional assumptions (beta) and the probability estimates in the decision model (Table 1).
CRC, colorectal cancer; Cutpt, cut point; FIT, fecal immunochemical test.
Costs that were related to CRC screening were included (Table 1). These costs include program management of the screening program, patient identification, cost of the FIT kits and their processing, and diagnostic colonoscopy following a positive FIT. Costs of program management, patient management, and clinician follow-up were obtained from previous studies.
4
Costs for FIT kits and mailing were estimated from the randomized clinical trial. Costs of colonoscopy were estimated from healthplan, healthcare
Secondary analysis
As a secondary analysis, the study team undertook an estimation of the number of cancers detected, costs of cancer care, and life-years gained from detecting advanced neoplasia. The primary analysis is focused on all patients who were overdue for CRC screening. For simplicity of calculating life-years gained the team situated the secondary analysis among a specific subgroup (50-year-old white males) who were overdue for CRC screening. The estimates were based on Lin et al, 15 wherein a declining exponential function 16,17 was used to estimate life-years gained. The team used a 5% discount rate on costs and effects in the secondary analysis following guidance 18 recommendations.
Results
Probability of a positive FIT (Table 1) varied by cut point and number of FIT and ranged from.030 (1-FIT 150 ng/ml) to.12 (2-FIT 50 ng/ml). For each corresponding cut point the 2-FIT had a higher probability of a positive result than the 1-FIT. This was expected because tests from 2 different bowel movements were taken, thus allowing an increased chance of detecting potential abnormality. However, the opposite is true for the probability of a positive colonoscopy, where for each cut point the 1-FIT had a higher probability of leading to a colonoscopy with significant findings. Other than the costs for the FIT ($6.40) and FIT processing ($44) being twice as much for the 2-FIT protocol, the costs for screening were the same across the 1-FIT and 2-FIT protocols. Staff time for project management, patient tracking, the automated telephone call, and mailing were $2.94 per person. The colonoscopy cost of $1926.47 was weighted to include the cost of complications.
Per person costs ranged from $33 (1 FIT at 150ng/ml) to $92 (2 FIT at 50ng/ml) across the 10 screening options (Table 2). The 1-FIT 50 ng/ml and the 2-FIT 50 ng/ml are the dominant strategies with ICERS of $11,198 and $28,389, respectively for an advanced neoplasia detected. As can be seen in Figure 2, the cost-effectiveness acceptability curves show that for a WTP below $11,000 the 1-FIT 150 ng/ml has the highest probability of being cost-effective. However, between a WTP of $11,000 to around $28,000 the 1-FIT 50 ng/mg has the highest probability of being cost-effective. Above $28,000 the 2-FIT 50 ng/ml has the highest probability of being cost-effective. The other strategies have far lower probabilities of being optimal at those levels of WTP.
AN, advanced neoplasia; FIT, fecal immunochemical test; ICER, incremental cost-effectiveness ratio; Strikethrough, dominance; SD, strong dominance; WD, weak dominance.
Table 3 presents the secondary analysis showing cost avoided and years of life gained by preventing an advanced neoplasia from progressing to CRC for a cohort of 1000 fifty-year-old white males. Two scenarios are presented; following Lin et al, 15 the base case assumes 75% of advanced neoplasia detected progress to CRC, while in the sensitivity analysis only 50% of advanced neoplasia detected progress to CRC. For the secondary analysis base case the estimated cancers avoided per 1000 screened range from 2.2 (1-FIT 150 ng/ml) to 4.86 (2-FIT 50 ng/ml). This translates to a range of 18 to 39 discounted years of life gained or 26 to 58 non-discounted years of life gained respectively. With respect to cancer costs avoided per 1000 screened for these same cut points, one sees a range of $189,734 to $420,073 discounted or $256,541 to $567,984 non-discounted costs. If a 50% advancement to advanced neoplasia is assumed for the same cut points, the cancers avoided per thousand screened drop to between 1.46 and 3.24, with discounted life years gained ranging from 12–26 (undiscounted life years gained range from 17–39). Discounted cancer costs avoided for this scenario range from $126,489 to $280,049 (undiscounted costs range from $171,027–$378,656). For this cohort, each of the 10 options is expected to yield lifetime cancer costs avoided that far outweigh the costs of the 1-time screening program.
Discount rate = 5%.
AN, advanced neoplasia; CRC, colorectal cancer; FIT, fecal immunochemical test.
Discussion
This study found per-person costs ranged from $33 (1-FIT at 150ng/ml) to $92 (2-FIT at 50ng/ml) across the 10 screening options.
Using a strategy of 1-FIT 150ng/ml as the base comparison (because it is the least costly), this study found that all options except 1-FIT 50ng/ml and 2-FIT 50 ng/ml are dominated. These 2 options have an incremental cost-effectiveness ratio per additional advanced neoplasia detected of $11,000 and $28,000. The cost-effectiveness acceptability curve illustrates the cost-effectiveness acceptability “frontier.” It shows that the base comparison of 1-FIT 150ng/ml is most likely to be cost-effective over a wide range of WTP for an additional advanced neoplasia detected, from $0 to ∼$11,000, at which point the 1-FIT 50ng/ml becomes optimal; then at a WTP of about $28,000 the 2-FIT 50ng/ml becomes optimal. Note, however, that there is considerable uncertainty in these results; after a WTP of ∼$5000, none of the options has a probability of being cost-effective of >50%.
Using a metric that is constant across strategies, such as the cost per advanced neoplasia detected, allows the study team to estimate value between strategies (ie, different cutoffs and numbers of tests). But a problematic aspect of evaluating the cost per advanced neoplasia detected is the lack of a known standard WTP. Because of that, the team also estimated cancers avoided and subsequent life-years gained. The estimates of cancers avoided per 1000 screens ranged from 1.46 to 4.86, depending on the strategy and the assumptions of advanced neoplasia to cancer progression. The study team found that, for a cohort of 1000 fifty-year-old men, years of life gained expectation ranged from 18 years for 1-FIT at 150 ng/ml to 39 years for 2-FIT at 50ng/ml. For that cohort, each of the 10 options was expected to yield lifetime cancer costs avoided that far outweigh the costs of the 1-time screening program.
These findings broadly agree with previous studies. For example, Goede et al 8 and Sobhani et al 19 investigated the costs and outcomes associated with CRC screening using FIT at varying cutoff values. Similar to the present study, they found that the lower cutoff values always yield increased life-year gains. However, they estimated longer term cost per life-year gained up to $9,500, while the present study found that all screening options are potentially cost saving. Differences in design and geography between the studies may have been responsible for variation in findings; they evaluated multiyear strategies and used costs from the Dutch and French health care systems. Yamamoto and Nakama 20,21 reported cost and outcomes of 1, 2, and 3 FIT sample testing strategies, and recommended the 2-sample strategy based on average cost per case detected. Those results are difficult to compare with those of the present study because they did not conduct an incremental cost-effectiveness analysis and did not vary the positivity cut point.
This study has some limitations. The study team used parameter estimates and costs in the modeling that are most relevant to an integrated care arrangement, so they may be less applicable to other settings (eg, fee for service), particularly settings that do not undertake population health management.
This study has several strengths. The decision model's parameter estimates come from studies conducted by the study team's group. All patients enrolled in those studies were selected using identical criteria that also match screening recommendations. 6 Although these patients are representative of KPNW's membership characteristics and may not translate to all subgroups, they are internally consistent. The study team used cost estimates that are relevant to the United States, and analyzed value-for-money in the context of a 1-time screen. The team chose to evaluate a 1-time screen because few studies have evaluated such a strategy in spite of its relevance to the US system of care. Although current recommendations for screening with FIT involve multiple screening invitations over several years, focusing on a 1-time strategy can yield insights that are not possible with decision modeling of multiple screening intervals. For example, the fractured state of the US health care system and the inevitable “churn” in membership means that patients often are not still members in subsequent years of potential screening. The study team does recognize the societal value of assessing repeat screening over multiple years, but feels that the present evaluation adds valuable information to the topic and reinforces the notion that the best screening strategy is the “one that gets done.” 22
Footnotes
Author Disclosure Statement
The authors declare that there are no conflicts of interest. The authors received the following financial support: a grant from National Cancer Institute of the National Institutes of Health (#R01CA154982-04).