




Abstract
This project was undertaken to reduce unneeded variation among practicing primary care clinicians participating in an accountable care organization (ACO) and to raise quality and reduce costs. This real-world, quasi-controlled experiment compared ACO target improvements between 3 participating geographic regions and members within the ProHealth ACO against nonparticipating regions and members. The authors used a novel care standardization initiative to engage participating providers. This was a 2-year longitudinal study with 6 rounds of serially measured provider care decisions and customized individual and group improvement feedback. Participating providers cared for online patient simulations as they would actual patients, and their care decisions were scored against evidence-based guidelines. This approach generated significant increases in evidence-based quality scores (+27%) and reductions in unneeded testing (-55%) in the patient simulations. Improvements in the online simulated patients correlated with improvements in patient-level ACO quality measures, which showed gains above and beyond the quasi-control group. Reductions calculated for spending on unneeded tests and specialist referrals exceeded $4.8 million. This study found that supporting practicing physicians in ACOs with evidence-based feedback significantly improved care and cost-efficiency.
Introduction
In 2016, health care expenditures in the United States totaled $3.3 trillion, and by 2025 health care spending is expected to consume far more of the gross domestic product than in comparable high-income nations. 1 –3 Despite greater spending, overall results do not reflect better quality of care, access, or health outcomes. 4 Although no single cause for this higher spending exists, one leading driver has been the relationship wherein providers are reimbursed for nearly all health care products and services, regardless of value or outcomes. 5 In these arrangements, providers can find themselves in conflicted relationships when efforts to reduce unneeded utilization of health care goods and services leads to lower provider compensation. Furthermore, because fee-for-service payments are not tied to specific outcomes or quality measures, there is less economic incentive for providers to invest in quality improvement initiatives. 6
Recognizing these misaligned incentives, payers and providers are experimenting with alternative payment models that tie reimbursement to quality performance and provide incentives for appropriately judicious use of services. 7 Accountable care organizations (ACOs) have emerged as one of the most common alternative payment models and are frequently primary care based. 8 Succeeding in an ACO specifically, and in a value-based payment world more generally, requires meaningful engagement of frontline physicians and other providers. 9 However, effectively engaging and standardizing clinical practice has proven elusive. 10,11 Published guidelines, for example, often evokes small, slow changes, as shown by the modest impact of the well-publicized Choosing Wisely campaign. 12 Similarly, pay-for-performance programs reveal inconsistent impacts on processes of care and health outcomes. 13 In addition, experience levels do not appear to drive better care, with evidence showing that more years in practice does not improve performance on quality measures. 14
It is estimated that physician decisions account for 80% of all health care spending. 15 To be successful, ACOs must do many things well, including align payer and provider incentives, engage patients in their care decisions, and share timely performance data. 16 Across all these efforts, collaboratively engaging providers to ensure consistent, high-quality care is essential.
Primary care providers (PCPs) make many key management decisions ranging from test ordering and specialist referrals to providing preventive and chronic disease care. Multiple studies have confirmed wide variation in clinical practice among PCPs, between urban and rural practices, 17 across regions, 18 and even among providers within a single health care system. 19 Thus, standardizing care within an ACO and reducing unwarranted variation has the potential to drive success through delivery of higher quality, more cost-effective care.
This paper describes the results of a novel physician engagement and care standardization approach designed to help PCPs succeed in an ACO. The explicit project goals were to improve adherence to evidence-based practice guidelines and lower costs. Herein the research team reported the results of this engagement for 2 high-volume, high-cost diseases of strategic importance to most ACOs–heart failure (HF) and diabetes–and documented improvements in clinical decision making among PCPs and advanced practice providers (APPs).
Methods
Setting
ProHealth Physicians is the largest physician group in Connecticut, caring for more than 10% of the state's population (360,000 people). ProHealth has earned multiple certifications, including National Committee for Quality Assurance Patient-Centered Medical Home recognition, and has more than 350 providers and 80 practice locations, which are grouped into 11 geographic clusters across the state. ProHealth has multiple commercial ACO contracts including more than 100,000 covered lives and has been a Medicare Shared Savings Program ACO since 2013.
In 2014, ProHealth partnered with Aetna Accountable Care Solutions (Aetna) and QURE Healthcare to identify unwanted physician variation and improve ACO performance across the organization, and launched the ProHealth-QURE Quality Demonstration (PQQD) study. Midway through the project, in December 2015, Optum purchased the administrative support services of ProHealth and carried on with the project, still under the aegis of Aetna.
Participants
PQQD ran from March 2015 to December 2016 and included PCPs and APPs (physician assistants and nurse practitioners) in 3 of ProHealth's geographic clusters. ProHealth leadership invited providers in these clusters, which account for about 25% of ProHealth's adult PCPs, to participate. Providers received continuing medical education and maintenance of certification points for their participation. Sixty-seven PCPs and APPs from these participating clusters were eligible for voluntary participation and 37 completed at least 4 rounds of cases and feedback.
Data
Project data drew from 3 sources: (1) clinical decisions made by each provider in the Clinical Performance and Value (CPV®) patient simulations, which were collected every 4 months, (2) patient-level quality performance data from ProHealth's Clinical Performance Reporting and Utilization (CPRU) group, and (3) national diagnostic testing cost data from the Centers for Medicare & Medicaid Services (CMS).
CPV data
CPV simulations are web-based, open-ended, interactive case vignettes, which providers care for as they would actual patients. QURE designed a set of 12 CPV patients presenting with HF or diabetes to be cared for in the primary care setting. These conditions represent a high volume of ProHealth ACO patients, a high proportion of total ACO costs, and a significant opportunity for care improvement. The study team designed the CPV simulations to explicitly measure adherence to evidence-based practice guidelines and ProHealth's ACO quality measures. ProHealth chose providers to review all cases and agree upon the case scoring criteria. The team updated both the cases and the scoring criteria as relevant new guidelines were released.
In the simulations, providers progress through 5 specific care domains: (1) take a history, (2) conduct a physical examination, (3) order a diagnostic workup, (4) make a specific diagnosis, and (5) delineate a treatment plan with follow-up. The platform provides real-time responses to open-ended questions (eg, “What laboratory tests would you order?”) after provider input. Each CPV takes approximately 20–30 minutes to complete, simulating a patient visit. The study team has validated that decisions made in the CPV environment are consistent with actual clinical decisions and are proven to measure a provider's ability to evaluate, diagnose, and treat a wide range of diseases and conditions 20,21 ; importantly, other studies have shown that improvement in CPV care translates into improvements in the care of actual patients 22,23 and that these effects persist for 5 years. 23
The project included 6 rounds of measurement and feedback, held every 4 months. In each round of the project, participating ProHealth providers cared for 2 randomly-assigned cases. After completing the CPV cases, trained physician scorers, blinded to the CPV-taker's identity, scored each vignette against the agreed upon evidence-based criteria. Providers received points for responses that matched the explicit criteria, with domain and overall quality scores reported as a percentage of correct items. In the workup domain, points also were subtracted for unnecessary or wasteful testing.
After all cases in each round were scored, feedback was given to providers. Feedback focused on specific items relevant to the workup, diagnosis, and treatment of patients with HF or diabetes and was delivered in 2 ways. First, QURE's online platform generated custom reports for each provider and each case, detailing the following: overall quality score, benchmarked peer performance, specific feedback on quality improvement opportunities, relevant guideline references and a detailed list, with costs, of unnecessary tests ordered. Second, QURE hosted facilitated discussions, in person or via webcast, with participants to review the top 6 to 8 areas of clinical divergence in the results. Areas addressed in these sessions were high-priority areas for patients, providers, and payers such as indications for a cardiology referral, underutilization of immunizations, and appropriate use of beta-blockers. These 45- to 60-minute discussions focused on reaching agreement on the best way to care for patients based on the latest guidelines and the local context.
ACO patient data
Patient-level data came from the CPRU group, responsible for measuring and monitoring physician adherence to ACO targets and developing performance scorecards at ProHealth. Each measure was defined using Healthcare Effectiveness Data and Information Set specifications—or CMS specifications when available—to create the numerator and denominator. CPRU's ProHealth Quality Management database was used to determine which patients met inclusion criteria and received the recommended care in actual practice. Performance was reported at the physician, practice, and region level. Patient-level data were secured before and after the 6 rounds of CPV administration. Baseline data were collected from January to December 2014 (or January to December 2015, when 2014 baseline data were not available), and follow-up data were extracted from January to December 2016.
Economic data
Cost data for laboratory tests, imaging, and procedures came from CMS' Physician Fee Schedule using the midpoint value for each item, calculated as the median value derived from 56 regional fee schedules. 24 –26
Quasi-experimental design
The study team recognized that the clusters not invited to participate in the project represented an opportunity to conduct a quasi-experimental study. A pre/post analysis was used to compare patient-level ACO quality data of CPV-participating providers to that of providers at nonparticipating sites. The pre/post analysis between the 2 groups controlled for any unobserved secular effects that affected quality, such as other quality initiatives under way across ProHealth.
Analyses
Three main outcomes were analyzed to determine the experimental impact of CPV measurement and feedback on performance: (1) improvement in overall and domain CPV scores over time, (2) difference-in-difference changes in ACO patient-level data that corresponded to the CPV diabetes and HF cases, and (3) the economic impact of improvements in clinical decision making. Statistical analyses, including variance tests and univariate regressions, were performed using Stata 14.2 (StataCorp LLC, College Station, TX).
Results
Baseline participant characteristics
The baseline characteristics of all round 1 providers demonstrated an average age of 49.6 years and an average 18.8 years of experience (Table 1). At the outset, 98% percent of providers self-rated their quality of care at project start as good or excellent, and less than 10% reported high variability in practice at ProHealth (Table 1).
Baseline Provider/Practice Characteristics of Participants
APP, advanced practice provider; DM, diabetes mellitus; HF, heart failure; QI, quality improvement; SD, standard deviation.
At baseline, the overall CPV quality scores in Round 1 averaged 58.0% with a standard deviation of 11.9%. By clinical domain, the scores were highest in history taking and physical exam and lowest, with the highest amount of variability, in diagnostic workup (Table 2). At baseline, the research team found that APPs (+0.2% difference) performed similarly to physicians (P = 0.934), women (+2.0% difference) performed about the same as men (P = 0.351), and those with >15 years of practice experience (+2.7% difference) scored similarly to those with fewer years (P = 0.187).
Average Overall and Domain Clinical Performance and Value Scores Across All Rounds
P value compares Round 1 vs. Round 6.
Participants who completed the PQQD were compared to those who did not and no significant baseline difference was found in overall CPV scores (58.5% versus 57.5%), making the correct primary diagnosis (71.6% versus 74.6%), or ordering unnecessary diagnostic tests (2.1 tests versus 1.9 tests per case) (all P > 0.05). However, providers were more likely to complete all rounds of the study if they saw more patients (P = 0.011), were a PCP instead of an APP (P = 0.002), or spent <15% of their time teaching (P = 0.003). Otherwise, no provider characteristic or CPV score was detected that predicted whether or not a participant completed the study. Thus, all subsequent analyses are performed only with PQQD providers who completed all 6 rounds.
CPV improvements
From round 1 to 6, overall scores increased by more than 15 percentage points (P < 0.001) (Table 2). Over the course of the project, the interquartile range improved from 54.8%–71.4% in round 1 to 68.3%–83.5% in round 6. This means the 25th percentile performers in the sixth round of PQQD scored nearly the same as the 75th percentile in the first round. This improvement was seen in every domain (P < 0.05), producing the largest improvements in diagnostic workup (+22.0 points; P = 0.012), diagnosis (+17.2 points; P < 0.001), and treatment (+15.4 points; P < 0.001) (Table 2).
Delving specifically into primary and secondary diagnosis rates, at baseline the research team found that providers identified the correct primary and secondary diagnoses 73% and 64% of the time, respectively (Supplementary Fig. S1). Through subsequent rounds of measurement and feedback, a significant upward trend in correct diagnoses was seen, ultimately reaching 86% accurate primary diagnosis (P = 0.047) and 76% correct secondary diagnosis (P = 0.038). Although all subgroups improved their primary diagnosis accuracy, a notable increase was seen among those with >15 years of practice experience, who saw a 24% increase from 68% baseline scores (P = 0.005), and men, who improved their diagnostic accuracy by 17% over the course of the project (P = 0.019), to bring their initial lower score equal to female providers by study's end.
To evaluate changes in variation, standard deviation in overall CPV scores was compared between baseline and final rounds, which showed a statistically significant decrease from 11.9% to 9.7% (P = 0.036). Similarly, in the diagnostic workup domain, variation in scores decreased significantly from 66.0% to 33.1% (P < 0.001), mainly because of a reduction in unnecessary tests. Although variation also decreased in the diagnosis and treatment domains, these did not achieve significance (P = 0.207 and P = 0.330, respectively).
Did CPV improvement translate into patient-level improvement?
Improvements in CPV scores were found to match improvements in many patient-level quality measures. Appropriate use of angiotensin-converting enzyme inhibitor (ACE)/angiotensin receptor blocker for patients with coronary artery disease and diabetes increased by 5% in the CPV cases and 9% in the patient-level quality measures (Table 3). In addition, CPV improvements in beta-blocker use for HF, aspirin in ischemic vascular disease, and low-density lipoprotein cholesterol (LDL) testing for cardiovascular disease all tracked closely with patient-level improvements. In diabetes care, improvements in A1c testing in the CPVs tracked closely with patient-level improvements, although diabetic eye exams did not. CPV improvements in preventive measures also tracked directionally with patient-level improvements, including pneumococcal vaccinations (38% versus 19%) and breast cancer screening (22% versus 45%) (Table 3).
Changes in Clinical Performance and Value Compared to Patient-Level Data from Baseline, with Regression Results and P Values
Baseline data from 2015.
ACE, angiotensin-converting enzyme; ACO, accountable care organization; ARB, angiotensin receptor blocker; CAD, coronary artery disease; CHF, congestive heart failure; CPV, clinical performance and value; CVD, cardiovascular disease; IVD, ischemic vascular disease; LDL, low-density lipoprotein; LVSD, left ventricular systolic dysfunction.
Univariate logistic regression was used to measure whether improvements in CPV scores were linked to improvements in ACO metrics (Supplementary Table S1). Results revealed that the greater the increase in CPV scores, the greater the improvement in ACO patient-level quality metrics. From a provider/ProHealth perspective, full participation in CPV measurement and feedback correlated with significant improvements in 9 measures. Indeed, for every 5% improvement in overall CPV scores, a provider was 6% to 108% more likely to meet any of the given ACO targets, with the only exception being beta-blocker orders for HF (P > 0.05).
Quasi-experimental findings
Patient data from PQQD providers who participated in all 6 rounds of the project were compared to patient data of quasi-control ProHealth providers who were not invited to participate. At baseline, no statistically significant difference between participants and nonparticipants existed (P > 0.05 for all measures). After 6 rounds, a difference-in-difference analysis of all measures showed that providers participating in the CPV program had a statistically significant net improvement compared to nonparticipants (P < 0.001). Specifically, for 6 of the 10 quality measures, PQQD participants saw patient-level improvements above and beyond nonparticipants (Table 4), achieving statistical significance for 4 measures (P < 0.05). Only counseling on stopping smoking showed a small negative correlation (-1%) between CPV participants and nonparticipants, and this was statistically significant (P < 0.001).
Difference-in-Difference Between Participants and Nonparticipants on Accountalbe Care Organization Tracked Measures
Baseline year 2014, unless otherwise noted.
Baseline year 2015.
P ≤ 0.05.
ACE, angiotensin-converting enzyme; ACO, accountable care organization; ARB, angiotensin receptor blocker; CAD, coronary artery disease; CHF, congestive heart failure; CVD, cardiovascular disease; IVD, ischemic vascular disease; LDL, low-density lipoprotein; LVSD, left ventricular systolic dysfunction.
Estimation of cost savings
To calculate the economic benefits of higher quality and more standardized practice, changes were measured in 2 CPV performance areas: unnecessary testing and specialist referrals.
At baseline, providers ordered an average of 2.0 unnecessary tests per CPV case (95% C.I. 1.7–2.3), accounting for an estimated $455 in spending (95% C.I. $328-$582) (Fig. 1). After 6 rounds, providers were ordering fewer than 1 unnecessary test per CPV case (95% C.I. 0.7–1.2, P < 0.001) with a corresponding 70% reduction in spending (Fig. 1). These providers report seeing an average of 6.8 new patients per week (from Table 1). A cost reduction of $315 (= $455–$140) for each new patient over the course of a year translates into savings of $111,384 per provider or $3,564,288 for the 32 providers completing all rounds.
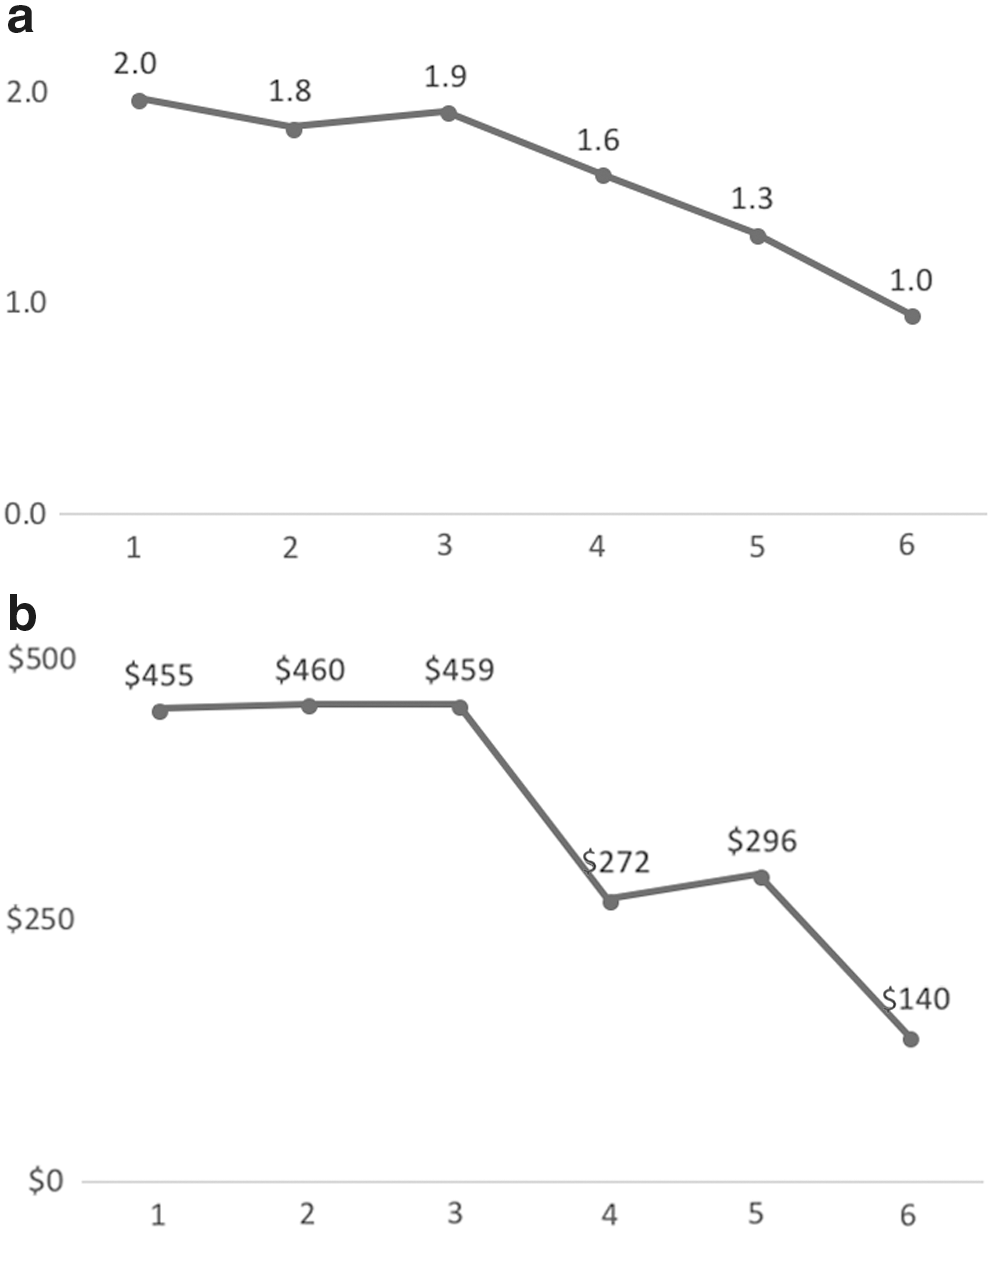
Number of unnecessary tests and unnecessary costs by round.
More specifically, unnecessary testing for ischemic heart disease was virtually eliminated after serial measurement and feedback (Supplementary Fig. S2). For patients with intermediate ischemic heart disease risk, HF symptoms, tolerance to exercise, and no resting abnormalities on electrocardiogram, the most cost-effective evidence-based workup is to order (1) a 2D echocardiogram and treadmill stress test or (2) a stress echocardiogram. In the first round of the project, only 38% of providers ordered a cost-effective workup for CPV patients presenting with these symptoms, while 42% ordered unneeded tests, most commonly a nuclear scan. Average Medicare reimbursement rates for the cost-effective options are about $650, while a nuclear scan costs about $1234. After 6 rounds of PQQD, providers ordering the cost-effective solution had risen to 69% while those ordering a wasteful solution had dropped to 8% (P = 0.006). Estimating 1 HF patient needing a cost-effective workup per provider per week, the 34% ( = 42%–8%) drop in wasteful workups translates to $330,404 in avoided spending across the 32 providers.
The study team also examined unnecessary cardiology and endocrinology referral rates for HF and diabetes, respectively. The set of CPV cases that ProHealth primary care leadership and cardiology partners designed did not require cardiology or endocrinology referral. In the first round, providers referred these HF patients to cardiology 70% of the time (Supplementary Fig. S3). By the sixth round, unnecessary referrals dropped to just 9% of cases (P < 0.001). Assuming (conservatively) that each provider makes 2 unnecessary cardiology referrals per month (1.2% of a 2000-patient panel), reducing unnecessary cardiology referrals by 61% ( = 70%–9%) would result in 15 avoided referrals annually. The estimated cost per cardiology referral is $2630 (including consultations and diagnostic studies), resulting in an annual savings of $1,262,400 across the 32 providers. The unneeded endocrinology referral rate, already low at 15%, dropped to 9% but this difference was not significant (P = 0.307).
PQQD participant satisfaction
At the conclusion of the study, all participants were invited to complete a survey to gauge the perceived usefulness and effectiveness of program (Supplementary Table S2). Response rate was 69%. On a 5-point Likert scale across multiple dimensions, participants' responses reflected a high degree of satisfaction with the program. On the dimensions of “Relevance to practice” and “Educational content,” providers rated the project 4.6 and 4.3, respectively. Similarly, providers rated the “Overall quality of material” 4.4. Participants found the custom individual feedback reports very helpful (mean = 4.4) but were less enthusiastic about “Usefulness of group results discussions” (mean = 3.7).
Discussion
To standardize care in a primary care setting, a system of measurement and feedback was introduced, using simulated cases, into a large ACO. Wide baseline variation was found among providers caring for the exact same CPV patients. Quality scores averaged 58% with a standard deviation of 12%. After 6 rounds of serial measurement and feedback, average performance in the CPV cases improved significantly to 72% and the variation was reduced to 10%. The size of this increase exceeds CPV improvements that the study team has previously shown to be clinically detectable (3%–5%) in patient outcomes. 27 Specific improvements in CPV performance were strongest in workup, diagnosis, and treatment – clinical domains that were expected to have the greatest quality and economic impact.
Payers and providers still face significant challenges to accessing and using data in real time to evaluate and improve physician performance. To overcome data shortcomings, simulations and modeling are being used to address some of the most intractable challenges in health care, such as engaging and improving clinical practice. 28,29 In this study, improvements in the care of the simulated patients are simply a means to an end. Importantly, this study showed that improvements in the simulations correlated with improved performance in patient-level quality measures. Physicians and APPs who did better on their CPVs did better on their ACO patient-level outcomes, with 8 out of 10 quality metrics of actual patients improving. When investigating whether CPV scores predicted patient-level outcomes, the regression analysis showed that there was a statistically significant association in 4 of the metrics (Table 3).
The research team noted that the topics included in the formal group discussion, done after each round—for example, the use of ACE inhibitors and beta-blockers, immunizations, cancer screenings—showed stronger improvement in both the CPVs and the patient-level data than areas that were not prioritized for those discussions, such as LDL testing, tobacco use plan, and diabetic eye exams. This suggests that creating a forum in which providers see their performance and debate appropriate use plays an important role in the observed behavior change. One negative correlation (diabetic eye exams) was observed between CPV scores, which did not improve over time, and patient-level data, which improved slightly. This finding might further support the important role of group discussion but it also shows how important the individual feedback report is in highlighting all gaps in care.
The study team was able to take this analysis further in a quasi-experimental setting. The 3 participating geographical sites were administratively selected, with no reason to suggest significant differences between nonparticipating locations. The baseline analysis of the patient-level performance data substantiated this assumption. After 6 rounds of CPV measurement and feedback, patient metrics improved more at PQQD participating sites than at nonparticipating sites in 6 of 10 instances, 3 of which were significantly different. Not only did participants outperform their nonparticipating colleagues, but those who did better on their CPVs, as measured by overall scores, were more likely to provide the recommended care. This translation of CPV improvements into actual practice mirrors findings in other large-scale studies. 30,31
Another way to measure the benefits of reduced variability is to look at the economic impact. This study found that unnecessary testing fell considerably—saving an estimated $3.5M in unneeded charges across 32 providers. Unnecessary nuclear medicine studies, where more cost-effective diagnostics are recommended, represent 1 specific example of avoidable costs, conservatively estimated to save $330,000 among 32 providers. Lower costs from unnecessary specialist referrals (not to mention the benefit of avoiding an unnecessary set of tests and procedures) was upward of $1.3M. These savings estimates are narrowly focused and do not include other savings opportunities (eg, fewer emergency department visits, fewer complications). They also rely on Medicare reimbursement rates, which are typically lower than most commercial rates, and thus underestimate the total savings. Even with these conservative estimates, savings from the program exceeded the cost of program implementation and administration by several multiples.
Providers need appropriate tools and actionable feedback to help them deliver higher-quality/lower cost care. 27 CPV simulations have been extensively validated and shown to accurately measure real-life practice decisions. 20,21 It was previously shown that when providers at a National Cancer Institute-designated Comprehensive Cancer Center cared for simulated patients, had their performance benchmarked to their colleagues', and received customized feedback on improvement opportunities, oncology pathway adherence improved over time. 32 Other evidence shows that similar efforts to deliver active, multimodal learning can drive sustainable practice change. 27
The study team believes that multiple factors drove the practice changes seen in this study. First, simulated patients provide a unique opportunity for all providers to care for the same patient and to see how their care compares to that of their peers. Using an objective, standardized method to measure care breaks through common barriers preventing meaningful discussion of variation in clinical practice. Secondly, the individual feedback is customized to each provider's care gaps and is delivered in a low-impact, nonthreatening environment. Third, the results discussions allow providers to talk with their peers about specific clinical decisions and build consensus around high-priority areas of variation, rather than focus primarily on concerns about patient-level data validity or case-mix adjustment methodologies. In addition, these discussions provided an environment conducive to a culture of improvement that could be carried forward. Together, this combination of group assessment and feedback gives providers more confidence in their care decisions, to clearly see that “…if both the guidelines and my colleagues don't need to refer or order a new test in this setting, perhaps I don't as well.”
At baseline, 98% of PQQD providers rated their individual quality of care as good or excellent, and only 8% of providers rated practice variability as high. This should not be surprising because most practicing physicians have few opportunities to receive meaningful feedback or compare their practice against their peers. In the study team's experience, physicians often overestimate consensus and their clinical performance. This is especially true in the ambulatory environment, where utilization and outcomes data are hard to come by. Even reliable performance metrics—if available—are obscured by underlying patient variability, limiting the value of feedback and benchmarking. In this study, all providers cared for the same simulated patients, eliminating patient variability and allowing providers to focus only on inter-provider variability.
When standardization occurs around the best available evidence-based guidelines, it helps patients get better care. 33 This project shows that improvements in evidence-based CPV scores translated into improvements in actual care. This finding was further corroborated when the patient-level improvements between intervention and the nonparticipating controls are compared. Although this project measured patient-level process measures, other studies have clearly linked use of process measures (eg, appropriate use of aspirin, ACE-I, beta-blockers) to better outcomes, 34 –36 so there is confidence that the improvements seen in the PQQD translate to ProHealth patient outcomes.
There are several limitations to PQQD, starting with the lack of claims data to support the economic findings, which were unavailable because of data access issues. Secondly, not all participants who started the voluntary program completed it. At baseline, no meaningful performance differences were detected between these 2 groups. Their departures from the study, and thus the analyses conducted herein, potentially blunts the magnitude of the clinical and economic changes related to PQQD. Third, because of limitations in ProHealth's Quality Management database, common to many ACOs, only select ACO quality measures were available. The study team was unable to measure patient-level changes in other items that showed CPV improvements, such as fewer unnecessary cardiology referrals and reductions in the utilization of low-value tests. The ability to track changes in cardiology referrals would have been especially interesting, as PQQD brought together ProHealth PCPs and their cardiology partners to establish referral guidelines used in the cases. Lastly, because participating clusters were not randomly selected, the possibility of selection bias exists—although baseline metrics argue otherwise.
Collaboration between providers and payers, in structures such as ACOs, should benefit patients clinically and financially. This study, in which providers cared for serial simulated patients and received individual- and group-level feedback and benchmarking, led to substantial improvements in 3 areas: (1) CPV scores, which were easy to administer and well received by providers; (2) patient-level metrics of participants, which improved as CPV scores improved; and (3) apparent enormous financial returns for providers and payers by reducing spending on low-value tests and services and generating efficiencies for clinical providers.
Footnotes
Author Disclosure Statement
Drs. Burgon and Peabody and Mr. Paculdo are employed by QURE, LLC; Ms. Czarnecki and Dr. Kropp are employed by Aetna Accountable Care Solutions. QURE, LLC, whose intellectual property was used to prepare the cases and collect the data, was contracted by Aetna Accountable Care Solutions. The other authors declare no conflicts of interest. This study was funded by Aetna Accountable Care Solutions.
Supplementary Material
Supplementary Figure S1
Supplementary Figure S2
Supplementary Figure S3
Supplementary Table S1
Supplementary Table S2
References
Supplementary Material
Please find the following supplemental material available below.
For Open Access articles published under a Creative Commons License, all supplemental material carries the same license as the article it is associated with.
For non-Open Access articles published, all supplemental material carries a non-exclusive license, and permission requests for re-use of supplemental material or any part of supplemental material shall be sent directly to the copyright owner as specified in the copyright notice associated with the article.
