
Abstract
Given the severe and rapid impact of COVID-19, the pace of information sharing has been accelerated. However, traditional methods of disseminating and digesting medical information can be time-consuming and cumbersome. In a pilot study, the authors used social listening to quickly extract information from social media channels to explore what people with COVID-19 are talking about regarding symptoms and disease progression. The goal was to determine whether, by amplifying patient voices, new information could be identified that might have been missed through other sources. Two data sets from social media groups of people with or presumed to have COVID-19 were analyzed: a Facebook group poll, and conversation data from a Reddit group including detailed disease natural history-like posts. Content analysis and a customized analytics engine that incorporates machine learning and natural language processing were used to quickly identify symptoms mentioned. Key findings include more than 20 symptoms in the data sets that were not listed in online lists of symptoms from 4 respected medical information sources. The disease natural history-like posts revealed that people can experience symptoms for many weeks and that some symptoms change over time. This study demonstrates that social media can offer novel insights into patient experiences as a source of real-world data. This inductive research approach can quickly generate descriptive information that can be used to develop hypotheses and new research questions. Also, the method allows rapid assessments of large numbers of social media conversations that could be applied to monitor public health for emerging and rapidly spreading diseases such as COVID-19.
Introduction
Coronavirus disease 2019 (COVID-19) results from infection with the severe acute respiratory syndrome coronavirus 2 (SARS-CoV-2), the cause of the current ongoing pandemic. The novel coronavirus initially manifested in Wuhan, China, in late 2019 and in merely 6 months resulted in more than 13 million cases and 580,000 deaths worldwide. 1
Given the severe nature and rapid impact of this disease, the pace of research and information sharing has been accelerated in a variety of ways, including increased speed of research publications by reducing turnaround time for peer review and posting pre peer-reviewed papers. 2 The result is that more than 32,000 publications related to COVID-19 have been generated in these past 6 months, according to PubMed. Although it is beneficial to disseminate this information quickly, culling information from this large publication volume can be difficult and time-consuming. 3
There is a tremendous amount of information relating to symptoms at the onset of disease, and disease symptoms, treatments, and management for hospitalized patients. Responses of individual patients can vary widely, from asymptomatic or mild disease to multi-organ failure and death. 4 Accumulating evidence suggests that COVID-19 can impact many bodily systems that encompass respiratory, 5 immunologic, 4 gastrointestinal, 6 ocular, 7 urologic, 8 hepatic, 9 dermatologic, 10 neurologic, 11 and psychiatric 12 effects. To help people determine whether they might have COVID-19, leading health information providers list symptoms of COVID-19 online. For example, the Centers for Disease Control and Prevention (CDC) lists 16 symptoms 13 and the World Health Organization (WHO) lists 14 symptoms. 14 The Mayo Clinic 15 and WebMD 16 also provide lists online. Nine symptoms on all 4 lists, as of July 13, 2020, include fever, cough, difficulty breathing, fatigue, body aches, headache, sore throat, diarrhea, and loss of taste or smell.
There is less information about the full course of the disease, including pre and post hospitalization, with recovery spanning months. 17 Also, it is plausible that the course of the disease for people who never see a doctor might be different, and there are few if any resources to learn of their experiences. Details about impacts and experiences with COVID-19 in daily life pre and post hospitalization might not be communicated to clinicians or captured in publications.
The research team used social listening methods, 18,19 which were developed to extract information from social media channels, to explore symptoms and disease progression of COVID-19. The team analyzed data from 2 social media communities: conversation data from a public Reddit group, including natural history-like posts detailing the time line of the disease, and a closed Facebook group poll. Several approaches were used to quickly identify disease symptoms being discussed in social media conversations. The goal of this pilot study was to determine whether, by analyzing voices of patients from social media posts, new information could be identified that might have been missed by other methods of collecting information about patient experiences.
Methods
Reddit COVID19-positive subreddit conversation text analysis
TREND Community, using the Reddit API, accessed social media conversation data from the Reddit group (subreddit) called “COVID19-Positive” 20 that self-describes as “a place for people who came back positive for COVID19 can share your stories, experiences, answer questions and vent!” At the time the conversations analyzed for this study were downloaded, the group had 67,000 members from all over the world, many in the United States. The data set includes conversations posted during March 14–June 23, 2020. The subreddit is publicly available.
Full conversation data set analysis
The full conversation subreddit data set was analyzed using the TREND Community analytics engine named “Krystie,” which uses supervised learning and natural language processing techniques to identify disease burden and disease management concepts. The primary tool for identification of disease symptoms is an ever-expanding taxonomy of terms used in patient conversations on social media in communities for rare and chronic diseases. The taxonomy has been developed over the past 2 years as TREND listens to these communities and learns how they describe and manage their symptoms. There is no demographic information for this group because Reddit does not collect or make public any information on demographics. The subreddit allows for tags or flairs to be added to each post, and in this subreddit those tags let others know if the author tested positive for the virus or is presumed positive by a doctor.
Subpopulation analysis of time line posts
This rich data set contains 81 posts that are similar to natural histories in which the author gave a detailed time line of the symptoms and the course of the disease. These were found using keyword searches for “timeline,” “day 1,” or “week 1.” The research team considers these posts to be patient-authored natural histories of their own disease. Analysts manually labeled text (words or phrases) as falling into one of 8 predetermined categories: age, gender, week 1 symptoms, week 2 symptoms, week 3+ symptoms (symptoms described during week 3 and beyond), start date, end date, and geographic location. Within the posts, some authors identified their age, gender, and geographic location, which are summarized in Table 1. The analysts used Sagemaker's Grounded Truth to label the data.
Demographics and Characteristics of the COVID19-Positive Subreddit Subgroup for Natural History Analysis 1
The subreddit group (n = 81 posters) was identified as posters whose posts contain longitudinal information about the course of their disease.
The number of genders specified is greater than the number of authors who mentioned gender because some posts mentioned more than 1 gender.
The list of terms for week 1 symptoms, week 2 symptoms, and week 3+ symptoms were reanalyzed by the analytics engine Krystie, which classified the symptom concepts. In some cases, concepts included several different symptom terms found in the text. For example, “fever” and “temperature 101.5” are classified as fever and counted together to get the total number of mentions for fever. Examples of concepts are shown in Supplementary Table S1.
Facebook poll of symptoms
The founder and administrators of a private Facebook group called COVID-19 Support Group, 21 which welcomes people who have, have had, or are presumed to have or have had COVID-19, approved use of data from a poll that was conducted within the online group. The administrators started the poll on May 25, 2020 using a list of symptoms named by patients from a previous poll, where participants could describe symptoms not listed in the comments section. For the current poll, administrators added any symptom to the list that had ≥10 positive responses in the first poll and locked the list. Eligibility for the group included confirmed or presumptively positive people. Data were downloaded from the poll on July 13, 2020. There were 5691 members when the poll started and 15,208 members in the group when the poll concluded. Although Facebook provides some demographic information about group members, the demographic breakdown for those who filled out the poll was not available.
COVID-19 symptom lists from online resources
To identify commonly used online resources for COVID-19 symptoms, the research team conducted a Google search on July 13, 2020, and identified top results to compare with the pilot study data. The 4 leading resources were the CDC, 13 WHO, 14 WebMD, 16 and Mayo Clinic 15 websites, and their online web page symptom lists at the time of this analysis are listed in Supplementary Table S2.
Analytical considerations
Data were collected from conversations posted by individuals on social media and thus might not be representative of all people living with COVID-19. By virtue of being able to access social media, the method favors literate people with the means, time, interest, and ability to participate in conversations. Although 3 of the natural history-like posts were written by family members of people who were too sick to keep track themselves, most posts were by people who were able to keep track of their own illness and describe it.
The team is limited by the assumption that the people who responded to the Facebook poll or posted on Reddit honestly represent their experience of the illness, their symptoms, their diagnoses, and disease progression. It is possible that people could be misrepresenting themselves, the illness, and their situation for a variety of reasons, including a possible Hawthorne effect. 22 However, the large size of the data sets for the Reddit conversation data and the Facebook poll should trend to data validity and will provide precision, yet this will not correct for potential bias (inaccuracy). In the 81 natural histories, we could be seeing some descriptions of an illness that is not COVID-19, but no descriptions stood out as substantially different from the rest.
Inter-analyst reliability for the labeling of the natural history data set was calculated by comparing a random set of the analyzed data from the Reddit subset. Agreement was found between coders 85% of the time, with a Cohen's kappa value of 0.62. All disagreements seen were from items not being labeled by one or the other of the analyzers. Given this same set of data, the research team is confident that the measures would be repeated if performed again. The team notes that, because of the shifting nature of information about COVID-19, both within the medical community and the patient community, the way people talk about the illness and the symptoms has shifted even as this paper was being written. Symptom lists provided by the CDC, 13 for example, have changed over time as more became known about the illness. Thus, a similar comparison of patient lists of symptoms to online resources' lists of symptoms in 2 months might show more cohesion than the current lists.
The study was conducted with an exemption under 45 CFR § 46.104(d)(4) by the Western Institutional Review Board.
Results
Full data set analysis of COVID-19-positive subreddit
Conversations on the COVID-19-Positive subreddit were analyzed using the analytics engine Krystie, which matches terms in the conversation with concepts in the taxonomy to identify topics of conversation. This analysis focused on the symptoms mentioned in the conversations. Krystie identified counts of mentions of symptoms in the full conversation data set. The top 15 symptoms are listed in Table 2, and the full list of symptoms is displayed in Supplementary Table S3. These data reveal what the authors are talking about as descriptive results. It is important to note that, currently, the analytics engine only notes that a term was mentioned and does not provide context for the mention, such as sentiment. With more than 14,000 mentions of some terms, the research team cannot determine the context in which each was mentioned, but assumes that large numbers of people mentioning the same term suggests that it is worth further study. The team also is unable to assign mentions to specific authors and thus cannot discern whether a term is mentioned once by multiple authors or mentioned many times by a few authors. Most likely it is a combination of both.
Top 15 Symptoms Mentioned in the Subreddit Full Conversation Data Set and the Disease Natural History Subpopulation 1
These lists show the top 15 symptoms in the 2 subreddit data sets (full subreddit conversations and natural disease history subpopulation conversations) in order of number of mentions of the symptoms. The count represents the number of times the term was mentioned in the text. The full lists of symptoms are included in Supplementary Tables S3 and S4.
Natural disease history analysis of COVID-19-positive subreddit
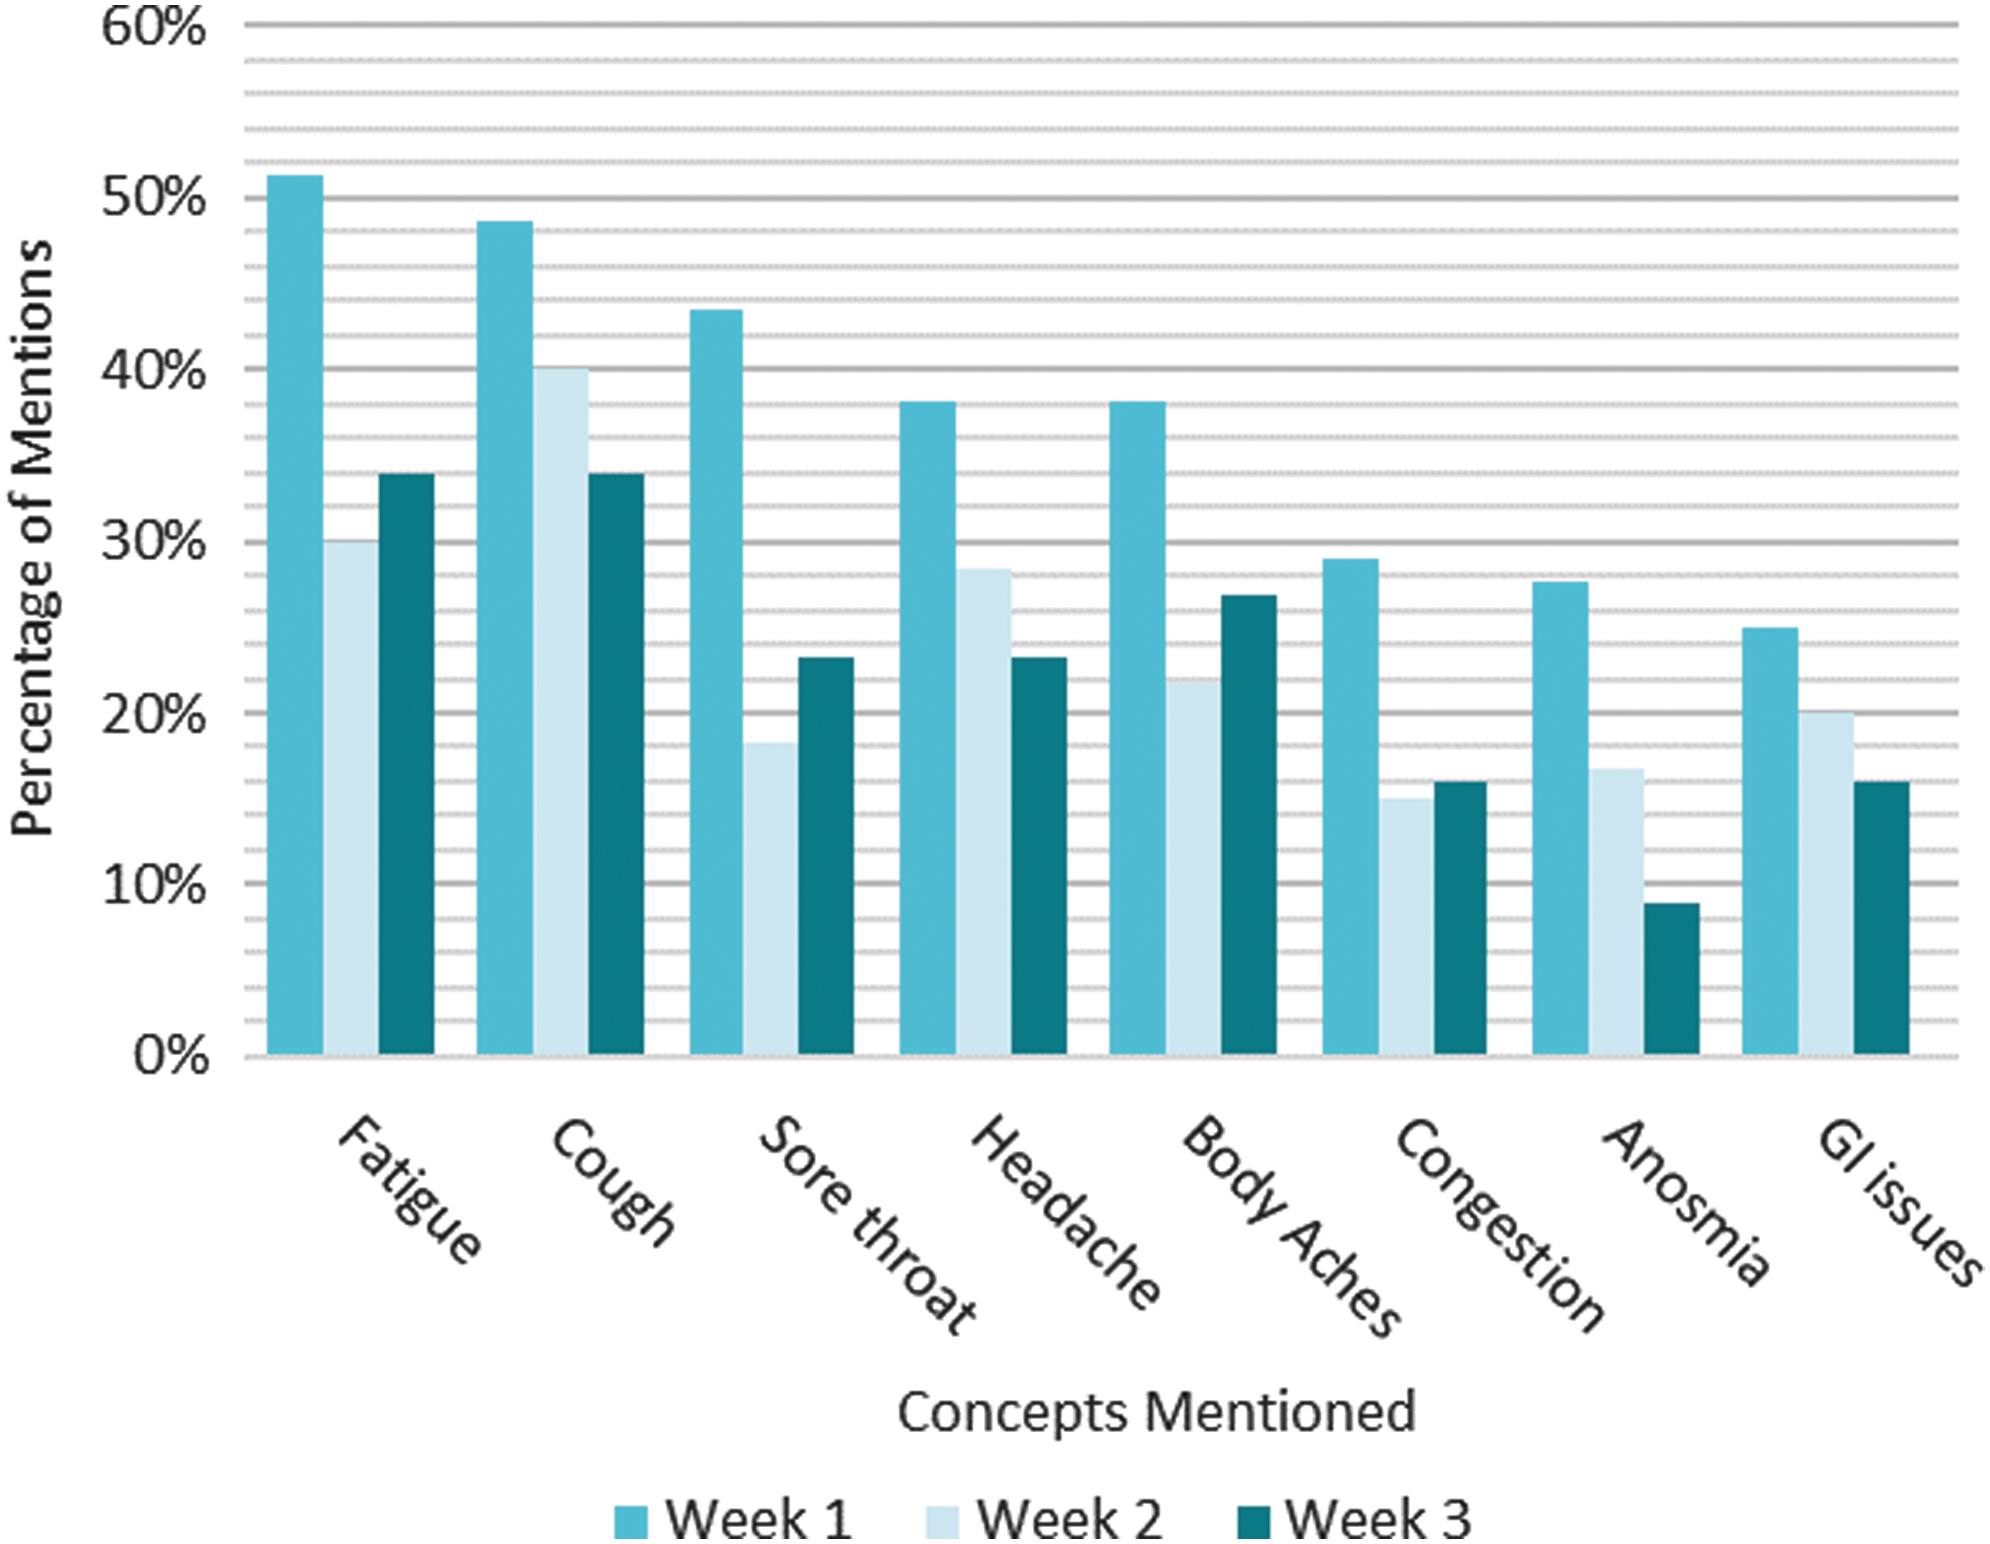
Using the 81 subreddit natural history-like posts, the team found patterns that emerged from the posts and presents major findings about symptoms and symptom changes over time (Figures 1 and 2). The list of the top 15 most frequently mentioned symptoms is shown in Table 2, and the full list of symptoms is included in Supplementary Table S4.

Symptoms that increase over time in patient-authored natural disease histories.1
Symptoms that decrease over time in patient-authored natural disease histories.1
The 81 natural history-like posts typically would start with a paragraph about the person writing and their situation. Some mentioned their gender, age, smoking status, health conditions, exercise schedule, and other information. The limited demographic information gleaned from author descriptions is shown in Table 1. Some authors described how they think they caught the virus. For example, a post might say: “29 F, non-smoker, marathoner. My boyfriend is a nurse and I think I caught the virus from him, although he did not appear sick.” A few of the posts detailed the symptoms of multiple people in a family. Interestingly, a large proportion of authors reported having symptoms for at least 4 weeks, with the longest reported as 90 days. There was no pattern relating the length of the illness to age. Of the 27 people younger than age 40 who listed their age, 8 did not mention week 3+ symptoms and 19 did.
After introductory information, the typical post would then provide a time line with dates or day numbers (eg, “day 1”), the symptoms experienced, and actions taken on that day. For example, a history might start like this: “March 9: Woke up with a scratchy throat, thought it was allergies and went about my day. At 4 p.m. I was exhausted and hot, realized I had a fever.” In most posts, people mentioned their symptoms and the day on which they experienced those symptoms.
Many of the symptoms changed over the progression of the illness, with 13 symptoms increasing and 10 symptoms decreasing over time (Figures 1 and 2; Supplementary Table S5). Three symptoms remained relatively constant (shortness of breath, no appetite, and fever; Supplementary Table S5). The full count data for all symptoms are provided in Supplementary Table S5.
These analyses present anecdotal, qualitative data regarding the symptoms that the authors were talking about in the context of their disease experiences over time. It is important to note that the data reflect author conversations and the symptoms they choose and remember to report on social media, and limitations of the data should be considered when interpreting results (see the Discussion). For example, some people might have mentioned only new symptoms rather than repeating all symptoms they felt each day.
COVID-19 Facebook group poll results
TREND Community also analyzed another data source to learn about patient experiences with COVID-19. The administrative team of the Facebook COVID-19 Support Group first created a poll for which participants were asked to list their COVID-19 symptoms. One of the administrators has COVID-19 and felt that the symptoms publicized were not inclusive of symptoms that patients were experiencing, so she started the poll. The poll methodology and group characteristics are described in Methods. They used the symptoms list from the first poll to create a second poll with locked options. When poll data were pulled on July 13, 2020, there were 99 descriptors of patient experiences listed in the poll (the full list is included in Supplementary Table S6). The numbers of respondents per symptom ranged from 5 for “I have been on a ventilator” to 2803 for “fatigue, lethargy, weakness.” The poll included the descriptors “symptomatic at 30 days,” “symptomatic at 60 days,” and “symptomatic at 90 days” that are not related to specific symptoms.
Comparison of social listening results with online symptom information resources
The research team compared the top 40 symptoms in the Facebook poll results and corresponding subreddit conversation data to symptoms listed on leading resource information web pages (Tables 3 and 4). The team selected the top 40 symptoms so that “high temperature,” which does not appear in poll results until item 39, could be included. There is variability among the 6 lists. The specific symptoms that are listed on all of them include sore throat, cough/dry cough, and fever/high temperature. Grouping related terms, all lists named some type of fatigue, though the common specific symptom of “talking causes exhaustion” in the poll was not listed on any of the web pages. This phrase refers to authors feeling exhausted even from just talking, based on reading posts that name the symptom. All lists named something related to body aches and pains, and the Facebook poll was highly specific in describing body locations of pains. The Mayo Clinic description of “muscle aches” did not capture pains described in other areas of the body. The WHO and WebMD description of “dry cough” was narrower than the descriptor “cough” in other lists. Given descriptions of congestion and mucus in the symptom lists, it is possible that some coughs were not dry.
Data were pulled from a poll conducted in the COVID19-Positive Support Group as described in Methods. The top 38 most frequently tagged symptoms are listed out of a total of 78 symptoms in the poll, and they are listed in order of decreasing number of respondents.
Other resources included the CDC and WHO as leading health organizations, and 2 other top Google search results after the CDC from a Google search for “COVID-19 symptoms,” excluding blogs. The online symptom lists were pulled on July 13, 2020 (see the appendix).
Symptoms listed on the CDC Symptoms of Coronavirus web page 13 as of July 13, 2020.
Symptoms listed on the WHO Coronavirus Symptoms web page 14 as of July 13, 2020.
Symptoms listed on the Mayo Clinic Coronavirus Disease 2019 (COVID-19) web page 15 as of July 13, 2020.
Symptoms listed in the WebMD Signs of Coronavirus (COVID-19) web page 16 as of July 13, 2020.
Based on context, “change in smell” was interpreted as being able to smell but smelling was off or unusual smells were noticed.
CDC, Centers for Disease Control and Prevention; GI, gastrointestinal; n/a, not applicable (because not listed in the indicated online resource); WHO, World Health Organization.
Patient Voice Terms Absent from Online Symptom Lists 1
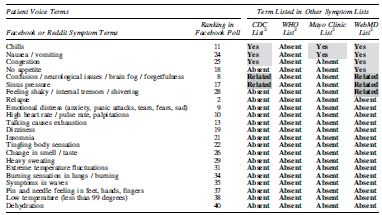
Patient Voice Terms refers to symptoms described in the Facebook poll or the subreddit group conversation. The table includes terms for which at least 1 online resource was missing the term. “Yes” indicates the same symptoms are described. “Absent” refers to a lack of any similar or related term in the online list. “Related” refers to terms that are similar or affect related areas (eg, feet, toes) but are different symptoms.
The symptoms are from online lists provided by the CDC, 13 WHO, 14 Mayo Clinic, 15 and WebMD 16 websites as of July 13, 2020.
CDC, Centers for Disease Control and Prevention; n/a, not applicable (because not listed in the indicated online resource); WHO, World Health Organization
There were symptoms on the online web page lists that were not included in the top 40 results of the poll, as shown in the last row of Table 3. Runny nose, mucus or phlegm, and bluish lips or face were not in the poll. In total, there were 22 symptoms listed in the poll that were mentioned in at least 1 online list as a direct or related match. In contrast, there were 59 symptoms from the Reddit full conversation data and 80 symptoms mentioned in the Facebook poll that did not appear on any of the 4 online resource symptom lists. Table 4 shows a summary of terms for which at least 1 online site was lacking a patient voice term. For terms unique to the patient conversations, lists of the top 25 most frequently mentioned symptoms and mentions from both conversation data sets are shown in Supplementary Table S7. These comparisons show that people are talking about symptoms that are not listed as key symptoms on publicly posted information sites. Given the limitations of the data sets and the descriptive nature of the study approach, the research team cannot make any suggestions as to whether these additional symptoms should be included on those lists.
Discussion
This pilot study was designed to assess whether social listening might be a valuable tool for understanding new and emerging diseases such as COVID-19, and as a rapid method to query tens of thousands of people. The aim was to determine whether people with COVID-19 are talking about symptoms that are not listed by major health information resources. 13 –16 Two data sets from social media groups of people with or presumed to have COVID-19 were evaluated: a poll conducted in a Facebook group, and conversation data from a subreddit including time line conversation data from a subset of 81 individuals to develop natural history-like descriptions of patient experiences. Both data sets contained many symptoms that were not listed in the CDC, WHO, Mayo Clinic, or WebMD lists of symptoms. Furthermore, using natural history-like posts in the conversation data, symptoms were identified that increased or decreased in mention frequencies from week 1 through weeks 3 or more of patient experiences (Figures 1 and 2).
Other groups have used different methodologies to extract information about large numbers of people infected with COVID-19. Two studies stand out as interesting examples for comparison. The first study performed a systematic review of published studies that reported drug therapies for COVID-19 patients. 3 The authors screened 2706 publications and identified 155 published studies that met their inclusion criteria. Two individuals read all 155 studies and manually extracted information about administered drugs into spreadsheets, and a third person reviewed the extracted data to resolve discrepancies. They identified 115 drugs that were administered to the first 9152 reported COVID-19 cases. The second study recruited 30 medical students, who trained for hours to extract data from electronic medical records from the first 1000 cases of confirmed COVID-19-positive patients in New York City. 5 They manually culled details about demographics, highest level of care (eg, intensive care), comorbidities, drug treatments, and symptoms.
The research team highlights these studies to contrast the level of effort and time commitment needed for these methodologies compared to social listening, in which the team gathered information from tens of thousands of people with substantially less time and effort. Each approach has strengths and weaknesses, and each is designed to gather different types of information. The strength of social listening, when compared to these 2 studies, is that within 2 weeks, a substantial amount of qualitative information can be garnered from large populations. The qualitative information can be used to provide snapshots of current situations and to serve as a foundation to build hypotheses and further quantitative analyses. Social listening amplifies voices of people experiencing diseases such as COVID-19 by producing qualitative data that may inform future research. Some of the information might otherwise be missed (eg, symptom information from people who have not seen a doctor). Social listening is hampered by problems with representing the entire population. For example, participants are not randomly selected from the patient population and the terms mentioned are not taken in context so the symptoms might not be tied to the disease. The approach is qualitative in revealing what is out there, or the possible, to facilitate new hypotheses in preparing for more rigorous research that otherwise might not be conducted.
TREND Community has successfully applied the technology in other arenas, including rare disease populations and pharmaceutical applications. For example, TREND Community brought attention to sleep issues among children with Prader-Willi Syndrome, a rare disorder affecting approximately 1 in 15,000 to 30,000 births, by quantifying caregiver mentions of various concerns in social media conversations. 23 That information subsequently led to identifying new treatments for narcolepsy and cataplexy-like symptoms, leading to improvements in children's lives. 24 –26 Also, TREND Community used social listening to identify drug therapies, under-recognized disease symptoms, and unmet needs for numerous rare disease communities. Results have been shared with a variety of stakeholders, including pharmaceutical companies and appreciative patient populations.
In the case of COVID-19, the situation is at the other end of the spectrum from rare diseases. The exponential rise in infections has led to more than 3 million cases in the United States alone. 27 People want to learn about symptoms to determine if they have the disease and need to go to the hospital. Early detection is important to contain and slow transmission of the illness. Accumulated evidence shows that SARS-CoV-2 infection impacts nearly every, if not every, bodily system. 4 Furthermore, the list of associated symptoms has been growing. For example, loss of taste or smell was recognized as an early symptom after the accumulation of reports of the symptom in infected individuals. 28
Using social listening, the research team inquired as to whether some symptoms are being overlooked. In this pilot study, the team compared the results of that analysis with lists of symptoms provided by 4 sources of information: the CDC, 13 WHO, 14 Mayo Clinic, 15 and WebMD. 16 That comparison revealed that some symptoms were absent from these lists, including several terms in the Facebook poll (Table 4). Symptoms that stood out as unusual were high heart rate, talking causes exhaustion, emotional distress, anxiety, and neurological symptoms such as dizziness and tingling. It is possible that the emotional distress and anxiety may be symptoms related to other neurological symptoms that may warrant special attention from physicians. In summary, this pilot study identified many symptoms that patients are discussing that were not in the 4 online symptom lists. Further hypothesis-driven research can use that information to explore whether those symptoms are important for early diagnosis or treatment of COVID-19.
The Facebook poll provided qualitative information about the range of symptoms that people had been experiencing. One strength of the poll is that the descriptors were created by people experiencing COVID-19, drawn from an initial poll that collected symptoms from patient input. For the poll results analyzed for the present study, the symptom list was locked so that all respondents could choose from all symptoms and thus the ranking order by number of responses can be informative. For example, although fever features prominently as a symptom for identifying people with COVID-19 and businesses rely on temperature checks, fever was ranked 39th in the list of responses in the poll. One shortcoming is that, with no demographic information, the research team cannot account for possible selection bias in the population who responded (eg, it may be skewed toward people who are sicker or more willing to interact on social media than the general population). Another shortcoming of the poll is that the process of curating new symptoms was labor intensive, especially for the administrators who themselves are battling the disease. In spite of shortcomings, the list provides qualitative value in that it provides an accumulated list of symptoms experienced by participants, yielding a list of 99 symptoms, 59 of which were not listed by the 4 other resources.
Likewise, the subreddit analyses provide useful insights into symptoms and experiences of people with COVID-19. The patient-authored disease natural histories show that some symptoms increase and some decrease over the course of the disease. The symptoms that are more common early on might be more important to include in lists of symptoms, as people often will search online to determine if they have the disease. The more common symptoms in the present analyses were chest pain, anxiety, fatigue, cough, sore throat, headache, and body ache, which completely overlap the online medical reference site lists. It would be interesting to probe more deeply into the time line conversation to tease out whether the same individuals who are experiencing decreases in one symptom, such as cough, are also experiencing increases in other symptoms, such as difficulty breathing. Unfortunately, there are limited demographic data about the authors of these posts. It is possible that the trends may represent 2 different subsets of patients – namely, ones with mild-to-moderate disease (eg, the decreasing common symptoms of cough and loss of smell) as opposed to the potentially more ominous symptoms of “difficulty breathing,” “lung issues,” and “chest pain” that trend upward over the first 3 weeks of illness. Alternatively, the symptoms that are declining may in fact be going away as the other symptoms emerge in either real or perceived importance across the entire population and represent the broader natural history of COVID-19 in general.
There are important limitations to consider when interpreting the results. In addition to constraints related to limited demographic information, the team assumes that the authors of the posts are honestly representing their disease experience. It is possible that people could be misrepresenting themselves, the illness, and their situation for a variety of reasons, including a possible Hawthorne effect. 22 Although the large size of the data sets for the Reddit conversations and the Facebook poll provide precise information, they do not overcome bias (inaccuracy) considerations. The information does not support rigorous statistical comparisons. Also, mentions are counted without context, introducing uncertainty in the interpretation. Given the limitations, the research team emphasizes that this study is an exploratory descriptive study, not a confirmatory quantitative study. These data may provide new information that can generate hypotheses for further quantitative and controlled research designs.
Remarkably, 32 of the 81 subgroup authors reported having symptoms for 4 weeks or longer. These results suggest COVID-19 may linger with patients for weeks or months. Many mentioned the symptoms coming in waves, such that they might feel good for a few days and horrible for a few days. This aspect of the disease is critical for public health and policy. For example, 2 weeks off to recover from the illness may not be enough. These issues related to disease persistence need to be better understood as part of the public policy response to this illness.
The use of social media to gather health information is growing. Some studies used social media surveillance, which they refer to as “infoveillance,” during the early phase of COVID-19 in China to report on symptoms to better detect infections as the virus spread worldwide. 29 –31 Social listening contributes real-world data (RWD) that falls outside of conventional or traditional modes of research data collection such as conventional randomized controlled clinical trials. In the context of therapeutics, real-world evidence, derived from the analysis of RWD, is clinical evidence regarding the use and potential benefits or risks of a medical product. 32,33 Stakeholders, including the US Food and Drug Administration, currently recognize data derived from the following sources as examples of RWD: electronic health records, medical claims and billing data, data from product and disease registries, and data from mobile health devices. Real-world evidence is informing and accelerating the pace of research, regulatory review, and medical product commercialization. The ability to detect signals in very large data sets using social listening could be especially meaningful for rare and emerging diseases, or to detect future pandemics.
In future work, the research team will explore how these analyses can be extended to develop a system for near-real-time analysis of data on an ongoing basis to monitor the disease for possible detection of changes in the nature of the disease course. The long-term goal is to link social media to medical records for the purpose of capturing COVID-19 patient experiences throughout their entire journey, including pre- and post-hospitalization, ultimately leading to a better understanding of disease and improved care.
Conclusions
This pilot study analyzed 2 data sets from social media groups of people with or presumed to have COVID-19: a poll conducted in a Facebook group, and conversation data from a Reddit group including patient-written natural history-like posts of COVID-19 experiences. The study identified 13 symptoms that were increasing and 12 symptoms that were decreasing or stable in prevalence in time line conversation data. Furthermore, Reddit and Facebook groups reported that the disease was lasting longer than 3 weeks, and up to 90 days or more. Persistent disease was reported across a wide range of ages, including people younger than age 40. The combined data sets contained more than 60 symptoms that were not listed in the 4 online symptom lists: CDC, WHO, Mayo Clinic, or WebMD. This pilot study demonstrates that social media data can offer novel insights into patient experiences as a source of RWD. This inductive research approach can quickly generate descriptive information that could help form hypotheses for deductive research approaches. The method also allows for timely assessments of large numbers of social media conversations that could be applied to monitor public health for rapidly spreading diseases such as COVID-19.
Footnotes
Author Disclosure Statement
Ms. Picone and Mr. DeFelice are co-owners of TREND Community, and Drs. Inoue and Wassman hold stock options in the company. TREND Community extracts and analyzes information from social media for the benefit of patients and furthering clinical research that leads to improvements in their quality of life. TREND is a Public Benefit Corporation, an entity that allows it to be self-supporting without needing to fundraise. The results of the analyses have no bearing on the revenue incurred, avoiding any pressure to introduce bias into the analysis. The analyses provide information to TREND Community customers who choose what to do with the information. The remaining authors declared that they have no conflicts of interest.
Funding Information
No funding was received for this article.
Supplementary Material
Supplementary Table S1
Supplementary Table S2
Supplementary Table S3
Supplementary Table S4
Supplementary Table S5
Supplementary Table S6
Supplementary Table S7
References
Supplementary Material
Please find the following supplemental material available below.
For Open Access articles published under a Creative Commons License, all supplemental material carries the same license as the article it is associated with.
For non-Open Access articles published, all supplemental material carries a non-exclusive license, and permission requests for re-use of supplemental material or any part of supplemental material shall be sent directly to the copyright owner as specified in the copyright notice associated with the article.