




Abstract
Most risk stratification approaches attempt to predict clinical outcomes rather than value. For a provider organization or health system to have financial success in value-based contracting, future risk models must analyze costs as well as disease burden. The purpose of this study was to create a customized risk stratification algorithm that considered a patient's medical spend alongside disease burden while delivering a scoring system that improves the efficiency of a care coordination program. The authors focused on University Hospitals (UH) Health System's Accountable Care Organization population of 554,805 because this patient cohort is engaged with UH's primary care network and has the most robust data. The 5-category risk algorithm was found to be meaningful and impactful after integrating the foundation of the Minnesota Tiering system with an expanded comorbidity list and weighting the result by the previous 12 months of medical spend. This new technique can identify patients in need of intensive care coordination. The complex risk tier of the stratification system reduces the number of patients from 551,045 to 27,552, or 5% of the patient population, and accounts for 67.9% ($1,107,822,887) of total annual medical spend. Expanding care coordination efforts to patients in the top 2 tiers would account for 15% of the patients and 83.2% ($1,357,545,872) of annual medical spend. The novelty of the new approach allows clinical teams to focus intense resources on a smaller sample of the patient population and to identify chronic conditions contributing to costs, and feel confident that they have greater explanatory power regarding value.
Introduction
As provider organizations accelerate toward a value-based approach to population health management, tactical approaches are developed to measure and improve the 3 components of the Triple Aim: (1) improving the health of populations, (2) reducing costs, and (3) delivering a quality patient experience. All three require the ability to stratify patients by risk in order to identify and address high-priority issues that impact larger groups of patients, forestall or avoid costly events, and ensure that individual needs are met in a timely and efficient manner. To achieve the Triple Aim, health systems and provider organizations look for answers in either implementing new technology or instituting a new process.
In a recent article published in the journal of Population Health Management, authors Kaminski and Mangat 1 argue that health care leaders face an overwhelming number of technology choices to help optimize a population health management strategy. Kaminski and Mangat discussed a number of strategy pillars including “processes” and “technology,” where processes are intended to help determine the right care management and operating procedures required to engage and manage a population effectively. And, technology enables the people and processes to integrate workflows while staying focused on the life experiences of people with whom we engage. The article highlights that frontline medical staff perceived technology platforms as extra work or additional burden instead of a meaningful tool that can achieve health care's Triple Aim.
To ensure that technology platforms enhance rather than diminish value, data scientist and health system leaders need to collaborate closely and iteratively develop and test these platforms and ensure that they increase value. Examples of this type of collaboration are beginning to be published. In 2016, data scientists and health care leaders collaborated at UCLA Health to implement their own approach to identify patients with high expenses and in need of proactive care. 2 Two years later, the study health system, University Hospitals (UH) of Cleveland, OH, reported a collaboration between data scientists and system leadership whereby UH implemented a new management framework to identify defects in value and address challenges that may make health care suboptimal for patients. 3
An article discussing this process was published in New England Journal of Medicine Catalyst and the narrative built on Kaminski and Mangat's pillars, demonstrated that defects in value result in $1.4 trillion dollars of waste annually in the United States, and presented an overview of UH's journey to eliminate these defects and reduce Medicare spend by 9%. UH's risk stratification assessment and its integration into clinical workflows were essential to realize those results. Yet, the risk adjustment methodology used to achieve high-value care coordination at UH has not been previously published and described. This article presents how UH developed its risk stratification process to achieve a value-based approach for 554,805 patients.
Why risk stratify populations in health care?
In patient engagement, risk stratification means determining which patients are most at risk of developing a costly or burdensome condition, of costing the organization money, or of seeing a preexisting health care condition worsen. The current US health care climate is focused on delivery transformation and reform through value-based models that increasingly hold health care organizations accountable for population-based outcomes. Many health systems have created Accountable Care Organizations (ACOs) as a type of value-based model that relies on patient risk stratification to identify high-risk patient populations for targeted care coordination and population health management activities. 4
As health systems, hospitals, and providers begin to enter into downside financial risk agreements with payors as a mechanism to improve quality and control costs, the ability to focus on subgroups of patients who are responsible for defects in value becomes critical. One solution is to use predictive modeling, or other mathematical solutions, to proactively identify patients who are at highest risk of poor health outcomes and who will benefit the most from targeted care coordination and a higher dose of ambulatory care. The concept of a “Dose of Ambulatory Care” has been studied at UH for the past 2 years. The concept was derived after observing patients with high readmission rates within disease-specific cohorts such as congestive heart failure. In cases in which 90-day readmissions rates were well above 20%, UH found that many of those readmissions can be prevented if the number of ambulatory touch points is greater. An ambulatory touch point is not restricted to a physician ambulatory visit but also should include ambulatory visits or contact (eg, phone call, telehealth visit, email) from nurse practitioners, physician assistants, specialists, social workers, and other types of care coordinators.
Seven risk stratification approaches have been widely written about and tested successfully for different health care scenarios over the last 2 decades. These include (1) Hierarchical Condition Categories, 5 (2) Adjusted Clinical Groups (ACGs), 6,7 (3) Elder Risk Assessment, 8 (4) Chronic Comorbidity Count, 9,10 (5) Minnesota Tiering, 11 (6) Charlson comorbidity measure, 12,13 and (7) Elixhauser comorbidity index. 14,15 The charlson comorbidity index and the Elixhauser comorbidity index are used as a method for predicting mortality by classifying or weighting comorbidities. The Elixhauser Index has a 31-point scoring system and can be condensed to a single metric that summarizes disease burden and is adequately discriminative for death in acute settings. The Minnesota Tiering model is constructed by calculating adjusted clinical groups and major extended diagnostic groups. The purpose of Minnesota Tiering is to group patients into complexity tiers based on the number of major condition categories to which they belong. The total sum of conditions is grouped into 5 patient complexity levels: low (tier 0): 0 conditions; basic (tier 1): 1 to 3 conditions; intermediate (tier 2): 4 to 6 conditions; extended (tier 3): 7 to 9 conditions; and complex (tier 4): 10 or more conditions. 16 All of these approaches predict clinical outcomes rather than value. For an ACO to have financial success and thus sustainability, risk models must predict costs as well as clinical outcomes.
Both processes and technologies can be optimized for value-based care and provider organizations can observe significant return on investment by customizing the risk stratification process.
UH believes that if health systems have a data science program, then there is value to developing internal stratification products that can be customized to the population in lieu of purchasing similar products from established third parties. Additionally, there is opportunity to improve on previous risk stratification methodologies and tailor them toward a health system's value-based care strategy. Therefore, UH developed a customized population health risk stratification algorithm that considered a patient's medical spend alongside disease burden. UH recognized that clinical and financial risk models have lived side by side in hospitals and health systems for years, but the value of a new approach would be to converge clinical and financial factors into a network-level stratification system that emphasizes value and makes segmenting patients easy for care coordinators and clinicians. The final objective of creating the stratification algorithm internally was to integrate the output and corresponding insight from the model into UH's Population Health Reporting System, making the information accessible to clinical staff across the health system.
Methods
Data sources and enterprise data warehouse
UH is a large, integrated health care system in Northeast Ohio, serving approximately 1.2 million unique individuals. Patients have access to 18 hospitals, 21 emergency rooms, and 2400 employed providers with more than 400 specializing in primary care. The payer base is broad, inclusive of traditional Medicare, Medicare Advantage, Medicaid, and a large range of commercial providers. In addition, UH is part of a clinically integrated network (ie, UH Quality Care Network) that brings together more than 4000 independent providers with the 2400 UH employed providers. UH has ACOs that are responsible for 554,805 patients across multiple value-based programs as of 2021.
Data sources used to develop the risk stratification algorithm originated from clinical, administrative, and financial data in the enterprise data warehouse (EDW) at UH (Figure 1). UH's EDW environment consists of both on premise SQL servers and cloud-based containers in Microsoft Azure (Microsoft Corporation, Redmond, WA). In 2017, the UH data science team and UH information technology teams collaborated to build UH's first EDW, which integrates more than 180 different systems or data repositories to facilitate access for UH's analytic community.
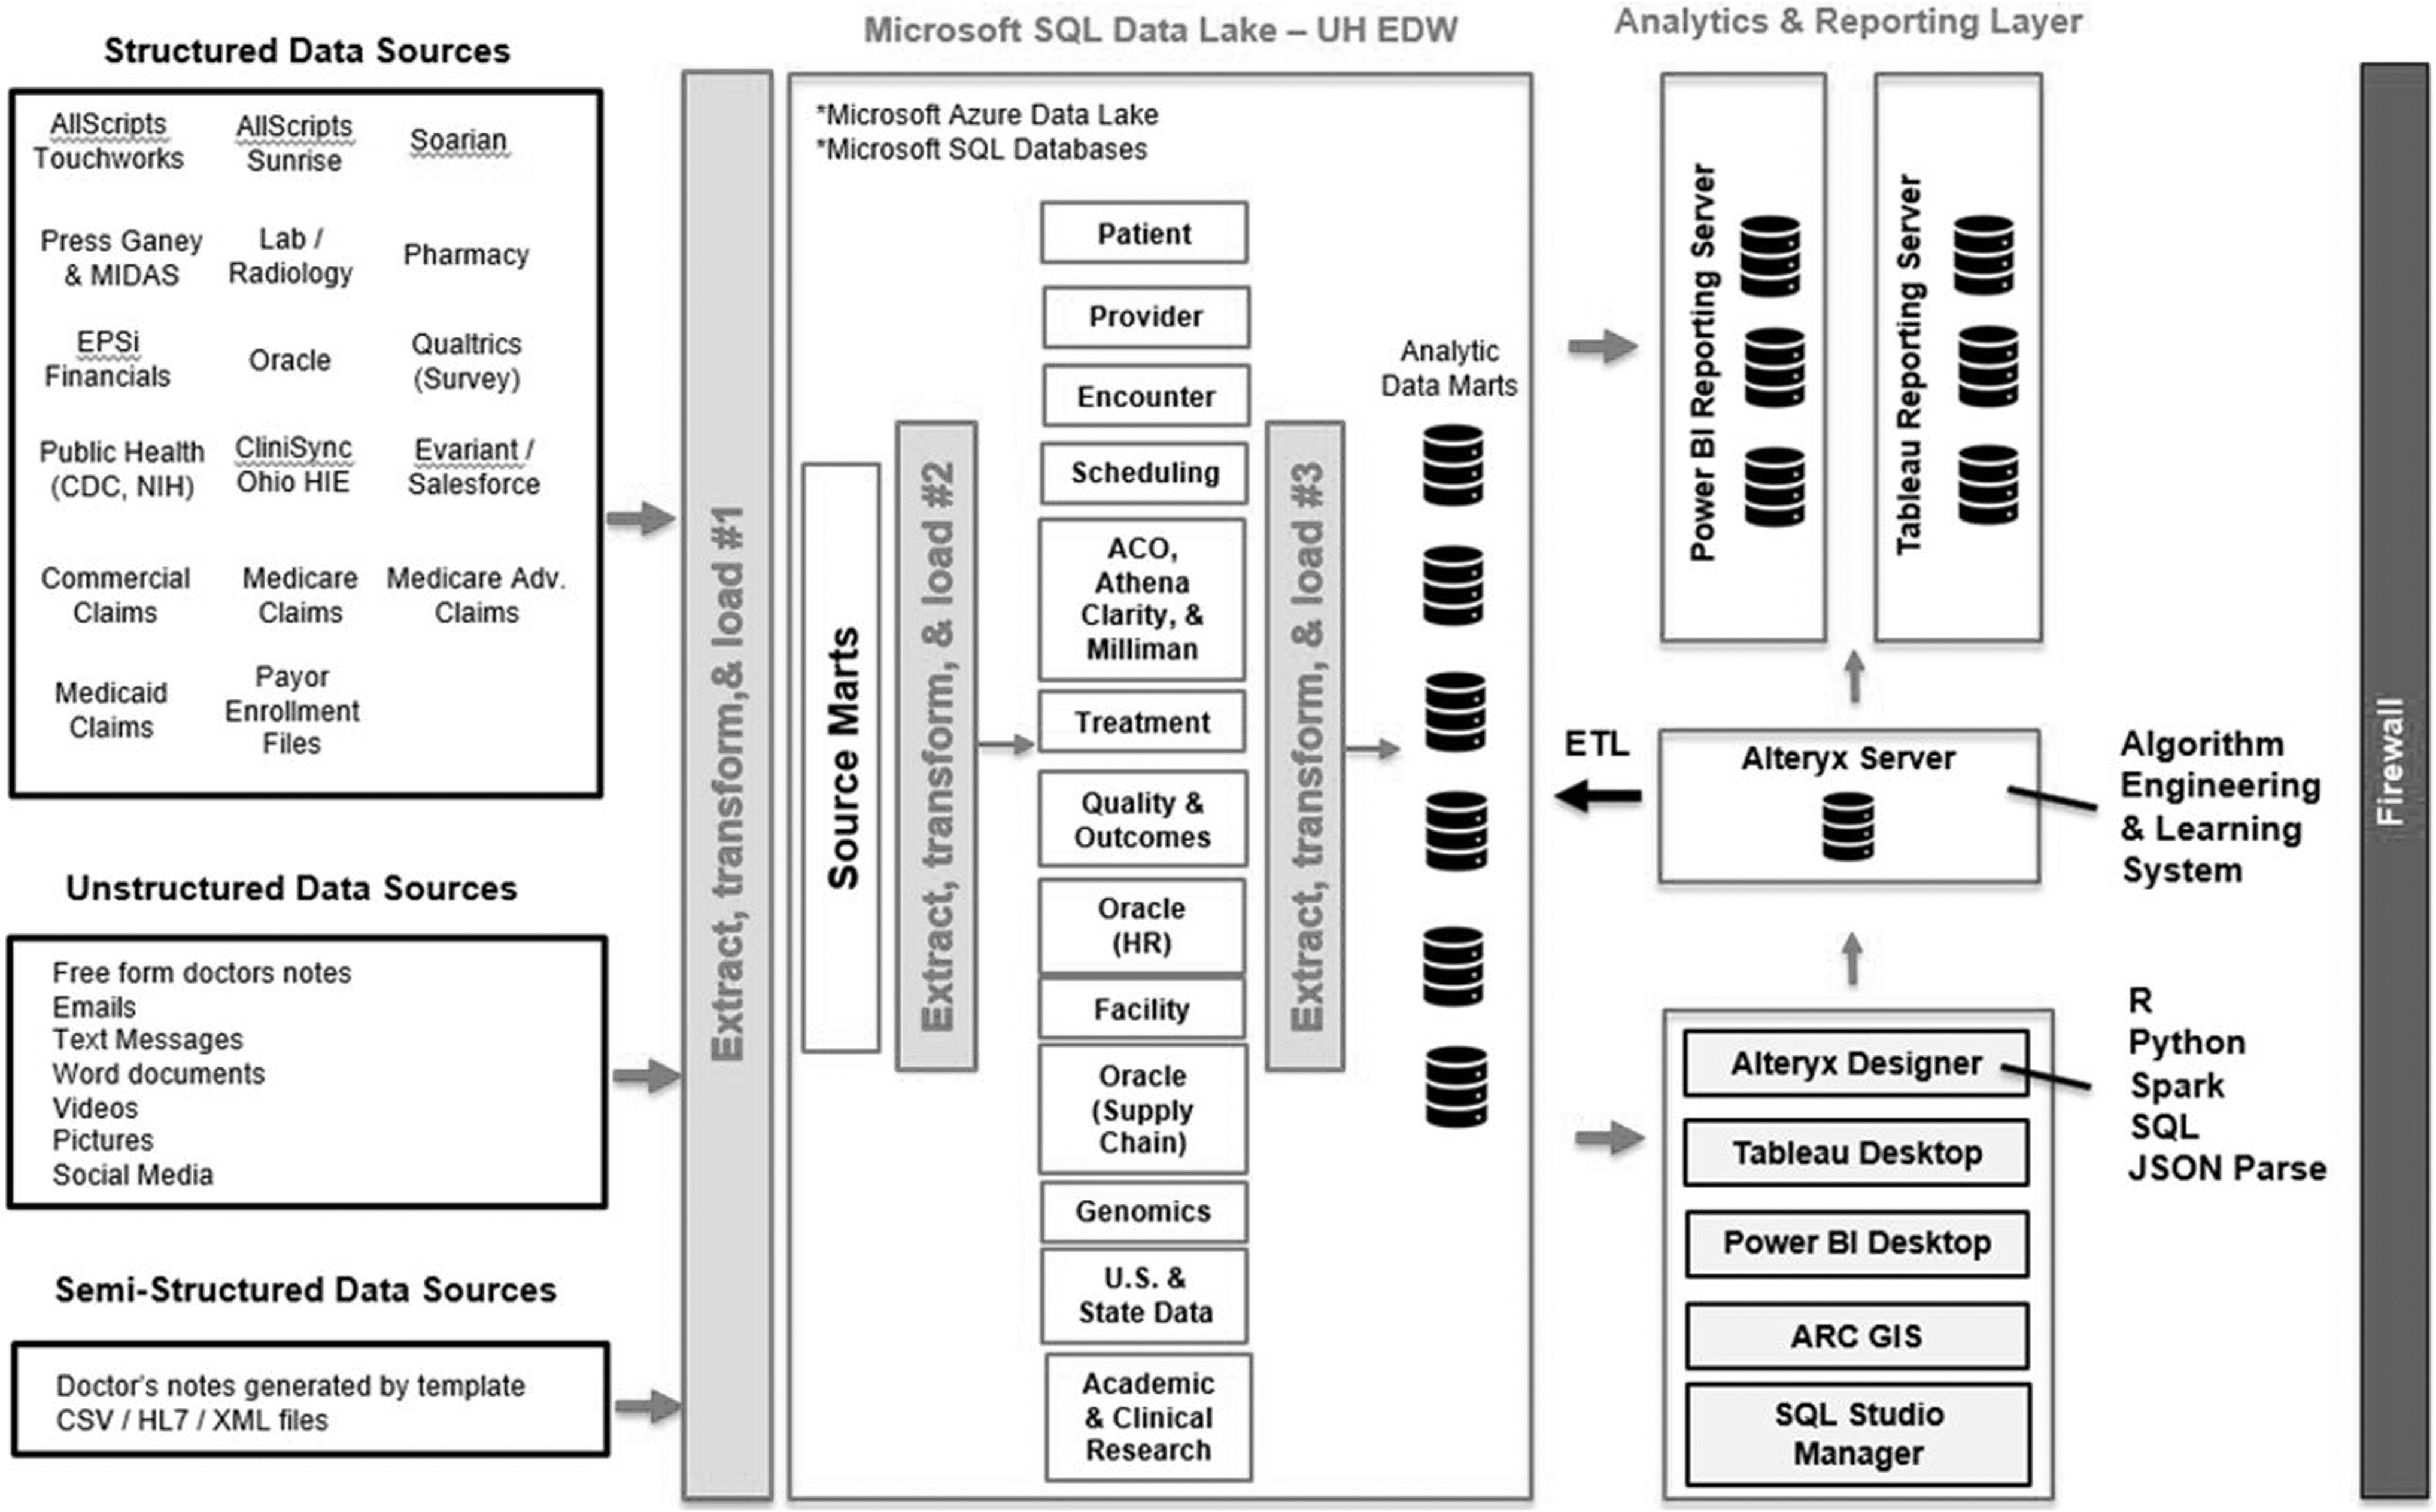
Diagram of enterprise data warehouse and analytics infrastructure. ACO, Accountable Care Organization; CDC, Centers for Disease Control and Prevention; EDW, enterprise data warehouse; HIE, health information exchange; HR, human resources; UH, University Hospitals.
The primary electronic medical record (EMR) system at UH is AllScripts (AllScripts Healthcare, LLC, Chicago, IL), which separates clinical data models into 2 different products: Sunrise (acute care and hospitals) and Touchworks (ambulatory care). Two different data models representing health care encounters is not ideal for analytic product development. Therefore, UH developed its own harmonized data model to solve the disparate data challenge with the EDW. Other systems integrated into the EDW include the laboratory, pharmacy, scheduling, and financial information systems, along with out-of-network data from Ohio's Health Information Exchange, adjudicated claims, insurer member enrollment files, Ohio death records, and social determinants of health data (SDOH) from LexisNexis. Altogether, UH's EDW provides a robust environment and representative data to use for risk stratification algorithm development.
Selecting a patient cohort for stratification
The ACO population of 554,805 was selected because this patient cohort is engaged with UH's primary care network, has the most robust data, and is enrolled in value-based agreements. It is common for this patient cohort to engage the health system for all aspects of their medical care, although some programs may have a share of out-of-network encounters. Using an attributed patient population is important because an ACO receives historical adjudicated claims for each member. This specific claim set includes both allowable medical spend and out-of-network medical encounters. When adjudicated medical spend and out-of-network claims are combined with a provider's in-network patient data, it becomes possible to construct a comprehensive longitudinal patient record within the EDW. An accurate accounting of patient encounters, diagnoses, and spend is key in the development of a stratification algorithm that focuses on both comorbidities and financial spend.
Building from previous indexes and scores
A hybrid risk stratification model was developed using the Minnesota Tiering model as a foundation. The goal was to create a stratification approach that combines comorbidity tiering with allowed medical spend to pair with the clinical management system that governs operations to optimize value-based care across the health system. A 2-step process was developed whereby patients are grouped into 5 categories, identical to the Minnesota Tiering model, based on the number of chronic or cancer-related comorbidities they have in their medical record. Following step 1 of the process, each patient receives a score of 1 (low risk) through 5 (complex risk). Table 1 shows the medical conditions included in the algorithm and in other comorbidity stratification methods such as the Elixhauser and Charlson indexes. A total of 53 conditions are included in step 1 of the categorization process. The algorithm's condition list was vetted by a multidisciplinary team of UH clinicians, scientists, and leaders and optimized based on feedback.
List of Medical Conditions in University Hospitals Risk Stratification Algorithm Versus Elixhauser and Charlson Methods
Not all medical conditions are listed for the UH risk stratification algorithm.
Version 1.0 of the tiering system did not include specific International Classification of Diseases, Tenth Revision codes for coders to follow and instead used categorical condition categories to define the index.
This is the updated Charlson index based on the research of Quan et al. 13
UH, University Hospitals.
The “low risk” or lowest tier of the Minnesota Tiering system includes patients with zero chronic conditions. UH wanted to maintain this categorization strategy following step 2 of the risk stratification algorithm, so patients with zero conditions and no 2020 medical spend (N = 103,234) were categorized in the lowest stratification tier. The score assigned to patients following step 1 is weighted by the last performance year of total allowed medical spend during step 2. Missing financial data in the claims files is imputed from UH financial databases within the EDW environment. The resulting calculated score is sorted in descending order with patients representing the highest spenders and the most comorbid disease burden toward the top of the list. The top 20%–25% of high-utilizers should be represented in the top 3 categories for a 5-category model. This guidance follows an issue brief in which Hall 17 reports that 20% of a provider or health system's patient panel will be responsible for 80% of total health care spending. Therefore, the top 5% of the sorted list was categorized as “complex risk,” and the next 10% as “high risk,” the next 15% as “intermediate risk,” the next 45% as “rising risk,” and any remainder as “low risk” along with the patients who have no spend or medical conditions that qualify within the algorithm.
Analysis plan to examine stratified clusters
Following step 2 of the stratification process, patient clinical and sociodemographic characteristics were compared to test if there were significant differences between them. The prevalence of chronic illness diagnoses and their most frequent combinations were compared. When considering continuous variables, 1-way analysis of variance (ANOVA) tests were performed. Kruskal-Wallis tests were used when considering categorical variables or if the assumptions for ANOVA did not hold, and a chi-square test was used for binary variables. If significant differences in patient characteristics were observed across clusters, further post hoc pairwise tests were completed to detect which cluster was different from the remaining clusters. Multiple 1-way ANOVA comparisons with Bonferroni corrections, Mann-Whitney U tests, and Fisher exact tests were used if ANOVA, Kruskal-Wallis or chi-square tests were used, respectively. All analyses were carried out using Alteryx Designer 2021.1 software (Alteryx Inc., Irvine, CA).
Results
The 2-step hybrid approach produced a 5-category stratification model in which patients with nearly zero documented disease burden and minimal financial spend are represented in the low-risk tier and patients with the most significant disease burden and the majority of financial spend are represented in the complex-risk tier. Table 2 provides demographic characteristics, comorbidity percentages, and 2020 total medical spend by insurance type for attributed patients. Because of the size of the UH patient population, demographic proportions are closely representative of the community throughout Northeast Ohio. Patients with commercial insurance account for 49.3% of the ACO patients, followed by patients in Medicaid (32.1%), and Medicare/Medicare Advantage (18.6%). Medicare patients have a higher per beneficiary per year cost ($7161) versus other cohorts, but commercial patients account for a higher share of total spend ($786,813,392 or 46.2% of total ACO medical spend). The average comorbidity count in Medicare cohorts is 6.2, while commercial cohorts are healthier with an average comorbidity count of 2.2. Both Elixhauser and Charlson index scores follow expected patterns across payor types. The Medicaid cohort at UH is skewed younger and total costs are lower than Medicare and commercial because of the regulatory structure of Medicaid programs.
Characteristics of University Hospitals Accountable Care Organization Population
Patient count includes all ages enrolled in the Accountable Care Organization, ranging from 0–110.
Patients with missing data on race are about 46,225, or less than 11% of the attributed population.
SD, standard deviation.
Patient distribution across clusters following steps 1 and 2 of the stratification process is shown in Table 3. Step 1 of the stratification method mirrors the Minnesota Tiering model, but with the expanded selection of chronic and cancer-related conditions (Table 1). Following step 1 stratification, in which a total of 53 conditions were classified into 5 categories or tiers, patients became sorted by number of conditions and as the categories increased in hierarchy, the number of patients clustered decreased as expected. The bottom 2 tiers (low risk and rising risk) accounted for 72.2% of all patients, while the top 2 tiers (high risk and complex risk) accounted for 11.9% of the patients with the highest disease burden.
Differences between Step 1 and Step 2 Stratification
3760 patients are excluded from the stratification process because of missing data.
The representative features of each cluster are described in Table 4 for steps 1 and 2 of the process. Following step 1 procedures, bivariate and multivariate tests show that there are significant differences (P < 0.001) between numbers of chronic conditions, age, and Elixhauser and Charlson scores across tiers. Agreement in statistical associations was not achieved when examining differences in 2020 total medical spend or in the proportions of coexisting chronic conditions in all subgroups. Middle tiers such as rising risk, intermediate risk, and high risk do not have as much financial variance as expected (ranging from $305M to $362M) and the balance of medical spend across step 1 tiers did not range as expected, with higher financial sums observed in the high-risk group ($305,995,395) when compared with the intermediate risk ($362,489,799) and rising risk tiers ($343,988,489). As a reminder, the goal to optimize care coordination would be to reserve a relationship in which both chronic condition count and total spend increased linearly throughout increasing risk categories.
Population Summary Following Risk Stratification Process
Patient count includes all ages enrolled in the Accountable Care Organization, ranging from 0–110.
Patients with missing data on race are about 46,225, or less than 11% of the attributed population.
COPD, chronic obstructive pulmonary disease; SD, standard deviation.
After step 2 of the stratification process, chronic condition count and 2020 total medical spend were observed with more variance between tiers and hierarchical linear progression as degree of risk increased (P < 0.001). Age increased significantly from one cluster to the next except when rising risk (39.1) was compared to intermediate risk (38.4). Most importantly, the financial weighting process in step 2 led to the complex risk tier representing 5% of the patient population (27,552) and 67.9% or $1,107,822,887 of 2020 total medical spend. The top 2 tiers, complex risk and high risk, account for 15% of the population (82,657) and 83.2% ($1,357,545,872) of spend. Elixhauser and Charlson scores increase significantly across risk categories (P < 0.001), suggesting that risk of hospitalization and potential mortality following an acute event is more prevent in higher risk tiers. Prevalence rates of key chronic conditions increase across risk tiers with the most variance occurring in the top 3 categories.
Table 3 shows the degree of patient movement across risk categories after accounting for medical spend in step 2. Patients without any movement (311,197; 56.5%) included the cohort of patients with zero chronic conditions and zero dollars in medical spend. Approximately 35.3% of patients either increased or decreased their risk category by 1 category, while 6.5% of patients moved categories by a degree of 2. Only 1.6% of patients were observed with an increase or decrease of risk severity by 3 or 4 categories and this indicates that the inclusion of financial spend did not have unintended consequences on how patients were categorized. The 1.6% of patients were further analyzed at the encounter level and common reasons for a 3- or 4-category increase were largely because of cancer-related care where patients were observed with 1 medical condition (eg, cancer malignancy) and high medical spend (eg, ˃$40,000 in 2020).
Overall, the algorithm functions as a classifier and authenticity depends on detecting the class label correctly. In predication, the authenticity depends on how well a given predictor can guess the value of a predicated attribute for new data. To confirm face validity, or the extent to which the algorithm appears to measure what it is intended to measure, a team of providers and scientists were engaged in a chart review exercise and asked to rate their agreement (eg, yes/no) with whether they believed the patients stratified into the top 2 strata were labeled correctly. The team was provided patient identifying information and a random sample was conducted with patients stratified in the top 2 tiers. Reviewers agreed that 98% (P < 0.001) of the sampled cases were classified in the correct top 2 strata. The 2% of discordance was largely related to the belief that those patients should be stratified in the next highest or next lowest category. This exercise, along with the confirmation of increasing Elixhauser and Charlson scores, provides confidence in the 2-step classification algorithm. Because this algorithm is among the first nonproprietary classifiers discussed in publication and incorporates an expanded Minnesota Tiering system to represent disease burden along with total allowed medical spend, the authors are unable to compare additional performance against other similar classifiers.
Discussion
UH seeks to provide the highest value care and continuously improve value. With more than a half million patients to care for, UH recognized the need for efficient risk stratification to identify those patients most in need of care coordination and careful titration of health care utilization to meet their diverse care needs. With a robust enterprise data warehouse, analytic infrastructure, data science leadership, and an integrated population health management framework, UH built and utilized a risk stratification approach to optimize value-based care.
The 5-category risk algorithm was found to be meaningful and impactful after integrating the foundation of the Minnesota Tiering system with an expanded comorbidity list and weighting by previous medical spend. This new stratification technique can identify patients in need of intensive care coordination and, likely, a higher dose of ambulatory care. The complex risk tier of the stratification system reduces the number of patients from 551,045 to 27,552, or 5% of the patient population, and accounts for 67.9% of total annual medical spend. Expanding care coordination efforts to patients in the top 2 tiers would account for 15% of the patients and 83.2% of annual medical spend. The novelty of the new approach allows clinical teams to focus intense resources on a smaller sample of the patient population and identify chronic conditions contributing to costs, and to feel confident that they have greater explanatory power regarding value.
Despite the performance of the model, it is still being evolved. For example, information on SDOH was not included in the model because robust data on SDOH were lacking when the model was developed. These data, purchased from Lexus Nexus, were subsequently incorporated into the EDW and will be included in future models. Within this SDOH data set, the focus will be on the motivation score to better identify patients in need of outreach and the data will be used to help understand the impact of a care coordination program. With the new risk stratification approach, UH is better coupling and personalizing care management efforts with patients' needs. For example, care managers do a holistic evaluation of each high-risk patient's medical, behavioral, social, and personal health habits. Interventions are developed to meet the person's unique needs. In addition, UH continues to use the risk platform in efforts to further improve value, as described in the New England Journal of Medicine Catalyst paper. 3 Finally, the risk models are being used to better learn which care management programs are cost beneficial and effective and for whom. With the data in the models, UH can compare cohorts of similar risk patients and evaluate whether care management programs are effective and why and for whom. Finally, although the model studied people who are currently high spending, an additional model is being developed, using the same approach, to predict which patients will be high spenders next year.
Other models have been interpreted in the context of medical costs, such as the Johns Hopkins ACG System. 18 That model has been in use for more than 30 years and pulls data from EMRs to create a snapshot of patients' future health based on their history, claims, and demographics. Each patient is assigned a score, with the average score for the full population being 1. A patient with a risk score of 0.5 is predicted to cost half of the average, while a patient with a risk score of 4 is predicted to cost 4 times the average patient. The present model performs similarly with the highest risk category (complex risk) indicating that patients in that risk strata have about 4 times more medical spend than the average Medicare patient or 8 times more medical spend than the average commercial patient. However, the present model enables UH to better discriminate and categorize patients with lower retrospective medical costs for the purpose of patient engagement and with the goal to optimize population health management. The focus on the intersection of chronic disease with financial spend has produced a 5-category algorithm that can help segment a large patient population more comprehensively and efficiently when compared to other stratification approaches. Efficiency should not be undervalued in this context because being able to identify a smaller segment of patients who have both high disease burden and high spend allows a department with limited people resources to work smarter across patients who truly need a higher dose of ambulatory care.
Limitations
The risk stratification algorithm was developed and tested at 1 large integrated delivery system that includes large community hospitals and an academic health system in Northeast Ohio. It is possible the results reported in this paper may not be representative of other geographies across the United States. Additional testing is needed by other provider organizations to assess the effectiveness of this process on care coordination and other areas of population health management. Regarding the stratification methodology, the step 1 process was limited to 5 years of claims and EMR International Classification of Diseases, Tenth Revision data when grouping patients. Adding additional years of eligibility to classify medical conditions may provide small improvements to the process. Most chronic conditions included in this study are likely to be reassessed annually, ensuring their inclusion in the algorithm. Another limitation involved the decision to use only 1 year of medical spend data. The medical spend data were from performance year 2020; including more years of spend data or adding prescription cost information could provide additional targeted stratification for patients with lower medical spend but high pharmacy spend, or patients who may use care inconsistently year over year. Finally, the authors recognize that UH has a sophisticated data science team who can build and test these models. Some health systems may lack the human capital to build tools. Although organizations can purchase third-party tools, these are very expensive and lack the flexibility needed to make the information usable by clinicians. In addition, stock reports from third-party vendors often do not meet the needs of care managers. For example, all of the outputs and dashboards from the study system are developed iteratively with UH care managers and leaders.
Future directions
Researchers and provider organizations interested in optimizing value-based care and population health management may be interested in 2 different pathways regarding the new risk stratification process. First, understanding how to make the risk stratification methodology better and then experimenting with different models to address the new information. New statistical experimentation could include machine learning and various types of classification techniques that build on the foundation reported in this article. Including additional sources of information, such as social influencers of health (SIOH), could prove valuable. It is plausible that adding a third step in the stratification process that accounts for SIOH components such as housing risk, food insecurity risk, health literacy risk, or a composite score of SIOH elements such as “motivation to engage” could improve the efficiency of care coordination tactics along with the strategy to distribute limited resources. Second, benefit could be gained from additional understanding of how to best incorporate a value-based stratification algorithm alongside other types of risk segmentation (eg, Framingham Risk Score for cardiovascular disease) or alongside the reporting of key laboratory results such as A1c and glomerular filtration rate results.
Conclusion
The transition toward value-based care provided an opportunity to develop a risk stratification algorithm that combines disease burden and allowable medical cost to inform a care management strategy across UH Health System. This study showed that using a hybrid approach can improve on the distribution of patients across stratification categories versus using a method that is exclusive to comorbidity grouping.
Footnotes
Authors' Contributions
Dr. Coran, Mr. Schario, and Dr. Pronovost participated in the conception or design of the work, drafting the article, critical review and revision of the article, and final approval of the version to be published. In addition, the first author, Dr. Coran, conducted the data collection, data analysis, and data interpretation tasks.
Author Disclosure Statement
The authors declare that there are no conflicts of interest. The findings and conclusions of this study are those of the authors and do not represent any third party opinions.
Funding Information
No funding was received for this article.