




Abstract
Health care providers are increasingly using clinical measures derived from electronic health records (EHRs) for risk stratification and predictive modeling. EHR-specific data elements such as prescriptions, laboratory results, and vital signs have been shown to improve risk prediction models. In this study, the value of EHR-based blood pressure (BP) values was assessed in predicting health care costs (ie, total, medical, and pharmacy) and key utilization end points (ie, hospitalization, emergency department use, and being among the highest utilizers). The study population included 37,451 patients of a large integrated delivery system in the mid-western United States with complete EHR data files, who were 18–64 years old, had continuous insurance at an affiliated health plan, and had eligible BP records. Both EHRs and insurance claims of the study population were used to extract the predictors (ie, demographics, diagnosis, and BP values) and outcomes (ie, costs and utilizations). Predictors were extracted from 2012 data, whereas concurrent and prospective outcomes were extracted from 2012 to 2013 data. Three base models (BMs) were constructed to predict each of the outcomes. The first BM no. 1 used demographics. The second BM no. 2 added the Charlson comorbidity index to BM no. 1, whereas the third BM no. 3 added the Adjusted Clinical Group Dx-PM case-mix score to BM no. 1. BP was specified as means, ranges, and classes. Adding BP ranges to BM no. 1 and BM no. 2 showed the greatest improvements when predicting costs and utilization. More specifically, adjusted R 2 and area under the curve of BM no. 2 improved by 32.9% and 14.1% when BP ranges were added to predict concurrent total cost and hospitalization, respectively. The effect of BP measures on improving the risk stratification models was diminished when predicting prospective outcomes after adding the measures to BM no. 3 (ie, the more comprehensive diagnostic model), specifically when represented as BP means. Given the increasing availability of BP information, this research suggests that these data should be integrated into provider-based population health analytic activities. Future research should focus on subpopulations that benefit the most from incorporating vital signs such as BP measures in risk stratification models.
Introduction
Nearly a third of US
Hypertension is the primary reason for ∼43 million outpatient visits in the United States annually. 7 In 2011, total costs associated with hypertension were estimated at 46 billion US$, which stemmed from health care services, medications, and missed days of work. 8 The annual national medical expenditures associated with hypertension have been significantly increasing over time, 9 where prescription medication costs have been the primary driver. 10
In 2010, the National Academy of Sciences (NAS) recommended that health systems focus on population-based strategies to control hypertension. 11 NAS recommended strengthening hypertension surveillance and monitoring efforts, which would facilitate the determination of hypertension burden, assessment of BP changes over time, and evaluation of interventions. 11
Health systems are increasingly using both administrative claims and electronic health records (EHRs) to identify high-risk patients 12 –19 ; however, EHR-derived vital signs such as BP status are rarely incorporated in risk stratification models that guide population health management efforts. 19,20 Given the total medical expenditure associated with hypertension 9,10 and increased surveillance and availability of BP data on a population level, 11 research is needed to assess the value of BP measures in improving population-based forecasts of costs, inpatient hospitalization, and emergency department (ED) admissions.
Objective
The study objective was to determine whether adding BP markers derived from EHRs improves the performance of predictive models of utilization among individuals receiving ambulatory care. The research team hypothesized that BP risk markers would add value, relative to diagnosis-based risk markers derived from combined claims and structured EHR data, in improving predictive models of costs and utilization.
Methods
Data source
This study used data provided by HealthPartners, Inc., consisting of >1800 physicians practicing in 8 hospitals, 55 primary care clinics, and 22 urgent cares located in Minnesota. HealthPartners provides medical services and health plan financing and administration to 1.8+ million enrollees. 21
The study included structured EHR data, medical claims, and pharmacy claims. EHR data captured complete outpatient information within the HealthPartners' network, but excluded information derived from inpatient encounters or those occurring outside of the network. BP records were derived from EHR data, whereas claims data contained demographics (eg, age and gender), diagnosis codes documented as the International Classification of Disease, Ninth Revision, Clinical Modification (ICD-9-CM codes), prescriptions as National Drug Code, date of services, paid amount by plan, and out-of-pocket amount by individuals.
Study design and subjects
This study is a 2-year retrospective cohort study (2012–2013). BP measures and control variables were derived from 2012 data, whereas outcomes of interest were constructed from 2012 and 2013 data.
The data preparation process started with 1,408,914 nonmissing BP records, but excluded (1) 872 records with SYS BP <70 or >250 22,23 ; (2) 16,596 records with DIA BP <45 or >150 22,23 ; (3) 5897 records with SYS/DIA BP <1.0625 + 0.00125*DIA or >3.0 22,23 ; (4) 3399 records with positions of measure not captured as “default” or “sitting”; (5) 589 records with site of measure not listed as “default,” “left arm” or “right arm”; and (6) 733,116 records not dated within 2012. The remaining 666,460 eligible BP measures were summarized by calculating the mean value of all records from the same date for each subject resulting in 329,964 daily BP measures (Fig. 1).
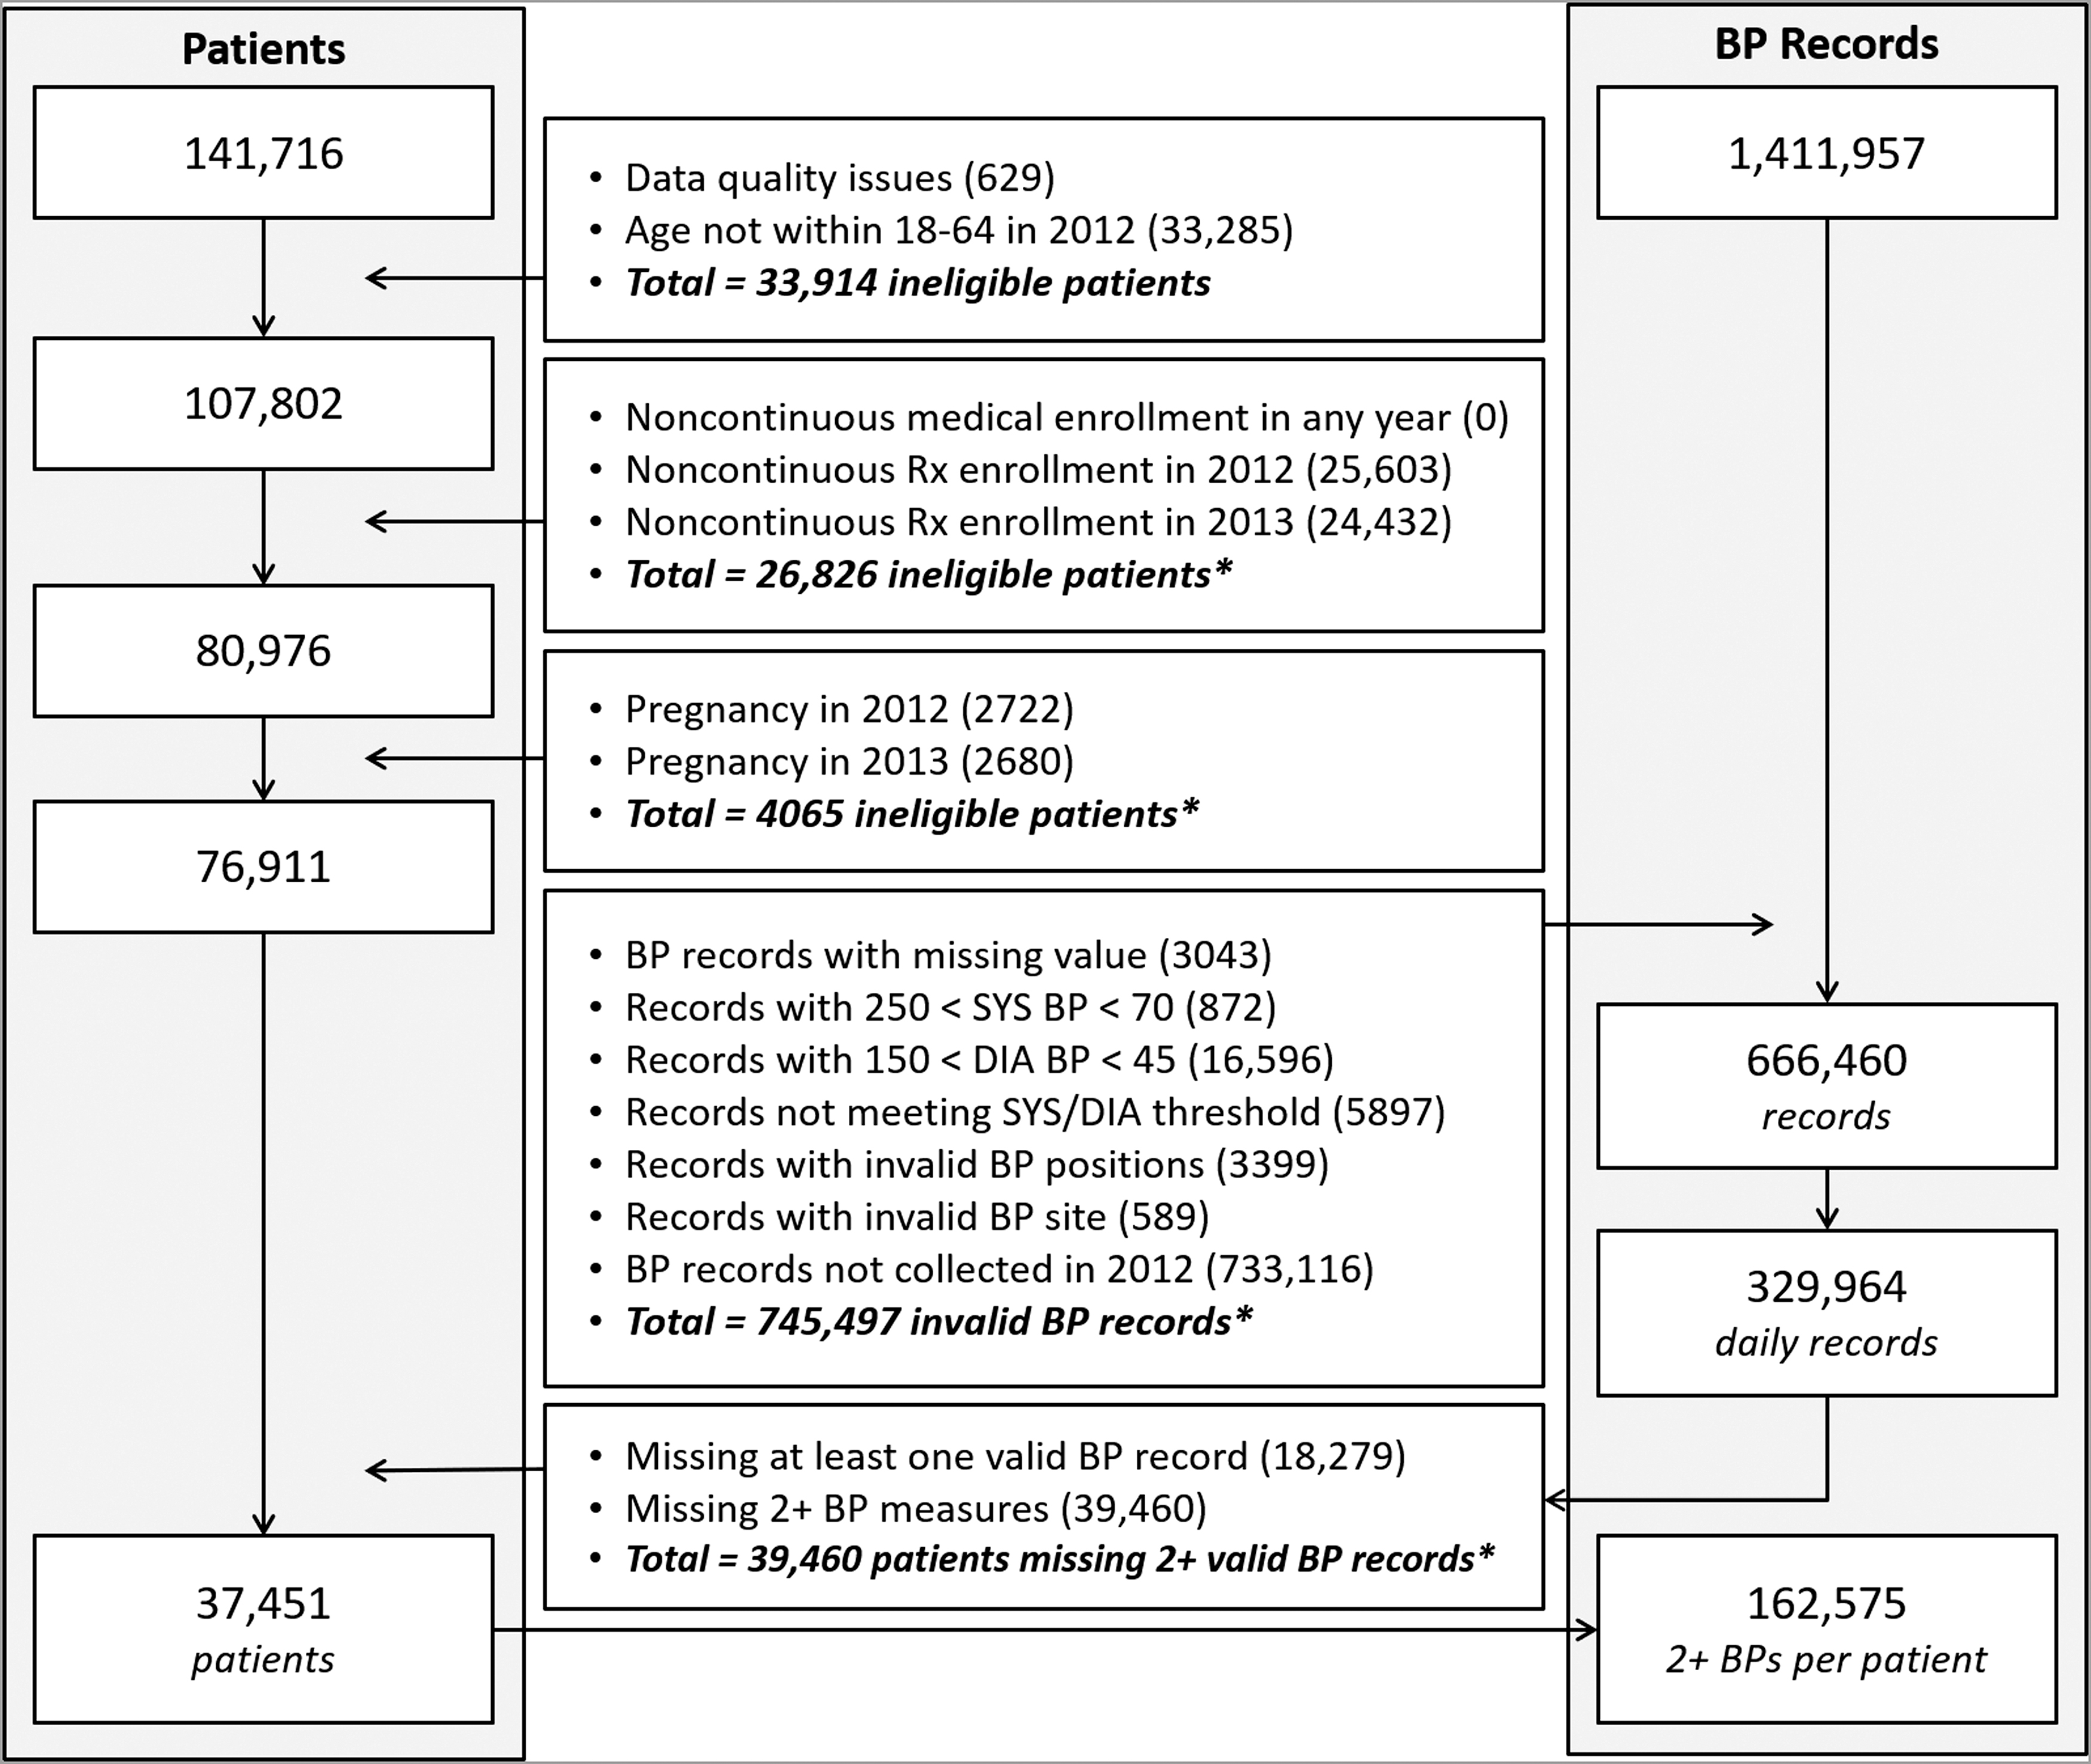
Denominator selection process (left: patients; right: BP records). *Totals are not equal to the sum of individual criteria as exclusions overlapped.
The study further excluded patients if they were not between 18 and 64 years old, had a pregnancy, or had incomplete data. Patients <18 years old were excluded as BP measurement and its effect on utilization in children are different than those in adults. 1,6,8 Patients >64 years old were excluded as Medicare claims data were not available in this study. Patients with pregnancies were excluded as health care utilization among those patients is often not due to comorbidities, and risk stratification studies recommend excluding deliveries in utilization predictions. 24,25 Hence, among 141,716 members with an EHR, the following members were excluded: (1) 629 members with data quality issues (eg, unmatched age and gender between EHRs and claims); (2) 33,285 subjects who were not 18 to 64 years old in 2012; (3) 26,826 subjects without continuous pharmacy enrollment in 2012 or 2013, and 0 subjects with noncontinuous medical enrollment; (4) 4065 subjects with pregnancy in 2012 or 2013; and (5) 39,460 patients lacking at least 2 valid BP records. The final study population included 37,451 eligible subjects associated with 162,575 BP measures (Fig. 1).
Independent variables
Four sets of yearly BP measures were generated: (1) mean SYS+mean DIA: the sum of SYS and DIA means for every individual was derived using 2012 records; (2) BP class: using the mean SYS and DIA values, individuals were classified into 1 of 4 classes of BP: normal, elevated, stage 1, and stage 2+ (ie, merged crisis level with stage 2) 26 ; (3) range of SYS and DIA: the range of SYS and DIA (maximum–minimum) was calculated for each patient across entire records in 2012; and (4) BP class range: calculated the range of changes for the BP class (ie, ranging from 0 to 3 classes; 0 representing normal with no changes).
The values of the 4 BP-derived measures were assessed for predicting utilization by adding them to multiple “base” risk stratification models. For each base model (BM), the performances of the following combinations were compared: (1) BM only, (2) BM plus the means of SYS and DIA, (3) BM plus the BP class, (4) BM plus the range of SYS and DIA, and (5) BM plus the range of BP class.
Information derived from 2012 health plan claims for each member of the study group was used to build 3 sets of base predictive models: (1) BM no. 1: BM consisting of gender and age groups (ie, 18–34, 35–44, 45–54 and 55–64 years); (2) BM no. 2: BM including the Charlson comorbidity index 27 in addition to the BM no. 1's variables; and (3) BM no. 3: BM including diagnosis-based predicted scores (Dx-PM score) 28 plus variables used in BM no. 1. The Dx-PM score makes use of the full range of available ICD codes to categorize all morbidities. It is a component of the widely used Johns Hopkins Adjusted Clinical Group (ACG) risk adjustment system. 28 The Dx-PM score has been shown to be a valid measure of morbidity in several studies. 24,25
Outcome variables
Three types of costs (ie, annual, medical, and pharmacy costs) and 3 binary utilization indicators (ie, any hospitalization [excluding deliveries], ED visit, and being in the subgroup with the highest 5% of total costs) were calculated separately in the concurrent (2012) and prospective (2013) years. Annual cost was the sum of paid and out-of-pocket amount derived from medical only, pharmacy only, or all claims. Costs were truncated at the top 0.5% as cost is highly skewed. 28 Outcome flags were also generated for being in the top 5% of cost, having any hospitalization, and having any ED visit in each period.
Statistical methods
Descriptive characteristics of study subjects, including age, gender, baseline morbidity, and medical utilization, were calculated in total and by 4 BP classes separately.
The impact of adding 4 sets of BP-derived variables was evaluated on the performance of 3 BMs (ie, BM no. 1, BM no. 2, and BM no. 3) in explaining costs and utilization. Linear regression was used to explain/predict costs as linear regression is considered the standard approach in risk adjustment studies. 28,29 Logistic regression was used to predict binary utilization outcomes such as any hospitalization, any ED admission, and being in the top 5% of total cost. The outcomes from the base year (2012) were used in the concurrent prediction and the subsequent year (2013) were used in the prospective analysis.
The performance measure for linear regression models included adjusted R 2 and mean absolute prediction error (MAPE). 30 The adjusted-R 2 measurement was used, instead of R 2, as the adjusted-R 2 measurement considers the number of variables included in the model in calculating the performance measurement, hence will not be inflated by adding additional variables to a model. MAPE is the average absolute difference between the predicted and the actual value across all subjects. MAPE of different types of costs is divided by their respective means so that results could be compared across various types of costs. In contrast to adjusted R 2, MAPE is more resilient to outliers. 30 The performance of the logistic regressions was presented by the area under the curve (AUC) measure.
A bootstrap analysis of 300 runs was performed to provide point estimate and 95% confidence intervals (CIs) for all performance measures, including adjusted R 2, MAPE, and AUC. Statistical significance at a 0.05 cutoff was determined when the BM's point performance measure was not contained in the 95% CI performance measure of the BM after adding a BP variable to the model. 31
The institutional review board of Johns Hopkins Bloomberg School of Public Health approved this study.
Results
Population specifications
Out of the 37,451 patients, 41.7% had normal BP levels, whereas 17.0%, 27.7%, and 13.5% were in elevated, stage 1, and stage 2 BP classes (Table 1). Average age was higher in elevated BP classes, ranging from 42.2 years of age for the normal BP class to 50.2 years for stage 2 BP class. Overall, the percentage of female population was 60.9% in the study population, with higher rates in lower BP classes (eg, 73.7% in the normal BP class). Mean SYS and DIA BPs were 122.4 and 76.0 mmHg for the total population. The lowest SYS and DIA means were observed in the normal class (110.1 and 69.0), whereas the highest means were measured in the stage 2 class (144.9 and 89.1).
Study Population Specifications, Utilizations, and Costs in 2012
Stage 1: SYS BP 130–139 mmHg or DIA BP 80–89 mmHg; stage 2 (or higher): SYS or DIA BP higher than stage 1 thresholds.
Percentage, mean, and SD are calculated using the corresponding BP class denominators.
ACG Dx-PM case-mix score.
Truncated at top 0.5% of total cost.
ACG, Adjusted Clinical Group; BP, blood pressure; DIA, diastolic; ED, emergency department; SYS, systolic.
Patients in the higher BP classes had higher number of chronic conditions (eg, 2.88 conditions in stage 2 vs. 2.00 for the normal class) and were using higher number of medications (ie, count of medication ingredients was ∼20% higher in stage 2 than the normal class). In general, higher BP classes had a higher rate of select chronic conditions (eg, type 2 diabetes and congestive heart failure), except for acute myocardial infarction that was highest in the elevated BP class.
Inpatient hospitalization, ED admissions, and being in the top 5% of the cost had slightly additional per-person rates in higher BP classes (eg, 0.17 any ED admissions for stage 2 vs. 0.14 for the normal group); however, outpatient visits were most frequent in the elevated BP group. A statistical comparison using P-values generated P-values <0.001 for all utilization group comparisons; however, due to the considerably large size of the denominator in each BP group, P-values are deemed challenging to interpret for group comparison analysis. 32
Impact of adding BP measures on the adjusted R 2 of costs
Overall, both concurrent and prospective adjusted R 2 increased with statistical significance when the complexity of the BMs increased from BM no. 1 to BM no. 2, and to BM no. 3 (Table 2). For example, the adjusted R 2 of concurrent total cost among BMs increased from 1.76 (95% CI 1.52–2.01) for BM no. 1 to 17.70 (15.98–19.37) for BM no. 2 and to 48.75 (46.83–50.71) for BM no. 3. The same trend was observed among BMs with comparable added BP variables. For example, among BMs that included the BP class range as a predictor, the adjusted R 2 of concurrent total cost increased from 6.45 (6.01–6.92) for BM no. 1 to 20.21 (18.71–21.83) for BM no. 2 and to 49.36 (47.44–51.34) for BM no. 3 (Table 2).
Impact of Blood Pressure Measures in Predicting Medical, Pharmacy, and Total Costs (Adjusted R 2)
Adjusted-R 2 (95% CI) was generated using 300 bootstrapping runs, and cost was truncated at top 0.5% of total cost.
ACG, Adjusted Clinical Group; BM, base model; BP, blood pressure; CI, confidence interval; DIA, diastolic; SYS, systolic.
Adding the BP ranges, either the SYS and DIA range or the BP class range generally generated statistically significantly higher adjusted R 2, especially when predicting total and medical costs (Table 2). For example, adding the SYS and DIA ranges to BM no. 2 statistically significantly increased the adjusted R 2 of predicting concurrent total cost from 17.70 (15.98–19.37) to 23.53 (21.96–25.19), which is a 32.9% increase in performance. However, adding the SYS and DIA means to BM no. 2 only increased the adjusted R 2 to 17.76 (16.02–19.41), which was an insignificant improvement for BM no. 2's predictive power (Table 2).
The effect of BP range variables in increasing the adjusted R 2 declined when predicting prospective costs. For example, adding the SYS and DIA ranges to BM no. 2 improved the adjusted R 2 of predicting prospective total cost from 11.20 (10.09–12.33) to 12.71 (11.50–13.88), which is a 13.4% improvement in predicting prospective cost, but markedly lower than the 32.9% improvement of the concurrent total cost prediction. Adding the SYS and DIA means to BM no. 2 showed no significant improvement in adjusted R 2 when predicting prospective costs (Table 2).
The effect of BP range variables in increasing the adjusted R 2 also declined when the complexity of the BMs increased. As an instance, adding the SYS and DIA ranges to BM no. 3 only increased the adjusted R 2 of concurrent total cost by 2.8%, which is considerably <32.9% improvement of BM no. 2 when adding the same BP variables. The improvement of BM no. 3's adjusted R 2 in predicting prospective costs was negligible when adding any types of the BP variables (ie, BP means, ranges, or classes; Table 2).
Impact of adding BP measures on the MAPE of costs
Similar to the trend of the adjusted R 2 rates, but with an inverse direction, the concurrent and prospective MAPE values decreased as the complexity of the BMs increased from BM no. 1 to BM no. 3 (Table 3). For example, the concurrent MAPE of predicting total cost among BMs statistically significantly decreased from 98.33 (97.41–99.09) for BM no. 1 to 88.69 (87.73–89.58) for BM no. 2 and to 64.06 (63.19–64.98) for BM no. 3. The same pattern was identified within the same sets of BP variables across the BMs. For instance, among BMs that included the BP class range as a predictor, the MAPE of predicting concurrent total cost decreased from 94.60 (93.67–95.42) for BM no. 1 to 86.66 (85.87–87.53) for BM no. 2 and to 64.24 (63.37–65.05) for BM no. 3 (Table 3).
Impact of Blood Pressure Measures in Predicting Medical, Pharmacy, and Total Costs (Mean Absolute Prediction Error)
MAPE (95% CI) was generated using 300 bootstrap runs, and cost was truncated at top 0.5% of total cost.
ACG, Adjusted Clinical Group; BM, base model; BP, blood pressure; CI, confidence interval; DIA, diastolic; MAPE, mean absolute prediction error; SYS, systolic.
Adding the BP ranges often generated lower MAPE in predicting concurrent costs, but such improvement in MAPE was reduced when predicting prospective costs (Table 3). For example, adding the SYS and DIA ranges statistically significantly decreased MAPE of predicting concurrent total cost from 88.69 (87.73–89.56) to 84.84 (83.94–85.64) in BM no. 2. The impact of the SYS and DIA ranges on predicting prospective total cost was much smaller with MAPE decreasing from 98.12 (97.23–99.05) to 96.73 (95.86–97.62) in BM no. 2 (Table 3).
Despite the effect of the SYS and DIA ranges in reducing MAPE in BM no. 2, including the SYS and DIA means to BM no. 2 did not statistically significantly decrease MAPE in predicting either concurrent or prospective costs. Indeed, adding SYS and DIA averages slightly increased MAPE in most predictions when added to BM no. 2 (Table 3).
None of the BP variables statistically significantly reduced MAPE for either concurrent or prospective costs when added to BM no. 3. Adding BP range variables (ie, the SYS and DIA ranges, or the BP class range) to BM no. 3 increased MAPE of concurrent total cost and decreased that of prospective total cost; however, none was statistically significant. Adding BP mean variables (ie, the SYS and DIA means, or the BP class) minimally changed MAPE with none being statistically significant (Table 3).
Impact of adding BP measures on the AUC of utilization
The AUC of BMs in predicting utilization outcomes (eg, hospitalization) increased after including the Charlson and ACG Dx-PM comorbidity scores in BM no. 2 and BM no. 3, respectively (Table 4). For example, the concurrent AUC of being in the top 5% of total cost statistically significantly increased from 0.613 (0.601–0.625) in BM no. 1 to 0.751 (0.738–0.763) in BM no. 2 and to 0.936 (0.931–0.941) in BM no. 3. The same trend was observed among BMs with similar added BP variables. For example, among BMs that included the BP class range as a predictor, the AUC of predicting the top 5% status increased from 0.723 (0.710–0.733) for BM no. 1 to 0.790 (0.779–0.800) for BM no. 2 and to 0.932 (0.927–0.937) for BM no. 3 (Table 4).
Impact of Blood Pressure Measures in Predicting Inpatient and Emergency Department Utilizations (Area Under the Curve)
AUC (95% CI) was generated using 300 bootstrap runs, and cost was truncated at top 0.5% of total cost.
ACG, Adjusted Clinical Group; BM, base model; BP, blood pressure; CI, confidence interval; DIA, diastolic; ED, emergency department; SYS, systolic; IP, inpatient hospitalization; Top 5%, being in the top 5% of total use.
Adding the SYS and DIA ranges to BM no. 2 generated the highest increase in AUC of predicting any of the concurrent and prospective utilization markers (ie, any hospitalization, any ED admission, and being in the top 5% of total cost). For example, adding the SYS and DIA ranges increased AUC of predicting concurrent hospitalization from 0.693 (0.682–0.703) to 0.788 (0.778–0.798) in BM no. 2, which represents a 14.1% improvement in model performance. The impact of the SYS and DIA ranges on predicting prospective hospitalization was smaller with AUC increasing from 0.656 (0.644–0.671) to 0.685 (0.672–0.698) in BM no. 2 (Table 4).
Adding the BP ranges (ie, SYS and DIA ranges, and BP class range) to BM no. 3 statistically significantly improved the prediction of concurrent ED admissions. For example, the AUC of BM no. 3 improved from 0.650 (0.642–0.658) to 0.681 (0.673–0.689) after adding the SYS and DIA ranges to predict concurrent ED admissions. BP ranges, however, did not statistically significantly improve the AUC of the BM no. 3 to predict other utilization outcomes such as hospitalization or being in the top 5% of total cost. SYS and DIA averages and BP class did not improve the BM no. 3 AUC for any of the utilization outcomes, neither concurrent nor prospective (Table 4).
See the online (Supplementary Tables S1–S3) for a summary of ratio improvements of all performance measures (ie, adjusted R 2, MAPE, and AUC) across all BMs (ie, BM no. 1, BM no. 2, and BM no. 3) and outcomes (ie, concurrent and prospective costs and utilizations).
Discussion
Health care providers are increasingly using EHR data, instead of or in conjunction with insurance claims data, to identify and manage high-risk patients. 19 Prior research has shown the value of unique EHR data fields, not found in routine insurance claims data, that can improve the risk stratification and predictive models of health care utilization. 16 For example, past studies have shown the value of EHR's prescription information, 14,18,33,34 EHR's laboratory results, 13 EHR's unstructured data such as clinical notes, 15,35,36 and EHR's vital signs such as body mass index (BMI), 17 in improving the overall prediction of health care costs and utilization. Despite the prevalence of hypertension, BP has not been assessed as a unique EHR data type in improving the risk stratification process. To address this gap, this study aimed to determine whether adding BP markers improves the performance of predictive models of cost or utilization among patients receiving ambulatory care.
The study results show that BP variables can improve common risk prediction models of health care utilization and cost (Tables 1–3). The added value of BP variables, however, was diminished with more sophisticated prediction models such as the ACG Dx-PM-based model (ie, BM no. 3). BM no. 1 showed the highest gain after adding BP variables, with some BP variables improving the prediction of concurrent total cost (ie, adjusted R 2) by ∼6-folds, and improving the prediction of concurrent inpatient admission (ie, AUC) by 29%. BM no. 2, which includes the Charlson comorbidity index, also showed benefiting from the BP variables; however, the gains were smaller than BM no. 1. Some of the BP variables improved the prediction of concurrent total costs (ie, adjusted R 2) by ∼33% in BM no. 2, while improving the prediction of concurrent hospitalization (ie, AUC) by 14%. These improvements were generally smaller in prediction prospective costs and utilizations. See the online supplemental material (Supplementary Tables S1–S3) for a ratio-based summary of added value of BP variables in improving the performance of the base risk prediction models.
In this study, the added value of BP variables in predicting health care utilization varied depending on the statistical approach used to summarize them in the specified timeframe. The results suggest that measurements that depict the variation of BP annually (eg, SYS and DIA ranges, or BP class ranges) can improve the common utilization prediction models considerably more than measurements that simply represent the overall status of BP (eg, SYS and DIA means, or BP class). The insignificance of BP means in improving the predictive powers of BM no. 2 or BM no. 3 may be due to the presence of the hypertension diagnosis in the common comorbidity scores, which highly correlates with BP means. 1,5,6 Conversely, the significance of BP ranges in improving the base predictive models may represent a different concept of BP measurement not already captured by the diagnosis of hypertension. Indeed, the BP ranges provide a measure to capture fluctuations in BP within a specific timeframe that may hint an uncontrolled BP status regardless of the diagnosis of hypertension, hence providing an added value in improving diagnosis-based predictive models of utilization and cost.
Past studies have mainly focused on assessing the added value of vital signs in improving the prediction of short-term clinical outcomes. 37 The study team found only 1 study that has explored the use of vital signs (ie, BMI) in predicting annual health care cost and utilization. 17 The study found that adding BMI levels to a BM that includes the Charlson index improved the prediction (adjusted R 2) of concurrent and prospective total costs by 4.02% and 13.24%, with the latter being a statistically significant improvement. In contrast, this study found that BP ranges result in higher rates of improvement in adjusted R 2 for predicting concurrent and prospective total costs (13.48% and 32.89%, respectively), with both being a statistically significant increase from the BM that includes the Charlson index (ie, BM no. 2). Nevertheless, when comparing BP ranges with BMI levels, assessing the higher rates of improvement in adjusted R 2 is inconclusive as the underlying population of the BMI study differs from that of this study. Future studies should investigate the value of BP data versus or in combination with BMI data in improving risk stratification models using the same population of patients. Future research should also explore the use of ranges, instead of groups, levels, or means, for assessing the value of vital signs such as BMI in predicting health care utilization and cost.
The added value of BP ranges (ie, SYS and DIA ranges and BP class ranges) was considerable for BM no. 1, which only includes demographic information in the BM. This has significant implications for nontraditional settings to risk stratify newly enrolled patients and/or when clinical data such as diagnostic data are not readily available. For example, among newly enrolled patients of a telemonitoring program, clinical data may not be available at start, hence the vital signs (eg, BP) that are captured through the telemonitoring program can play a key role to improve the risk stratification of such patients. Another example is using the enhanced BM no. 1 (with BP ranges) in consumer health IT products that capture vital signs using mobile health solutions. Diagnostic data are often incomplete in such consumer health IT solutions, hence the addition of vital signs such as BP can greatly enhance risk stratification efforts for consumers.
Future studies should explore the value of BP measures in improving the predictive models of health care utilization in other population groups (eg, children and older adults) and different clinical settings (eg, inpatient and nursing home). Future research should also examine the simultaneous use of different vital signs, and their interactions, in improving the prediction of health care utilization and cost. Other potential research topics may include studying vital signs within different/shorter timeframes (eg, months instead of years), assessing the correlation of vital signs and missing rate of related diagnosis (eg, BP variables vs. completeness of hypertension diagnosis), and identifying subpopulations who will benefit the most from incorporating vital signs for risk stratification and case management purposes. In addition, as EHR data are becoming more standard for provider-based population health management, vital signs such as BP can be used for various population level management purposes beyond the predictive modeling. And, as providers are increasingly capturing data on social determinants of health in EHRs, 38,39 future research should also assess the potential disparities in using vital signs to improve risk stratification efforts among minority and vulnerable populations.
Limitations
This study has several limitations. First, the study population was limited to 18–64 years old patients. This was mainly due to the different effect of BP on utilization in the pediatric population and missing Medicare data in this study. Second, this study only focused on patients visiting ambulatory outpatient settings. The effect of BP on risk prediction may be different in other clinical settings, hence the generalizability of the study results should be assessed before adopting BP measures to improve risk stratification models in practice. Third, patients who missed the minimum data quality requirements (eg, missing BP data) were excluded in this study. Future studies should examine the underlying differences in utilization among patients without BP records and populations with BP data (eg, patients with no BP data may include more high utilizers). Fourth, the BP data used in this study were limited to data extracted from a single health provider EHR system. BP data captured and recorded in EHRs of providers practicing out of this health network may provide additional information. Future research should explore the value of EHR interoperability in improving the completeness of vital sign data for population health management. Finally, this study only assessed the value of BP data in BMs using the traditional linear and logistic regressions. The values of BP and other vital signs are yet to be measured when incorporated in nontraditional risk stratification approaches such as machine learning methods. 40
Conclusion
Adding BP measures to utilization prediction models improves their ability to predict health care costs and utilization; however, the added values of BP measures are attenuated when the base risk stratification models incorporate diagnosis-based comorbidity indexes. The values of BP measures are most prominent when represented as BP ranges in predicting concurrent costs and utilizations (eg, hospitalization and ED admission). Future research on risk stratification models should focus on subpopulations that benefit the most from incorporating vital signs such as BP measures in risk prediction and case management efforts.
Footnotes
Acknowledgments
The authors acknowledge the support of HealthPartners, Inc., (Bloomington, MN) in sharing the underlying data and providing the research team with technical support throughout the research. The authors also acknowledge the technical and management support provided by other Johns Hopkins team members (Tom Richards, Fardad Gharghabi [deceased], and Elyse Lasser).
Authors' Contributions
Dr. Kharrazi served as the principal investigator of the project. Dr. Kharrazi and Dr. Chang designed the study and selected the appropriate methodology for the evaluation. Dr. Chang and Dr. Kharrazi performed the analysis. All authors (ie, Dr. Kharrazi, Dr. Chang, Dr. Weiner, and Dr. Gudzune) reviewed the results and contributed to the interpretation of the results. Dr. Kharrazi and Dr. Chang drafted the article. All authors (ie, Dr. Kharrazi, Dr. Chang, Dr. Weiner, and Dr. Gudzune) reviewed the article before submission.
Author Disclosure Statement
No competing financial interests exist.
Funding Information
No external funding supported this study. All authors are Johns Hopkins employees. The Johns Hopkins University receives royalties for nonacademic use of software based on the Johns Hopkins Adjusted Clinical Group (ACG) methodology.
Supplementary Material
Supplementary Table S1
Supplementary Table S2
Supplementary Table S3
References
Supplementary Material
Please find the following supplemental material available below.
For Open Access articles published under a Creative Commons License, all supplemental material carries the same license as the article it is associated with.
For non-Open Access articles published, all supplemental material carries a non-exclusive license, and permission requests for re-use of supplemental material or any part of supplemental material shall be sent directly to the copyright owner as specified in the copyright notice associated with the article.
