




Abstract
Frameworks for identifying and assessing social determinants of health (SDOH) are effective for developing long-term societal policies to promote health and well-being, but may be less applicable in clinical settings. The authors compared the relative contribution of a specific set of SDOH indicators with several measures of health status among patients served by health centers (HCs). The 2014 Health Center Patient Survey was used to identify a sample of HC patient adults 18 years and older that reported the HC as their usual source of care (n = 5024). The authors examined the relationship between SDOH indicators organized in categories (health behaviors, access and utilization, social factors, economic factors, quality of care, physical environment) with health status measures (fair or poor health, diabetes, hypertension, cardiovascular disease, depression, or anxiety) using logistic regressions and predicted probabilities. Findings indicated that access to care and utilization indicators had the greatest relative contribution to all health status measures, but the relative contribution of other SDOH indicators varied. For example, access indicators had the highest predicted probability in the model with fair or poor health as the dependent variable (72.4%) and the model with hypertension as the dependent variable (47.4%). However, the second highest predicted probability was for social indicators (54.1%) in the former model and physical environment (44.7%) indicators in the latter model. These findings have implications for HCs that serve as the primary point of access to medical care in underserved communities and to mitigate SDOH particularly for patients with diabetes, depression, or anxiety.
Introduction
It has long been acknowledged that health care is but one contributing factor to health status, and other individual or contextual factors called social determinants of health (SDOH) also play a role. 1 The World Health Organization has defined SDOH as “conditions in the environments in which people are born, live, learn, work, play, worship, and age that affect a wide range of health, functioning, and quality of life outcomes and risks.” 2 Multiple frameworks for assessing SDOH are available and they vary in what indicators are considered as SDOH and how health indicators are measured. 3 –5
A widely used model used by Centers for Disease Control and Prevention is the Healthy People 2020 (HP2020), which has identified 5 key SDOH domains: economic stability, education, social and community context, health and health care, and neighborhood and built environment. 6 Another widely used model for the assessment of the role of SDOH in health status is the County Health Rankings and Roadmaps, which uses concepts that are consistent with HP2020. 7 Both models focus on distal or contextual and proximal or individual conditions that lead to poor health and are important in developing policies and interventions that promote population health in the short term and across the life span.
The County Health Rankings model goes further by attributing relative values to the impact of each SDOH category including health behaviors (30%), clinical care (20%), social and economic factors (40%), and physical environment (10%). 7,8 Both approaches are effective for developing long-term societal policies to promote health and well-being but these approaches may be less applicable in the clinical setting.
In clinical settings, health care providers are increasingly held accountable for health outcomes even though clinical care is just one of a range of factors that contribute to health. 3 Providers are required to manage population health through screening patients for risk and delivering interventions based on risk level with the goals of improving quality of care and health outcomes while reducing costs. 9 However, it has become apparent that improving outcomes without addressing the underlying causes of poor health is challenging since SDOH can impede the effectiveness of the health care delivered. 1 In clinical settings, addressing SDOH requires adoption of approaches by providers that effectively improve health in real time. 1,6,7
For many providers, addressing SDOH falls outside their areas of focus and strength, with the exception of some safety net providers such as health centers (HCs) funded by the Health Resources and Services Administration (HRSA). HCs are significant safety-net providers and delivered care to nearly 30 million people across the United States in 2020 in meeting their mission to provide comprehensive primary care to everyone, regardless of ability to pay. 10 The majority of HC patients are low-income, another quarter are uninsured, and many have chronic conditions including mental health and substance use disorders (SUDs). 10
In addition, HCs are located in underserved areas frequently marked with a lower supply of providers. 11 HCs also provide care to patients who experience homelessness, unemployment, food insecurity, limited English proficiency, and other SDOH. 12,13 To better address patients' needs and their overlapping SDOH factors, HCs have increasingly invested in providing services that facilitate access to care, such as medical transportation, translation, and care coordination. Similarly, HCs have assisted patients to obtain health and income benefits or insurance, and linked them to social services. Some HCs have provided career advancement training and placement, literacy classes, food banks and healthy food, and social legal assistance. 14,15
Other safety net providers may also provide similar services, yet the investment in and supply of these efforts frequently falls short of the needs of the populations served, and they are often reactive rather than strategic and more proactive. 16 This may be because addressing SDOH by providers requires systematic measurement of SDOH indicators and a clear understanding of the relative contribution of each SDOH indicator toward overall health status. It is also essential to identify which SDOH domains and indicators are linked to different conditions and to what degree. Assessing the relative contribution of SDOH indicators is likely to lead to designing effective interventions and targeted use of resources that promote HCs and other health care organizations' population health outcomes. 17
This study aimed to assess the relative contribution of specific categories of SDOH indicators toward health status of HC patients. The study was informed by SDOH domains identified by various frameworks and models including HP2020 and County Health Rankings. 4,6 However, the study used a population health management or real-time perspective for assessing the relative contribution of each indicator to health status using available indicators in a cross-sectional survey of HC patients. Understanding this relative contribution is essential in identifying best approaches to addressing SDOH among HC and other low-income patients.
Methods
Six categories of SDOH indicators were identified and were expected to be associated with an individual's health at a given time. The indicators were beyond the more innate biological indicators of health such as age and gender. The categories and related indicators included health behaviors and patterns of health care access and use, which are likely to be most proximal to health in health care delivery settings. 5,7 The next likely proximal categories included social and economic SDOH. 5,7 The most distal categories included quality of care and physical environment and context. 5 –7,17
Data and sample
The analyses were conducted using the 2014 Health Center Patient Survey (HCPS), a cross-sectional, nationally representative survey of HC patients sponsored by HRSA's Bureau of Primary Health Care. The survey included questions on patient self-reported sociodemographic characteristics, health conditions, health behaviors, access to health care services, and patient satisfaction with quality of care.
The HCPS had a 3-stage sampling method to select a representative sample of 169 HCs organizations with 520 clinic sites and patients within each clinic site who had at least one prior visit to the site. The sampling distribution included patients representing 42 states, and 68% were from urban areas. A total of 7002 interviews were conducted in person, with 59.5% of all patients screened and a 91.4% completion rate among eligible patients. The sample was restricted to adults 18 years and older and reported the HC as their usual source of care for a final sample size of 5024 patients. This study was determined exempt by the University of California Los Angeles Institutional Review Board due to analysis of de-identified publicly available secondary data.
Dependent variables
Health status measures included self-reported health (fair or poor health vs. good, very good, or excellent), which has been demonstrated to be a reliable measure of overall health and correlated with morbidity and mortality. 18,19 Four additional and specific measures of physical and mental health were also examined: ever diagnosed by a professional health provider with diabetes (vs. not), hypertension (vs. not), cardiovascular disease (vs. not), and ever diagnosed with depression or anxiety (vs. not). Cardiovascular disease included congestive heart failure, coronary heart disease, angina, and myocardial infarction.
Independent variables
Independent variables that represented each SDOH category were identified in HCPS and focused on disadvantages indicated by each indicator. SDOH indicators of health behaviors were currently smoking, not physically active, and at high risk of SUDs. Physical activity was created consistent with Centers for Disease Control and Prevention's physical activity definition of having at least 150 minutes of moderate-intensity physical activity per week (vs. less). 20 The HCPS did not have information to calculate 75 minutes a week of vigorous-intensity physical activity. Risk of SUD was determined based on a score of 13 or higher on the World Health Organization's Alcohol, Smoking, and Substance Involvement Screening Test (vs. 5–12 as moderate and <5 as low). 21
SDOH indicators of health care access and utilization included unmet need for medical and dental care and prescription medication. Unmet need was present when patients reported needed and did not get, needed and received versus did not need it. Utilization measures identified those with higher utilization of outpatient and emergency department (ED) visits including 5 or more doctor visits (vs. fewer) and 2 or more (vs. none or one) ED visits in the past year.
SDOH social indicators included patients with less than high school educational attainment, had not married or were divorced or widowed, and having limited English proficiency. A homelessness or at risk of homelessness indicator was also included using methodology by Baggett and colleagues. 12 SDOH economic indicators included not in labor force, <100% of federal poverty guideline (FPG), and being uninsured.
Indicators of quality of care were patient's experiences based on questions from the Consumer Assessment of Healthcare Providers and Systems Clinician and Group survey. 22 Quality of care indicators included patient rating of provider communication, patient rating of HC staff communication, and overall provider rating. Patient rating of provider communication was measured based on 4 questions that asked patients how often (always, usually, sometimes, or never) the HC provider or other health professional knew your medical history, listened carefully to you, showed you respect, and spent enough time with you.
A composite score was created that ranged from 0 to 16 and rescaled it to a range of 0 to 100 for ease of interpretation. Two questions on staff communication were also used that asked patients how often (always, usually, sometimes, or never) the HC staff were helpful as they should be and treated you with courtesy and respect. A composite score was created that ranged from 0 to 8 and rescaled it to a range of 0 to 100 for ease of interpretation. Overall provider rating was based on one question that asked patients to rate their provider using a scale of 0 (low) to 10 (high), and this was also rescaled to a range from 0 to 100. Disadvantaged measures of quality of care indicators were considered as <50 percentile of the composite score. Physical environment indicators included urban (vs. rural) and US census region.
Control variables included innate individual characteristics that could influence health status including age (18 − 44, 45 − 64 vs. 65 years and older), gender, and race/ethnicity (non-Hispanic White vs. Hispanic/Latino, non-Hispanic Black, Asian, American Indian/Alaska Native, and other). Full description of the independent variables can be found in Supplementary Appendix Table A1.
Statistical analysis
The relationship between each SDOH and health status indicators was measured using logistic regression models. Using these models and postestimation commands, predicted probabilities for each SDOH category were calculated. Two additional predicted probabilities were calculated for likely hypothetical scenarios when all SDOH indicators were present and when none were present. The relative contribution of each SDOH category was measured by testing the difference between related predicted probabilities and assessing which category was greater or lower than other categories. The regression models were assessed for collinearity and indicators were excluded if they were collinear. All analyses were weighted and adjusted for the HCPS survey design. STATA version 16 was used for statistical analyses and significance levels at 0.05 or lower were discussed.
Results
Table 1 displays sample characteristics overall and by each health status measure. Many patients reported at risk behaviors such as being current smokers (28%) and not physically active (38%), high health care use such as 2 or more ED visits (29%), experiencing at risk of homelessness (36%), not in labor force (47%), earning <100% of the FPG (56%), being uninsured (27%), high scores for provider communication (93%), and patients of HCs in rural areas (52%) or the southern region of the United States (30%). Data show variations in these characteristics by health status. For example, patients reporting fair or poor health most often reported not being physically active and not in labor force, whereas patients with depression or anxiety most often reported being a smoker and experiencing or at risk of homelessness.
Sample Characteristics
ED, emergency department; SUD, substance use disorder.
Table 2 displays which individual SDOH indicators were significantly associated with each health status measure in regression models that included control variables. For example, those not physically active (OR = 1.68), needed medical care and did not get it (OR = 2.39), needed medical care and received (OR = 2.00), had 2 or more ED visits (OR = 2.01), had less than high school education (OR = 1.80), were not in the labor force (OR = 1.54), and lived in the southern census region (OR = 1.91) had higher odds of reporting fair or poor health relative to their reference groups. There were some differences in results for other health status measures.
Odds Ratios of Association of Social Determinant of Health Indicators with Health Status Indicators
Cardiovascular disease includes congestive heart failure, coronary heart disease, angina, and myocardial infarction.
Statistically significant at * P < 0.05, ** P < 0.01, *** P < 0.001.
ED, emergency department; SUD, substance use disorder.
Figure 1 displays the predicted probabilities obtained from each model for each SDOH category. Data showed that the access SDOH category had the highest predicted probability (contribution) associated with all the health status measures examined, though the value of this contribution differed by measure. For example, the contribution to fair or poor health was 72.4% versus 42% to diabetes and 10.1% to cardiovascular disease.
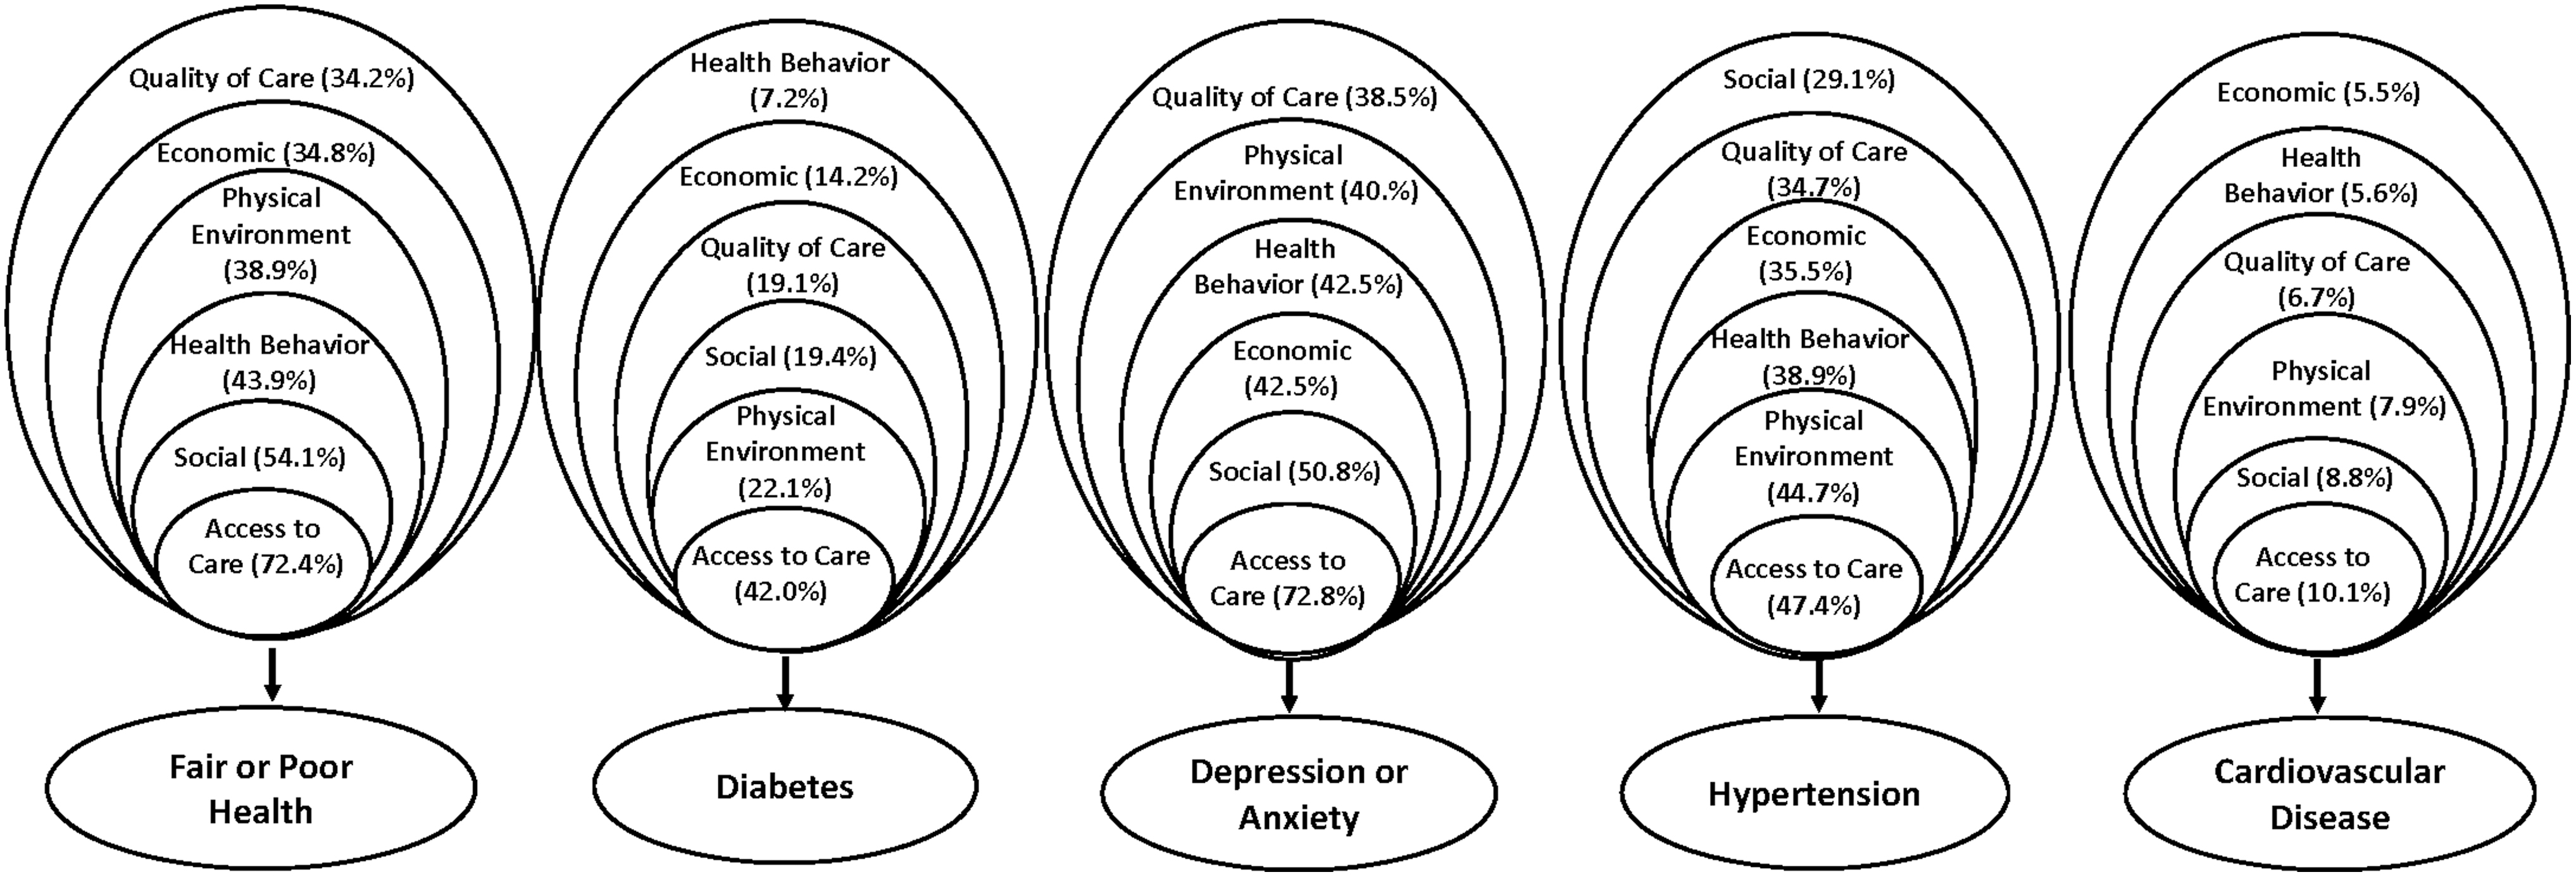
Predicted probability of category of social determinants of health associated with health status indicators.
The second highest contribution varied by health status measure, with the social category for fair or poor health (54.1%) and depression or anxiety (50.8%) and physical environment for diabetes (22.1%) and hypertension (44.7%). The lowest contribution to each health status measure also varied including quality of care for fair or poor health (34.2%) and depression or anxiety (38.5%), health behaviors for diabetes (7.2%), and social for hypertension (29.1%). No SDOH category had a statistically higher contribution to cardiovascular disease but the access category appeared to have a higher contribution than the other categories and economic category appeared to have the lowest.
Supplementary Appendix Table A2 shows additional details including the average predicted probability for each health status measure as well as 2 scenarios when none of the SDOH indicators were present and when all the SDOH indicators were present. The latter analyses showed that when all SDOH indicators were present, the predicted probability of fair or poor health was 87.9% versus 3.9% when no SDOH indicators were present. The same pattern was observed for depression or anxiety (89.6% vs. 1.6%, respectively). These differentials for the other health status measures were smaller.
Discussion
Statistically significant associations were found between SDOH indicators across nearly all 5 measures of health status, but the contribution of categories of SDOH indicators varied by the health status measure. Access indicators were found to have the largest contribution to fair or poor health, diabetes, depression or anxiety, hypertension, and cardiovascular disease compared with other SDOH categories. Large differences were also observed in hypothetical scenarios when all SDOH indicators were present compared with none for fair or poor health and depression or anxiety.
The findings are from a subset of low-income and uninsured patients who receive care at HCs and have a higher prevalence of fair or poor health, diabetes, hypertension, cardiovascular disease, or depression or anxiety than the general population. 10,23 HC patients also have more health behavior, social, and economic SDOH indicators. 10,13,24 The general finding of the association of individual SDOH indicators with health status is supported by existing evidence. For example, other studies of the US population have shown associations between poor health and lower education, unemployment, homelessness, or low-income. 25 –27
The simultaneous assessment of the association of categories of SDOH indicators extends this existing knowledge by providing new insights. In particular, the authors were able to compare these relationships across several measures of health status and demonstrate differential or similar relationships by SDOH indicator. For example, the presence of unmet need for prescription medications for all health measures may reflect access barriers that are beyond the ability to pay, such as uneven distribution of pharmacies and limited availability of some medication in predominantly minority, underserved, and low-income areas. 28
The high use of primary care among patients with depression or anxiety may reflect difficulties in unmet need for mental health care and the subsequent increase in frequency of office visits to manage these conditions. 29 Similarly, higher likelihood of multiple ED visits for those with fair or poor health may reflect severity. 30 The findings of the significant association of quality of care indicators, including lower provider communication scores but higher overall rating for patients with diabetes and depression or anxiety, may reflect the need of these patients for improved communication and trust during interactions with their providers, while holding a positive overall impression of the provider. 31
Several findings including association of higher likelihood of smoking with depression or anxiety, lack of physical activity and residence in some US census regions with fair or poor health, and being at risk of or being homeless with being in fair or poor health and having depression or anxiety are consistent with the literature. 26,27,32 Also, the association of unemployment and rural residence with diabetes, and residence in the southern US census region with hypertension are consistent with existing research. 33 –35
The association of a lower likelihood of smoking or being at high SUD risk with diabetes, however, may be indicative of better self-care practices of these patients because of health education, tobacco counseling, and subsequent better self-care efforts by such patients. 24 The higher likelihood of not being in the labor force and diabetes may also indicate the complications associated with consequences of diabetes. 36 Yet, the lower likelihood of being a high school graduate versus a college graduate with diabetes is unexpected and requires further examination.
The assessment of relative contribution of categories of SDOH, as a proxy for proximity of these SDOH toward health status, indicated that the access category rather than health behaviors was most proximal to nearly all health status measures, and health behaviors frequently were more distal. 8 Similarly, the findings showed that most distal SDOH indicators varied by health status measure, and physical environment SDOH indicators were at time more proximal than other SDOH categories. 8
The most proximal relationship of the access SDOH category with health status indicators may indicate the ambulatory care sensitive nature of some health conditions and higher likelihood of being asymptomatic at lower levels of severity. 37 In addition, the findings that the access category had a higher comparative contribution to health status in this study is different from County Health Rankings that attribute a lower value to access indicators. This differential is likely due to the assessment of the role of access across the life span in the County Health Rankings versus the study assessment of access during a patient–provider encounter. 8
Limitations
This study had limitations. The data were cross-sectional and causal inferences between SDOH indicators and health status measures were not possible. The analyses also used logistic regressions rather than other analytic techniques to assess the relative contribution of various SDOH to health status. Therefore, the findings should not be interpreted to reflect casual factors that determine health status but factors that are associated with probability of having fair or poor health or other conditions.
In addition, the findings are based on self-reported data, and, as such, they may be subject to recall and acquiescence bias. The HCPS did not include a comprehensive list of SDOH indicators, particularly environmental indicators such as crime, safety, or provider supply. These indicators were not merged with the HCPS data because address data for respondents were not available. The grouping of SDOH indicators into categories also influenced the findings of relative contribution of each SDOH category. The results are most generalizable to HRSA-funded HCs that may have a different SDOH profile than higher income and insured patients.
The finding of no SDOH and all SDOH indicators was not in-sample predictions. In other words, no survey respondents fit these exact scenarios. These results, therefore, may be less reliable than in-sample predictions for all other scenarios presented.
Policy and practice implications
The findings have implications for how HCs may focus their efforts to better meet the needs of their patient populations with specific conditions. For example, HCs may want to explore additional ways to increase access to prescription medications for all their patients. HCs may elect to contract with pharmacies to expand prescription medications at a discount or consider adding pharmacists on site where space and funding are available. Currently, information on whether HCs can provide all or as much medications as their patients need on site is limited. 38 Furthermore, HCs may lack capacity for employing pharmacists, or physical space for a pharmacy, as data show that 46% of HCs had colocated pharmacists in 2018. 10
To maximize clinical interactions with patients who often have competing priorities to obtaining follow-up care needs, HCs could further expand their lines of comprehensive service by integrating pharmacy services (directly or by referral) to link patients with primary care services and pharmaceutical treatment and maintenance. These opportunities can include providing medications to qualifying indigent patients at low or no cost through programs such as prescription assistance programs or pharmaceutical manufacturer donations. 38
Similarly, HCs can also prioritize and better understand the underlying mechanisms driving unmet need for medical care among patients in fair or poor health as well as those with diabetes and depression or anxiety. The data did not identify the need for specific medical services that were unmet but indicate the need for more research to better understand such unmet need. More research is also needed to assess the reason for the high contribution of living in the southern US census region with hypertension and diabetes, which is not explained by other SDOH indicators in the study models but might be related to dietary practices or other regional factors. 34
The findings also show social SDOH indicators to contribute more to fair or poor health and depression or anxiety, which highlighted the importance of addressing SDOH indicators such as homelessness. Such problems require linking patients to social service agencies but barriers to linkages exist. For example, systematic screening using a standardized screening tool that is incorporated in the electronic health records, protocols for referrals, and working relationships with social service agencies is needed. Existing evidence indicates these barriers to successfully addressing such SDOH exist. 39
The findings also imply that HCs should prioritize different SDOH interventions among patients with depression or anxiety, giving high priority to access barriers, followed by social, health behavior, and economic interventions. To the degree that fair or poor health status reflects overall health and perhaps those with higher severity of any existing conditions, HCs can focus their efforts on addressing access indicators followed by social, health behaviors, and physical indicators. Further research is required to assess differences in the relative contribution or proximity of these SDOH indicators to other health status measures among HC and other populations of patients. Future research can also clarify the most successful approaches and the subsequent impact of provision of services that address specific SDOH by providers.
The study's results may have applications beyond improving the health of HC patients, and relevant for other safety net providers with similar profiles. 1 Population management efforts by most providers cannot adequately address SDOH indicators, particularly those that impact health across the lifespan, such as education or the physical environment. Most providers also lack resources and expertise to address SDOH indicators that are frequently provided by HCs, including linkages to social services and housing. These data highlight the importance of identifying provider-based interventions to addressing SDOH.
Footnotes
Authors' Contributions
N.P. held primary responsibility for the study design, data analysis, and article preparation. X.C., W.Z., and C.L. assisted with data collection. X.C. and W.Z. were responsible for data analysis. All authors assisted in interpretation of data, reviewed and provided critical revision of the article, and gave final approval to be published.
Disclaimer
The views expressed in this publication are solely the opinions of the authors and do not necessarily reflect the official policies of HHS or HRSA, nor does mention of the department or agency names imply endorsement by the US Government. The funders had no role in study design, data collection and analysis, decision to publish, or preparation of the article.
Author Disclosure Statement
Dr. Hair, Mr. Bolton, and Dr. Sripipatana are employees of the US Government, US Department of Health and Human Services, which funded this study.
Funding Information
This research was funded by the US Department of Health and Human Services (HHS), Health Resources and Services Administration (HRSA) under HRSA Contract no. HHSH250201300023I.
Supplementary Material
Supplementary Appendix Table A1
Supplementary Appendix Table A2
References
Supplementary Material
Please find the following supplemental material available below.
For Open Access articles published under a Creative Commons License, all supplemental material carries the same license as the article it is associated with.
For non-Open Access articles published, all supplemental material carries a non-exclusive license, and permission requests for re-use of supplemental material or any part of supplemental material shall be sent directly to the copyright owner as specified in the copyright notice associated with the article.
