




Abstract
This study assesses cost savings associated with specific contraceptive methods provided to beneficiaries enrolled in South Carolina Medicaid between 2012 and 2018. Incremental cost-effectiveness ratios, defined as the additional cost of contraception provision per live birth averted, were estimated for 4 contraceptive methods (intrauterine devices [IUDs], implants, injectable contraceptives, and pills), relative to no prescription method provision, and savings per dollar spent on method provision were calculated. Costs associated with publicly funded live births were derived from published sources. The analysis was conducted for the entire Medicaid sample and separately for individuals enrolled under low-income families (LIFs), family planning, and partners for healthy children (PHC) eligibility programs. Sensitivity analysis was performed on contraceptive method costs. IUDs and implants were the most cost-effective with cost savings of up to $14.4 and $7.2 for every dollar spent in method provision, respectively. Injectable contraceptives and pills each yielded up to $4.8 per dollar spent. However, IUDs and implants were less cost-effective than injectable contraceptives and pills if the average length of use was less than 2 years. Medicaid's savings varied across Medicaid eligibility programs, with the highest and lowest savings from contraceptive provision to women in the LIFs and PHC eligibility programs, respectively. The results suggest the need to account for unique needs and preferences of beneficiaries in different Medicaid eligibility categories during contraception provision. The findings also inform program administration and provide evidence to justify legislative appropriations for Medicaid reproductive health care services.
Introduction
Contraceptive care focused on individual needs, preferences, and values is a core tenet of care quality and reproductive health autonomy. 1 –3 State Medicaid programs are essential for ensuring access to contraceptive methods for people with lower incomes and teens, 4 –7 and to cover the costs of most births. 8 For policy and clinical decisions, therefore, it is important to investigate the extent to which provision of contraceptive methods translates to averted births and subsequent cost savings among Medicaid beneficiaries.
State Medicaid agencies cover reproductive health services for women who become eligible for Medicaid benefits either through traditional programs (full-benefit) or Section 1115 Family Planning Waiver/State Plan Amendments (limited-benefit). 7,9 In South Carolina, the full benefit program includes clients under the low-income families (LIFs) program (eligible up to 161% Federal Poverty Level [FPL]) and partners for healthy children (PHC) program (eligible up to 208% of FPL), and the limited benefit Medicaid includes those enrolled through the family planning (FP) program (eligible up to 194% of FPL).
While individuals eligible through the LIF and PHC programs have access to all Medicaid-covered health care services, those eligible through the FP program receive limited benefits that include annual examinations, select preventive health screenings, and contraceptive services. In addition to the differences in the eligibility rules and covered services, the underlying reproductive health needs, potential motivations, and subsequent level of engagement with health delivery systems likely vary across eligibility programs.
These characteristics could play part in determining contraceptive use patterns and contraceptive efficacy, 10 –14 which could lead to differences in cost-effectiveness of different contraceptive methods across the eligibility programs. Considering such differences in contraceptive utilization and cost-effectiveness analyses accounts for latent characteristics that would otherwise be masked when evaluating state Medicaid programs as a whole.
Despite policy implications for reproductive health and health care expenditures, cost-effectiveness of contraceptive methods among people enrolled in Medicaid programs remains understudied. Prior studies that examined cost-effectiveness of contraceptive methods in the United States, in general, reported savings for contraceptive use relative to pregnancy and maternity care. 15 –26 However, few of these studies focused on Medicaid beneficiary populations, and no study, to the authors’ knowledge, has investigated variations in the cost-effectiveness of contraceptive methods among beneficiaries enrolled through different Medicaid eligibility programs.
This study expands on the existing literature and evaluates the cost savings from provision of contraception to women with low income enrolled in South Carolina Medicaid. Using administrative data covering multiple years, this study estimates the cost savings per dollar spent on contraceptive method provision. The cost-effectiveness analysis was conducted both for the entire Medicaid sample and separately for Medicaid eligibility programs. The analysis advances the evidence related to cost-effectiveness of contraceptive methods within public insurance programs and provides data relevant to Medicaid stakeholders including state policymakers. This approach also allows Medicaid to make eligibility program-specific decisions related to contraceptive method provision.
Materials and Methods
Study population and data
A retrospective cohort was constructed of women aged 15–45 years who were newly enrolled in South Carolina Medicaid between 2012 and 2018. The analysis included women enrolled under the FP, the LIF, and the PHC eligibility programs. Collectively, the 3 eligibility categories covered 88% of newly enrolled women during the study period and represented women likely to seek reproductive health services. Given Medicaid eligibility can be inconsistent, the analysis was restricted to include person-year observations for women with 9 months or more of coverage during years of eligibility.
Because pregnancy intentions cannot be assessed from the claims data, the analysis was restricted to women with evidence of current or previous year FP claims as a proxy for sexual activity and desire for pregnancy avoidance. FP claims were defined as those related to contraceptive provision or counseling, including emergency contraception, fertility awareness counseling, sexually transmitted infection testing, treatment, or counseling, and codes for FP services not otherwise specified.
Contraceptive methods and pregnancy outcomes
Medicaid covers a spectrum of prescription contraceptive methods approved by the Food and Drug Administration (FDA). This study evaluated 4 commonly used contraceptive methods: intrauterine devices (IUDs), implants, injectable contraceptives, and pills. The US Department of Health and Human Services, Office of Population Affairs’ (OPA) publicly available tables with claim codes were used for identification of codes-associated contraceptive provision. Once use of an IUD or implant was initiated by a woman, continuation was assumed until evidence of a removal code without reinsertion was encountered, or expiration of implants was presumed 36 months after insertion.
Contraceptive patches and vaginal rings were excluded from the analysis due to the small proportion (<1%) of women with claims for these methods. Sterilization was also not considered and women with evidence of sterilization were identified and excluded from the analysis to avoid chance of misclassification of these women as no prescription method users. Because beneficiaries may receive contraception from sources other than Medicaid and use of barrier methods cannot be accurately ascertained from claims data, women with no annual claims for contraception were classified as having no prescription method provision (NPMP). 27
Pregnancies resulting in live birth were included in the cost-effectiveness analysis. Pregnancy outcomes resulting in nonlive birth (fetal loss) events such as induced or spontaneous abortion, fetal demise, and stillbirth were not included in this study. The South Carolina Medicaid does not cover the cost of births to women in the FP eligibility program. However, women experiencing a pregnancy may switch enrollment to other Medicaid programs with similar income eligibility thresholds. Births to women enrolled in the FP program that were paid for by other Medicaid programs were identified and included in the total number of births for this category.
The Cost-Effectiveness Analysis
Analysis framework
A cost model was constructed to examine the cost-effectiveness of contraceptive methods for an average 1-year period of use as follows: first, costs associated with contraceptive method provision were derived from the Medicaid claims data for each contraceptive method. Next, birth rates associated with the different contraceptive methods were predicted from a regression model. Thereafter, the incremental cost-effectiveness ratio (ICER) was calculated for each contraceptive method. Finally, savings to Medicaid per dollar spent on method provision were estimated. A sensitivity analysis was conducted to account for the fact that the use of some methods may be discontinued before the end of the methods’ life cycle (maximum duration of efficacy).
Costs associated with contraceptive provision
Costs of contraceptive method provision were derived from South Carolina Medicaid data and included cost of drug/device or supplies, and professional fees for outpatient visits and contraception provision. Contraceptive method costs were annualized to facilitate comparability across contraceptive methods with varying duration of effective use. 28 Since IUDs and implants have a life cycle of over 1-year, annualized costs for these methods were determined by multiplying unit cost by (1/n), where n is the number of years of method's duration of effectiveness (life cycle).
For example, for IUDs, the annualized cost was generated by multiplying the total cost of IUD provision by 1/6, where 6 years is the expected life cycle of IUDs. Given that injectable contraceptives and pills have shorter life cycles and are dispensed multiple times in a particular year, the annualized costs for these methods were obtained by multiplying the unit cost by the average number of times the methods were dispensed over a 1 year period. The cost for the NPMP was assumed to be zero.
Method effectiveness
Method effectiveness for each contraceptive method was determined by examining the association between live births in the current year and the type of contraception used in the previous year. Contraceptive methods associated with lower birth rates were regarded as more effective than those associated with higher birth rates. The birth rates associated with each method were predicted from Medicaid claims data using a logistic regression model examining the probability of a live birth associated with each contraceptive method use, with no evidence of contraception method use serving as the reference group.
To account for socioeconomic and demographic differences in the populations served in the different eligibility programs, the logistic regression model was adjusted for key demographic and clinical variables including age, race/ethnicity, and area of residence. Cohort and year fixed effects were also included to account for cohort and year-specific characteristics that could confound the relationship between contraceptive use and a live birth. After running the logistic regression, STATA's postestimation “margins” command was used to obtain the predicted probability of birth associated with each contraceptive method. The predicted birth rates were presented for the entire sample and separately for each eligibility program.
With no information, in the Medicaid administrative data, on sexual activity or pregnancy intentions, and hence being at risk for unintended pregnancy, sexual activity and desire for pregnancy avoidance were inferred from the women's contraceptive utilization patterns. However, there was no obvious way to infer sexual activity for women with no evidence of prescription method provision/use, the reference group. If most women with no evidence of contraceptive use happen to be not sexually active or not seeking pregnancy avoidance, comparing the birth rates of these women with birth rates of women in the other categories would be biased.
The predicted birth rates for women with no evidence of contraceptive use were adjusted to account for the fact that not all women in this category were sexually active or had a desire for pregnancy avoidance. Based on results from the Statewide Survey of Women in South Carolina, conducted by The National Opinion Research Center (NORC) at the University of Chicago, 29 it was estimated that 50% of women with no evidence of contraceptive use were sexually active, and the predicted birth rates for the reference group were discounted accordingly. However, to allow comparison, the cost-effectiveness analysis was conducted using both the birth rates adjusted and unadjusted for sexual activity.
The incremental cost-effectiveness ratio
ICER measures the incremental costs in relation to the incremental benefits obtained by adopting the strategy under assessment rather than its comparator. 30,31 In the current analysis, the ICER approach was used to examine the cost-effectiveness of each contraceptive method used relative to no prescription method use, a common comparator. The ICER was defined as the cost difference between a method and its comparator divided by effectiveness difference between the method and the comparator.
More formally, the ICER was defined using the following formula:
where ICER is the incremental cost-effectiveness ratio,
Costs of live birth
An estimate of the average cost associated with a publicly funded live birth for South Carolina was obtained from published sources. The cost estimates included expenses for those births with deliveries paid for by Medicaid or Children's Health Insurance Program (CHIP), including Medicaid and CHIP managed care plans and Medicaid and CHIP programs operating under section 1115 waivers. Specific costs included in the estimation are costs of prenatal care, labor and delivery, postpartum care, and 1 year of medical care for the infant. 8 Converted to 2018 dollars, the cost was $15,332, and represented the amount each birth averted would have cost the program from conception until 1 year of age.
Savings per dollar spent on method provision
Savings per dollar spent on method provision were calculated for a more intuitive interpretation of the cost-effectiveness results. The savings per dollar spent were obtained as a ratio of the costs associated with live birth ($15,332) and the ICER.
Sensitivity analysis
In the main analysis, method costs were annualized to allow comparability between contraceptive methods with differing durations of efficacy over a 1-year period. This approach implicitly assumes each method will be used for the entire duration of product efficacy. However, women may discontinue method use before the end of the method's life cycle for various reasons. Since costs for IUDs and implants are predominantly incurred at initiation, rather than recurrent at regular intervals, annualized costs could bias in favor of these methods in cases of method discontinuation.
A sensitivity analysis was undertaken to address concerns that IUDs and implants may not be used for the full duration of product efficacy and, therefore, may not realize the potential cost savings expected when annualized costs are used. In the sensitivity analysis, “adjusted annualized costs” were used instead of “annualized costs” to account for potential method discontinuation. Unlike the “annualized costs,” which are fixed, “adjusted annualized costs” were adjusted every year over the method's life cycle.
The “adjusted annualized costs” were determined by multiplying unit cost by (1/c), where c is the number of years of method's continued use. For IUDs, the “adjusted annualized cost” was calculated at c = 1, c = 2, c = 3, c = 4, c = 5, and c = 6. For implants, the “adjusted annualized cost” was calculated at c = 1, c = 2, and c = 3. The cost-effectiveness analysis was then conducted by plugging each “adjusted annualized cost” in the ICER formula in Equation (1). For injectable contraceptives and pills, the cost-effectiveness analysis was performed for utilization periods of 1 year and held constant for each year of use.
The study received ethical approvals from the institutional review board of East Tennessee State University and the South Carolina Office of Revenue and Fiscal Affairs Data Oversight Committee. Data management was conducted using SAS and all subsequent statistical analyses were performed using Stata version 15.
Results
There were 327,369 reproductive-age women newly eligible for South Carolina Medicaid benefits during the study period. Of those women, 58,891 did not have at least 1 year with 9 months of eligibility and were excluded, leaving 268,478 in the study population. An additional 40,645 women were covered through Medicaid programs not designated in the inclusion criteria and were removed. Another 88,448 women who did not have at least 1 claim for reproductive health services and an additional 26,372 women with missing information or using less common methods were excluded. Accordingly, a total of 112,561 reproductive-aged South Carolina Medicaid beneficiaries who met selection criteria and newly enrolled from 2012 to 2018 were included in the final sample Figure 1.
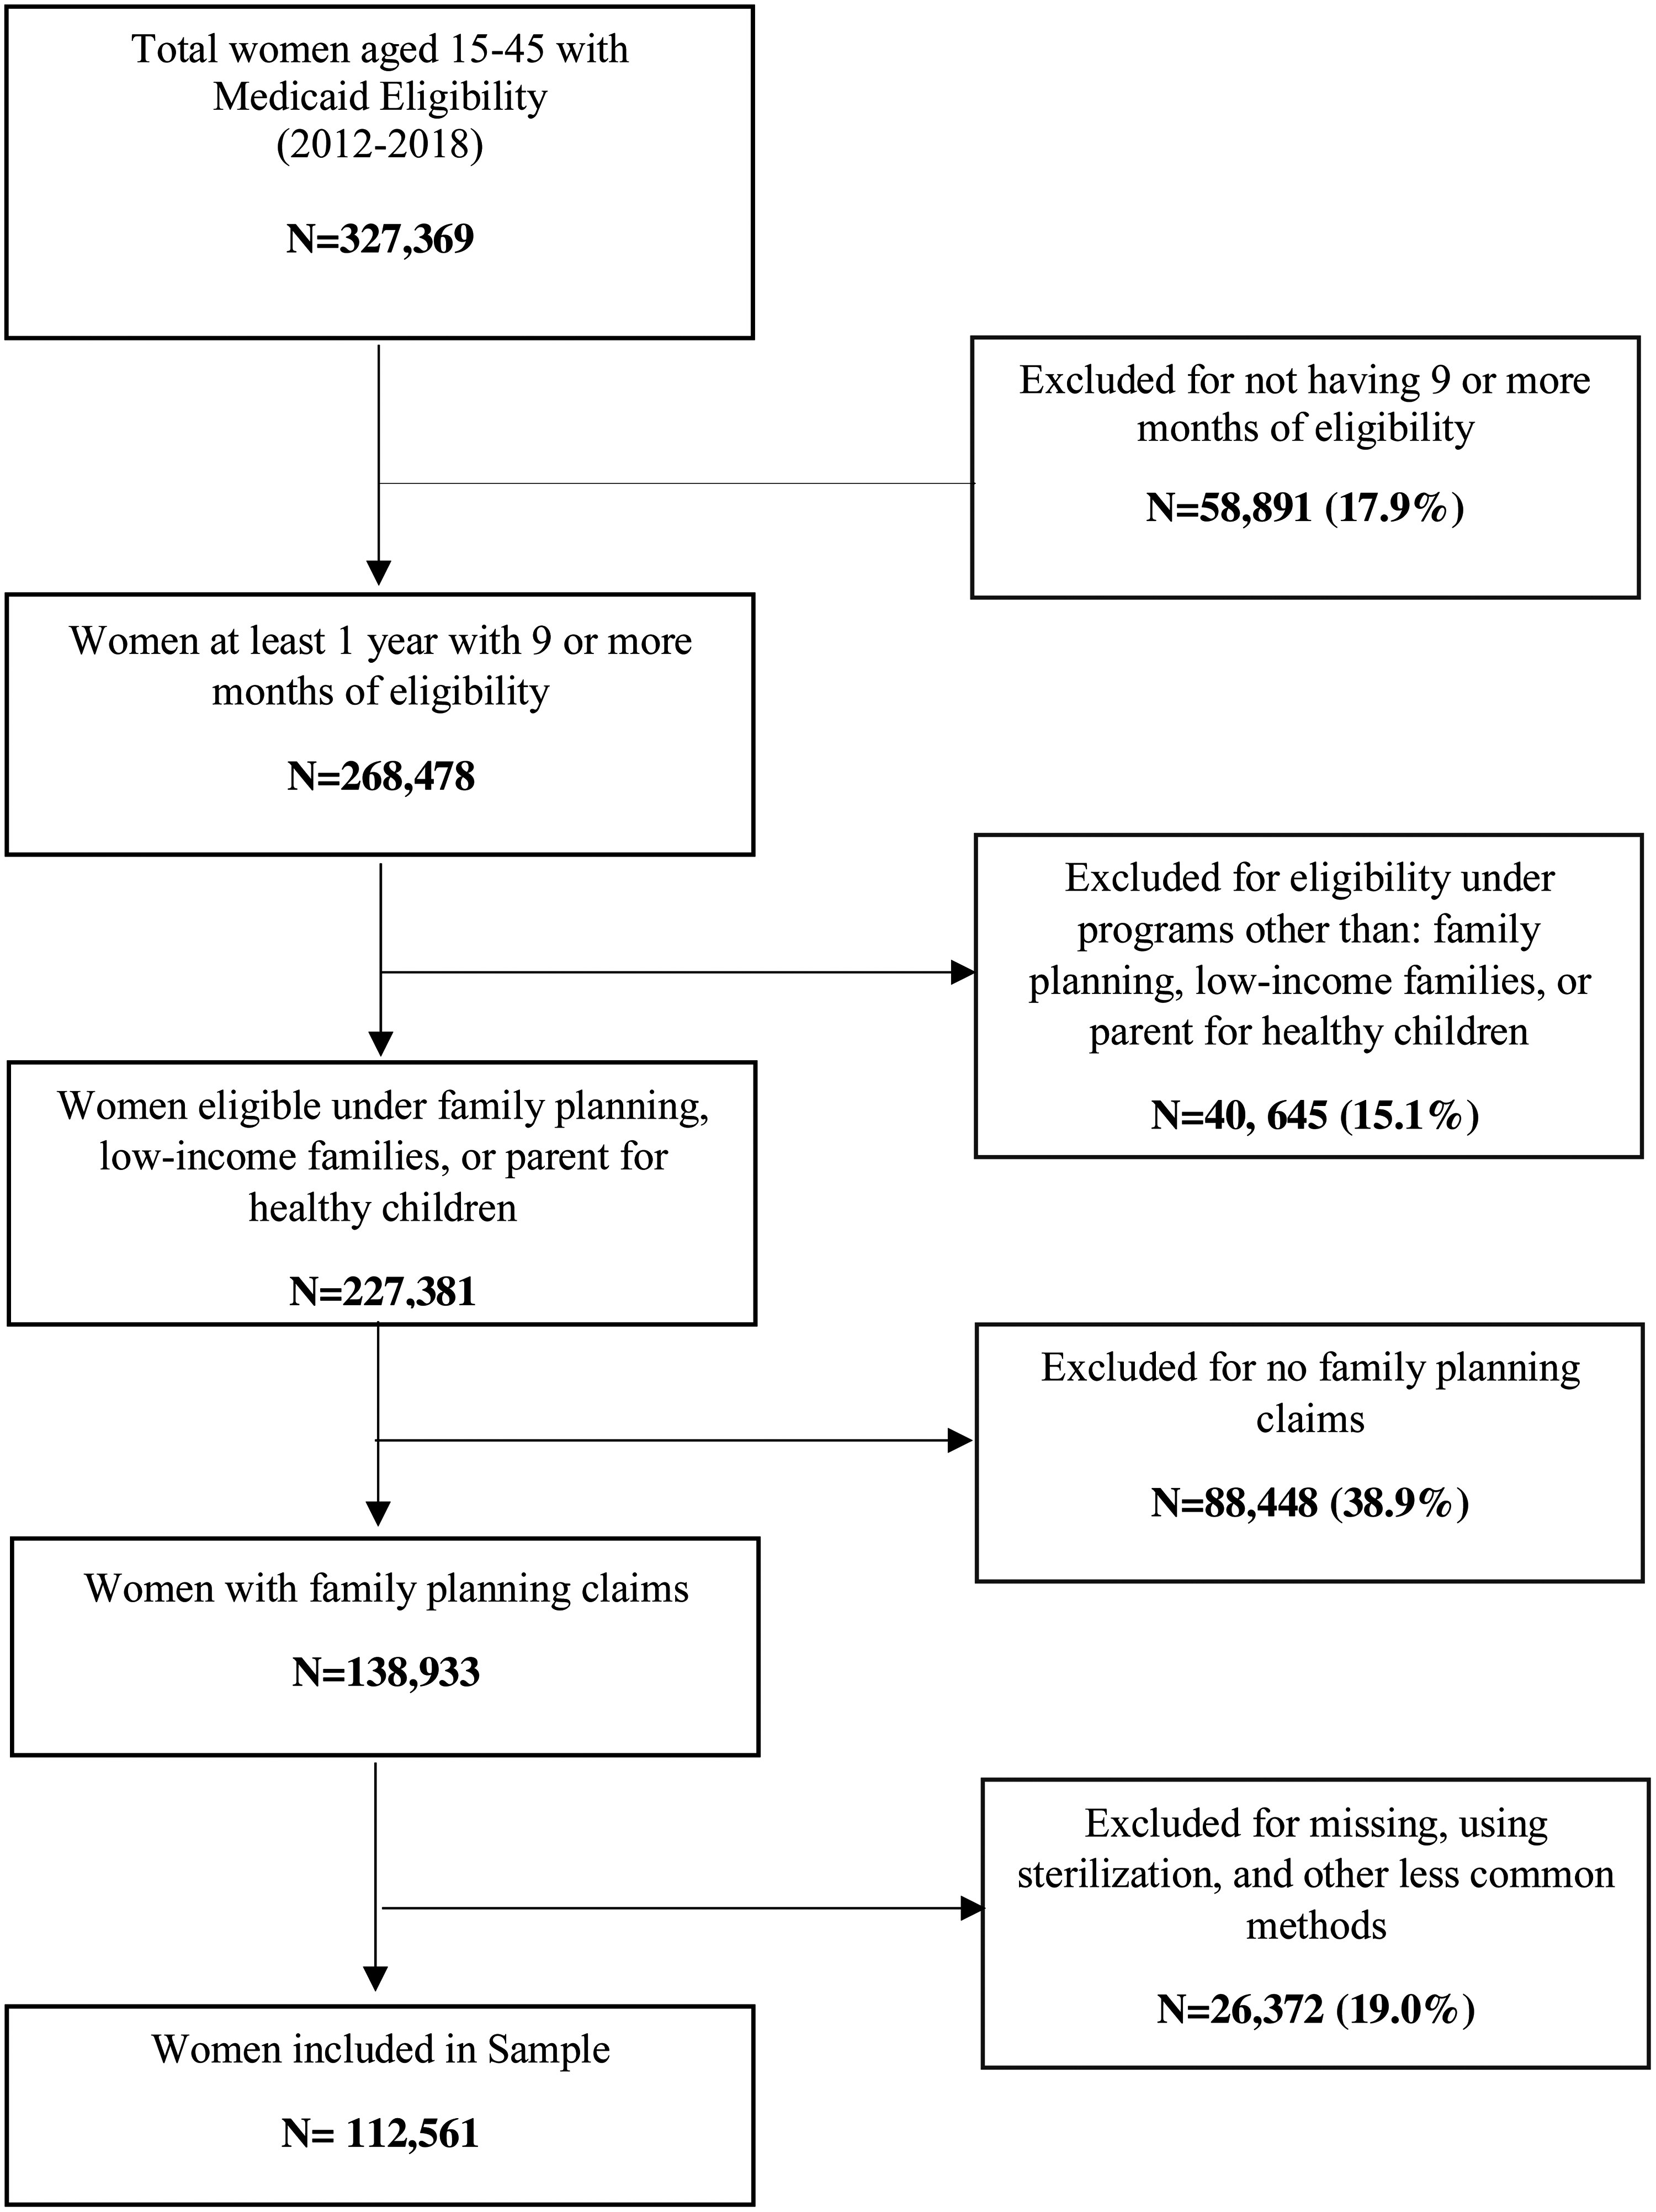
Flow chart of women aged 15–45 years with Medicaid eligibility from 2012 to 2018 by study inclusion criteria.
The individual women contributed 271,671 person-year observations, which serve as the unit of analysis in this study. The characteristics for unduplicated individual women (112,561) and person-years contributed (271,671) are described in Table 1. The majority of the study population consisted of adolescents enrolled through PHC (49.6% of individual women and 44.5% person-years) followed by women with coverage through LIFs (37.0% and 32.5%), and FP (35.1% and 24.9%), respectively. Evidence of IUD use was observed among 5.1% of individual women and 4.0% of person-years represented. Implants were more common with 7.4% of the individual women and 5.9% of person-years using the method.
Contraceptive Method Utilization Among Medicaid Beneficiaries in South Carolina (2012–2018) by Medicaid Eligibility Program
Panel A reports findings for the individual women included in the analysis, and Panel B presents the findings for the total person-years contributed by the individual women. The percentages for the individual programs in Panel A add to >100% because a woman can switch between programs and, therefore, can get served under >1 eligibility program over the years.
FP, family planning; LIFs, low-income families; NPMP, no prescription method provision; PHC, partners for healthy children.
Injectable contraceptives and pills were the most common methods identified, with ∼44.9% of women using these methods, attributed to 30.4% of person-years. Forty-two percent of women had no prescription method use, representing over half (59.7%) of person-years contributed. Injectable contraceptives and pills were the most prevalent forms of contraception used among PHC and FP beneficiaries (46.8% and 45.1%, respectively), whereas most LIF beneficiaries had no prescription method use (54.2%) (Table 1).
Contraceptive method cost and method effectiveness
Average contraceptive costs at initiation ranged from $82 for pills to $865 for implants. Annualized contraceptive costs ranged from $143 for IUDs to $328 for pills (Table 2). IUDs and implants have higher effectiveness (lower predicted birth rates), with effectiveness rates ranging from 96.09% to 98.41% across eligibility programs. Injectable contraceptives and pills have slightly lower effectiveness (higher predicted birth rates), with effectiveness rates ranging from 93.98% to 97.67% across eligibility programs. The predicted birth rates were highest for women with no evidence of method use, the NPMP category (Table 2). The logistic regression results, from which the predicted birth rates were derived, are presented as a Supplementary Data in Table S1 and Table S2.
Contraceptive Method Costs and Method Effectiveness Among Medicaid Beneficiaries in South Carolina (2012–2018) by Medicaid Eligibility Program
Method effectiveness was measured by percentage of women not experiencing a live birth given evidence of contraceptive use. The birth rates associated with each contraceptive method were predicted from a logistic regression model. The logistic regression results and the predicted birth rates are presented in Supplementary Data.
Average duration of method effectiveness for the intrauterine devices and implants. For injectable contraceptives and pills, “method life cycle” refers to the average duration dispensed.
Obtained by dividing the total method cost by method's life cycle.
For women with NPMP, the predicted birth rates were adjusted for sexual activity. The percentages in the brackets show the adjusted birth rates.
Incremental cost-effectiveness ratio
A contraceptive method was considered cost-effective if the ICER was less than costs of a live birth. IUDs and implants had substantially smaller ICERs than injectable contraceptives and pills. The additional cost for contraceptive provision per averted birth was lowest for IUDs, with ICER values ranging from $1065 to $2738. Cost per live birth averted was highest for women under the PHC eligibility category, and lowest among LIF beneficiaries (Table 3).
Incremental Cost-Effectiveness Ratios for Contraceptive Methods Provided by South Carolina Medicaid Between 2012 and 2018 by Medicaid Eligibility Program
The ICER, for each method, shows the amount spent on provision of the method per live birth averted.
The “unadjusted” values represent the ICER with no assumption of sexual activity for women in the “no prescription method provision” category.
The “adjusted” values represent the ICER based on the assumption that 50% of women in the “no prescription method provision” category are sexually active.
ICER, incremental cost-effectiveness ratio.
Cost savings per dollar spent
Saving per dollar spent on contraceptive provision was highest for IUDs and implants that were associated with savings of up to $14.4 and $7.2, respectively. Injectable contraceptives and pills yielded up to $4.8 per dollar spent. Cost savings per dollar spent were highest for women under the LIF eligibility category, followed by women under FP, and PHC programs (Table 4).
Savings Per Dollar Spent on Contraceptive Method Provision by South Carolina Medicaid Between 2012 and 2018 by Medicaid Eligibility Program
The “unadjusted” results represent “savings per dollar spent” estimated with no assumption of sexual activity for women in the “no prescription method provision” category.
The “adjusted” results were based on the assumption that 50% of women in the “no prescription method provision” category are sexually active.
Sensitivity analysis
Saving per dollar spent on IUDs and implants increased as the possible number of years of continued use increased. At 1 year of use, a dollar spent on IUDs and implants would result in a saving of up to $2.4, compared with saving of $4.8 for injectable contraceptives and pills. The savings per dollar spent were assumed to be the same for each year. The savings increased with the number of years of continued use, resulting in up to $14.4 and $7.2 per dollar spent on IUDs and implants, respectively, at the highest possible year of continued use (6 for IUDs and 3 for implants). The savings per dollar spent for IUDs and implants were comparable in the first 3 years of use, with slightly higher savings from implants. Overall, IUDs were more cost-effective if used for >3 years (Table 5).
Variation in Savings Per Dollar Spent on Method Provision for Intrauterine Devices and Implants Relative to Fixed “Saving Per Dollar Spent” Values for Injectable Contraceptives and Pills
This table presents variations in savings per dollar spent on contraceptive methods over the life cycle of the methods. The life cycle is 6 years for intrauterine devices and 3 years for implants. For injectable contraceptives and pills, the “saving per dollar spent” is calculated for average use of 1 year and kept constant. The result should be interpreted as follows. At 1 year use, intrauterine devices and implants yield a saving of up to $2.4 per dollar spent. At first year of use, therefore, intrauterine devices and implants are less cost-effective than injectable contraceptives or pills that yield up to $4.8 per dollar spent. At 2-year use, intrauterine devices and implants yield a saving of up to $4.8 per dollar spent. At the first 2-year of use, therefore, intrauterine devices and implants are as cost-effective as injectable contraceptives or pills that also yield up to $4.8 per dollar spent.
The “unadjusted” results represent “savings per dollar spent” estimated with no assumption of sexual activity for women in the “no prescription method provision” category.
The “adjusted” results were based on the assumption that 50% of women in the “no prescription method provision” category are sexually active.
Discussion
This study found that Medicaid cost savings from averted live births exceeded the costs of providing contraception for all methods evaluated. IUDs were the most cost-effective, despite higher upfront costs, with savings of up to $14.4 on birth-related expenses per dollar spent on contraception provision. Pills were the least cost-effective, with savings of between $1.5 and $4.8 per dollar spent. The relatively low savings on pills could be due to the low duration of dispensation for pills in South Carolina until the year 2020, when the South Carolina Department of Health and Human Services (SCDHHS) issued a public notice to allow coverage of up to a 12-month supply of systemic contraceptives. 32 Evidence suggests that a higher cost saving may be achieved by dispensing a greater quantity once a year compared with frequent dispensations of small packages. 33
The sensitivity analysis accounted for the possibility that women may discontinue contraceptive methods at any time before the end of each method's duration of efficacy, due to various reasons including side effects and desire for pregnancy. 28,34 Using adjusted annual costs, the sensitivity analysis showed that the cost-effectiveness of IUDs and implants depends on duration of continued use. On average, IUDs and implants were less cost-effective than the other methods if used for <2 years.
This is because upfront costs are higher for IUDs and implants and benefits of these methods accrue over time. Accordingly, method discontinuation is an important determinant of cost-effectiveness of IUDs and implants. Given most women included in this study population are enrolled in Medicaid for an extended period, it is likely that the potential cost savings from IUDs and implants would be realized by South Carolina Medicaid.
Although findings of this study are applicable across all Medicaid eligibility programs, some important differences across eligibility categories were observed. The saving on birth-related expenses per dollar spent on method provision was highest for women under the LIF program and lowest for PHC. The difference in method effectiveness and cost savings across programs may imply that user characteristics and underlying factors driving program enrollment could impact contraceptive choice and effectiveness, thereby contributing to variability in the cost-effectiveness for subgroups.
In addition to direct economic benefits, increased availability of contraceptive methods could support women's autonomy in reproductive life planning. 34 Despite the benefits, uptake of IUDs and implants was generally low. This may be related to financial constraints of the Medicaid program, or practitioner/patient misperceptions regarding the safety and efficacy of different methods. 35 This suggests that in addition to addressing cost barriers, efforts are needed to raise awareness about the benefits of different contraceptive methods and reduce common misconceptions. 34 Needs and preferences of individual women are also most important in contraceptive decision making, and, as such, access to the full spectrum of contraceptive services is crucial for reproductive autonomy. 36,37
Current findings are consistent with previous studies that reported savings for contraceptive coverage and use relative to pregnancy and maternity care. 15,16,38 California's publicly funded family program, Family PACT, estimated savings of >$7.00 for every $1.00 spent on services and supplies for long-acting methods, whereas $1.00 spent on injectable contraceptives and pills translated to savings of $5.60 and $4.07, respectively. 15 A study by Trussell et al concluded that any method of contraception is more cost-effective than no method, and that long-acting methods are the most cost-effective. 16 Frost et al estimated public expenditure savings for FP care of $4.02 for every dollar spent. 38 Results from this analysis show similar trends.
This study is not without limitations. The study made assumptions that could bias the cost savings associated with specific methods. The maximum duration of efficacy for IUDs was assumed to be 6 years, although women may continue to use certain IUD methods for up to 10 years, 34 and this may have resulted in an underestimation of the cost savings from this particular method. For estimating the method effectiveness, the study approach investigated the association between a live birth in the current year and evidence of contraception use in the previous year. This approach may underestimate the effectiveness of a method if women discontinued use of the method with a later desire to become pregnant or for other reasons.
However, it cannot be discerned from administrative claims if methods of contraception were used correctly, consistently, or continuously for the duration of each year, nor can women's pregnancy intentions be known. The aim in this study was to compare birth outcomes and expenditures relative to provision of contraception in the context of South Carolina Medicaid beneficiary use. Contraception initiation or discontinuation occurs for a myriad of reasons and motivations, as do pregnancies, yet these represent practical realities of Medicaid expenditure and program administration. Given the nature of the data and the level of granularity needed to estimate and identify births within an expected period of coverage by method, the authors’ approach minimizes potential misclassification of women.
Undesirable side effects and indirect benefits of contraceptive methods, such as reduction in menstrual blood loss, 39 were also not reflected in the cost–benefit analysis. Since the data were derived from Medicaid administrative claims and were not collected for research purposes, pregnancy intention was unknown and misclassification of FP service utilization was possible. For example, some women may have accessed contraceptive services that are not reimbursed or billed through Medicaid programs or providers. However, given the income vulnerability of women enrolled in these programs, this is unlikely. It is also possible that some women may have been using a method they acquired previously or buying barrier contraceptives such as condoms over the counter.
Conclusions
This study provides strong evidence of the cost-effectiveness of contraceptive provision within a defined cohort of Medicaid beneficiaries that is sufficient to demonstrate economic advantage. The findings provide important insights as to which methods are most cost-effective, and, importantly, how cost-effectiveness varies by length of method use, and across Medicaid eligibility programs. The analysis informs policymakers on how incremental costs associated with method provision compare with cost savings to Medicaid associated with averted live births.
The findings also inform program administration and provide evidence to justify legislative appropriations for Medicaid reproductive health care services. Although the findings suggest that use of all methods reduce rates of pregnancy and associated health care costs, women's needs and preferences should be carefully considered and discussed during contraceptive counseling to facilitate an informed choice from a wide range of contraceptive methods.
Footnotes
Authors’ Contributions
W.S.M. completed conception/design, literature review, analysis, and drafting of the article. N.H. secured funding and contributed to the analysis and writing of the article. E.L. completed data management and contributed to the analysis and writing of the article. B.S. contributed to research methodology and interpretation of results. M.S. provided leadership and offered input on the conceptualization of the study and analysis approach. A.K. secured funding, contributed to article writing, and offered input on the conceptualization of the study and analysis approach. All have reviewed and edited the article drafts.
Author Disclosure Statement
The authors have no conflict of interest to disclose.
Funding Information
This study was supported by a research grant from a private philanthropic foundation. The funding agency did not have any role in the study design, analysis, interpretation of data, writing of the article, and the decision to submit the article for publication.
Supplementary Material
Supplementary Table S1
Supplementary Table S2
References
Supplementary Material
Please find the following supplemental material available below.
For Open Access articles published under a Creative Commons License, all supplemental material carries the same license as the article it is associated with.
For non-Open Access articles published, all supplemental material carries a non-exclusive license, and permission requests for re-use of supplemental material or any part of supplemental material shall be sent directly to the copyright owner as specified in the copyright notice associated with the article.
