




Abstract
Patients enrolled in Medicaid have significantly higher social needs (SNs) than others. Using claims and electronic health records (EHRs) data, managed care organizations (MCOs) could systemically identify high-risk patients with SNs and develop population health management interventions. Impact of SNs on models predicting health care utilization and costs was assessed. This retrospective study included claims and EHRs data on 39,267 patients younger than age 65 years who were continuously enrolled during 2018–2019 in a Medicaid-managed care plan. SN marker was developed suggesting presence of International Classification of Diseases, 10th revision codes in any of the 5 SN domains. Impact of SN marker was compared across demographic and 2 diagnosis-based (ie, Charlson and Adjusted Clinical Groups risk score) prediction models of emergency department (ED) visit and hospitalizations, and total, medical, and pharmacy costs. After combining data sources, prevalence of documented SN marker increased from 11% and 13% to 18% of the study population across claims, EHRs, and both combined, respectively. SN marker improved predictions of demographic models for all utilization and total costs outcomes (area under the curve [AUC] of ED model increased from 0.57 to 0.61 and R2 of total cost model increased from 10.9 to 12.2). In both diagnosis-based models, adding SN marker marginally improved outcomes prediction (AUC of ED model increased from 0.65 to 0.66). This study demonstrated feasibility of using claims and EHRs data to systematically capture SNs and incorporate in prediction models that could enable MCOs and policy makers to adjust and develop effective population health interventions.
Introduction
Patients on Medicaid have significantly higher social needs (SNs) and adverse social determinants of health (SDOH) compared to other patients, mostly due to poverty and lower socioeconomic status. 1 A growing number of states in the United States are implementing tools to capture SNs and SDOH information for patients on Medicaid and incentivizing interventions to address some of those needs (eg, housing instability, lack of transportation, food insecurity). Such interventions include providing community-based services, integrating SNs and SDOH measures in performance assessment of providers, and utilizing managed care rate setting tools. 2
In a survey of demographically representative adults in the United States, an overwhelming 97% of respondents support the idea of health care providers asking about SNs during medical visits. 3 A majority of respondents (80%) also expressed the desire for providers to share information about local resources to address their needs. 3 Despite such public interest in collection and use of SNs to better manage patient populations, most Medicaid-managed care organizations (MCOs) still operate within an annual budget that does not change based on assessed SNs of the population they serve. To address this issue, risk assessment and adjustment for Medicaid patients with highest risks of SNs can be leveraged to determine payments to MCOs, which will, in turn, provide incentives for providers to assess and address SNs of their patients. 4
Multiple challenges and barriers remain in identifying patients with SNs and developing strategies to address the social drivers of health care expenditures. Some of these challenges include variation in definition of SN domains, lack of standardized measures and surveys to capture SNs, threshold used to classify social risk factors as needs, and timing and frequency of SNs assessment. 5 The heterogeneity of collected information on SNs poses challenges in generating high-quality evidence to support use of SNs data in performance assessment or development of effective interventions. 6
Several screening tools have been developed and implemented to consistently capture individual-level SNs. These tools are increasingly used by accountable care organizations and recommended by Center for Medicare and Medicaid under the Accountable Health Communities Model (eg, Protocol for Responding to and Assessing Patient Assets, Risks, and Experiences survey). 7 Similarly, the International Classification of Diseases (ICD) coding system has added codes to document SNs identified by health care professionals in different settings. 8
The International Classification of Diseases, 10th revision (ICD-10) codes for identification of SNs 8 provide a standardized framework to identify patients with such needs. However, the ICD codes are still underutilized in practice and are often incompletely captured in administrative claims or electronic health records (EHRs) data. 9 Moreover, although collecting SNs ICD codes is increasing in Medicaid patients, evidence on integration and operationalization of these codes in claims and EHRs is sparse. 10,11
Comparing prevalence of SNs coding in common health care data sources such as claims and EHRs is key to developing a consistent approach in identifying patients at high risk of poor health outcomes and better manage their care. Moreover, estimation of association of these documented SNs codes with health care utilization and costs is important for Medicaid programs before incorporating them in routine risk adjustment or performance metrics for payment models to better reflect risk profiles of their patients. 12 Few studies have examined the relationship between wide array of SNs captured by ICD-10 codes and health care utilization and costs. Such information may guide organizations and policy makers to develop interventions to address SNs within the health care system.
This study compared documentation of ICD-10 SNs codes in claims and EHRs data of a Medicaid population, followed by assessment of their association with health care utilization and cost outcomes. More specifically, this study included the following aims: (1) comparing prevalence of ICD-10 SNs coding in claims and EHRs data of a Medicaid population and (2) assessing impact of documented ICD-10 SNs codes on prediction models of health care utilization and cost outcomes for study population across claims, EHRs, and claims plus EHRs data.
Materials and Methods
Study design and data sources
This is a 2-year retrospective cohort study of patients continuously enrolled for more than 1 month in the Johns Hopkins Medicaid-managed care plan in 2018 and 2019. Claims and EHR data were used of patients enrolled in a Medicaid-managed plan, called Priority Partners, offered by the Johns Hopkins Medical Institute. Claims data included enrollment information as well as medical and pharmacy claims records consisting of ICD-10 diagnosis, procedure codes, prescription drugs, provider type, location of service, and paid amount for services and medications. EHRs data included encounter diagnosis, medication orders, procedures, location of services, and provider information.
The baseline study population included 305,433 enrollees with 1+ month continuous enrollment in 2018–2019, out of whom 49,471 had data in their EHRs. Enrollees with age 65+ years were excluded due to unavailability of Medicare claims data. Moreover, enrollees without any outpatient visits in 2018 were excluded (n = 10,203) as they did not have any diagnosis codes in claims to assess their health status or SNs. Final study sample consisted of 39,267 patients. The study was approved by the institutional review board of Johns Hopkins Bloomberg School of Public Health.
Study variables
Independent variables
SN marker was developed as a binary variable with yes/no indicator, suggesting presence or absence of ICD-10 codes in any of the following 5 SN domains: social, economic, education, health care system, and physical environment. Each of 5 SN domains contained a separate marker with a yes/no indicator, suggesting presence or absence of any corresponding mapped ICD-10 codes to 13 SN subdomains including social–social connection/isolation, safety, stress, race, military, migration, and incarceration; economic–employment, finances, and nutrition; education–education; health care system–access to health care; and physical environment–housing.
To map ICD-10 SN codes to domains and subdomains, the authors used comprehensive set of codes across 4 major terminology systems that were developed previously to document SNs screening and assessment across multiple domains in health care system. 13 Two subject matter experts in the team reviewed codes and grouped them to 5 domains and 13 subdomains. Each of the SN variables were constructed from 2018 data from claims, EHRs, and claims plus EHRs data separately.
Outcome variables
The outcome variables included 2 health care utilization variables using claims data in concurrent (2018) and prospective (2019) years: (1) hospitalization defined as presence of any acute care inpatient hospitalization due to causes other than childbirth or injury and (2) emergency department (ED) visits defined as presence of any ED visit that did not lead to a subsequent hospitalization. The outcome variables also included 3 cost variables from claims data assessed in concurrent (2018) and prospective years (2019): total cost, medical, and pharmacy costs.
Medical costs were calculated by adding paid and out-of-pocket amount for medical claims. Similarly, pharmacy costs were derived from pharmacy claims. Total costs were calculated by summing medical and pharmacy costs. Owing to high skewness, costs variables were winsorized at top 1%, where patients with costs above 99th percentile are transformed to costs of patients in 99th percentile, to avoid undue impact of outliers on estimates and improve precision and efficiency of regression models. 14
Predictor variables
The predictor variables included age, gender, and morbidity variables derived from year 1 (2018) claims diagnosis data. Morbidity variables were obtained from the Johns Hopkins Adjusted Clinical Groups (ACG) Systems version 12 and included Aggregate Diagnosis Groups (ADGs) and ACG risk scores. 15,16 The ADGs are groupings of ICD diagnosis codes into 32 diagnosis groups based on similarity of clinical criteria and expected need for health care resources. The ACG risk scores or Diagnosis Prediction Model (Dx-PM) scores have been shown to be a valid measure of morbidity and derived from various ACG morbidity metrics including age, gender, hospital dominant conditions markers, pregnancy indicator, frailty, and group of chronic disease markers. 17 The study also included Charlson comorbidity index derived from ICD codes from 2018 claims data. 18,19
Analysis plan
Study analyses were performed at the patient level. The characteristics of patients and patterns of health care utilization and cost for those with and without SN ICD codes across all 3 data sources—claims, EHRs, and claims plus EHRs—were assessed. Prevalence of documented ICD codes mapped to 5 SN domains and 13 subdomains across the data sources was compared. Top 10 ICD SN codes in claims and EHRs data as well as top 5 ICD codes within each SN domain were summarized.
To assess the impact of SN variables on health care utilization and costs in years 1 and 2, logistic regression (for utilization outcomes) and linear regression (for cost outcomes) modeling were performed, after controlling for independent variables in year 1. The study included SN marker, operationalized as yes/no variable depending on presence of at least 1 SN ICD code. This study also included secondary variable of SN count, operationalized as 0, 1, and ≥2 based on number of documented SN ICD-10 codes.
To assess improvement of model performance in predicting health care utilization and cost, model performances were compared before and after adding SN marker to 3 base models (ie, demographic, Charlson, and ACG risk score) across 3 data sources. The adjusted R2 was used to assess performance of linear regression models across 3 base models (ie, demographic, Charlson, and ACG risk score) and respective 3 SN marker-enhanced models. Similarly, performance of logistic regression models was measured by comparing area under the curve (AUC) across base (demographic, Charlson, and ACG risk score) and SN marker-enhanced models. Bootstrapping was performed with 200 runs to obtain point estimates and 95% confidence intervals for all performance measures.
All the study analysis were performed using R software version 4.0.1 (R Foundation for Statistical Computing, Vienna, Austria).
Results
The study population included 39,267 Medicaid-managed care patients with 63% females, 51% Black race, and mean age of 26 years (±18.2) with 0–17 and 18–34 years age categories constituting 41% and 27%, respectively. The percentage of patients with at least 1 SN code was higher in EHRs (n = 5177, 13%) than in claims (n = 4297, 11%). Claims–EHRs combined data source identified 17.6% (n = 6910) patients with at least 1 SN code (Table 1).
Characteristics of Study Population, Health Care Utilization, and Costs Distribution Across Those With and Without Documented Social Needs in the 3 Study Data Sources
ACG Dx-PM, Adjusted Clinical Groups Diagnosis Prediction Model scores (the ACG risk scores or Dx-PM scores are derived from various ACG morbidity metrics including age, gender, hospital dominant conditions markers, pregnancy indicator, frailty, and group of chronic disease markers); ADG, Aggregate Diagnosis Groups (groupings of ICD-10 diagnosis codes into 32 diagnosis groups based on similarity of clinical criteria and expected need for health care resources); ED, emergency department; EHRs, electronic health records; SD, standard deviation; SNs, social needs.
The documentation of SN ICD-10 codes varied across data sources such that out of total 6910 patients with at least 1 SN code, 1733 (25%) patients had SNs documented only in claims, 2613 (38%) patients only in EHRs, and 2564 (37%) patients with SN codes in both claims and EHRs (Fig. 1). Those with SN codes were relatively older (claims mean age: 28 vs. 26 years), had less female (EHRs: 59% vs. 63%), and higher percentage of Black race (EHRs: 58% vs. 50%) across all 3 data sources.
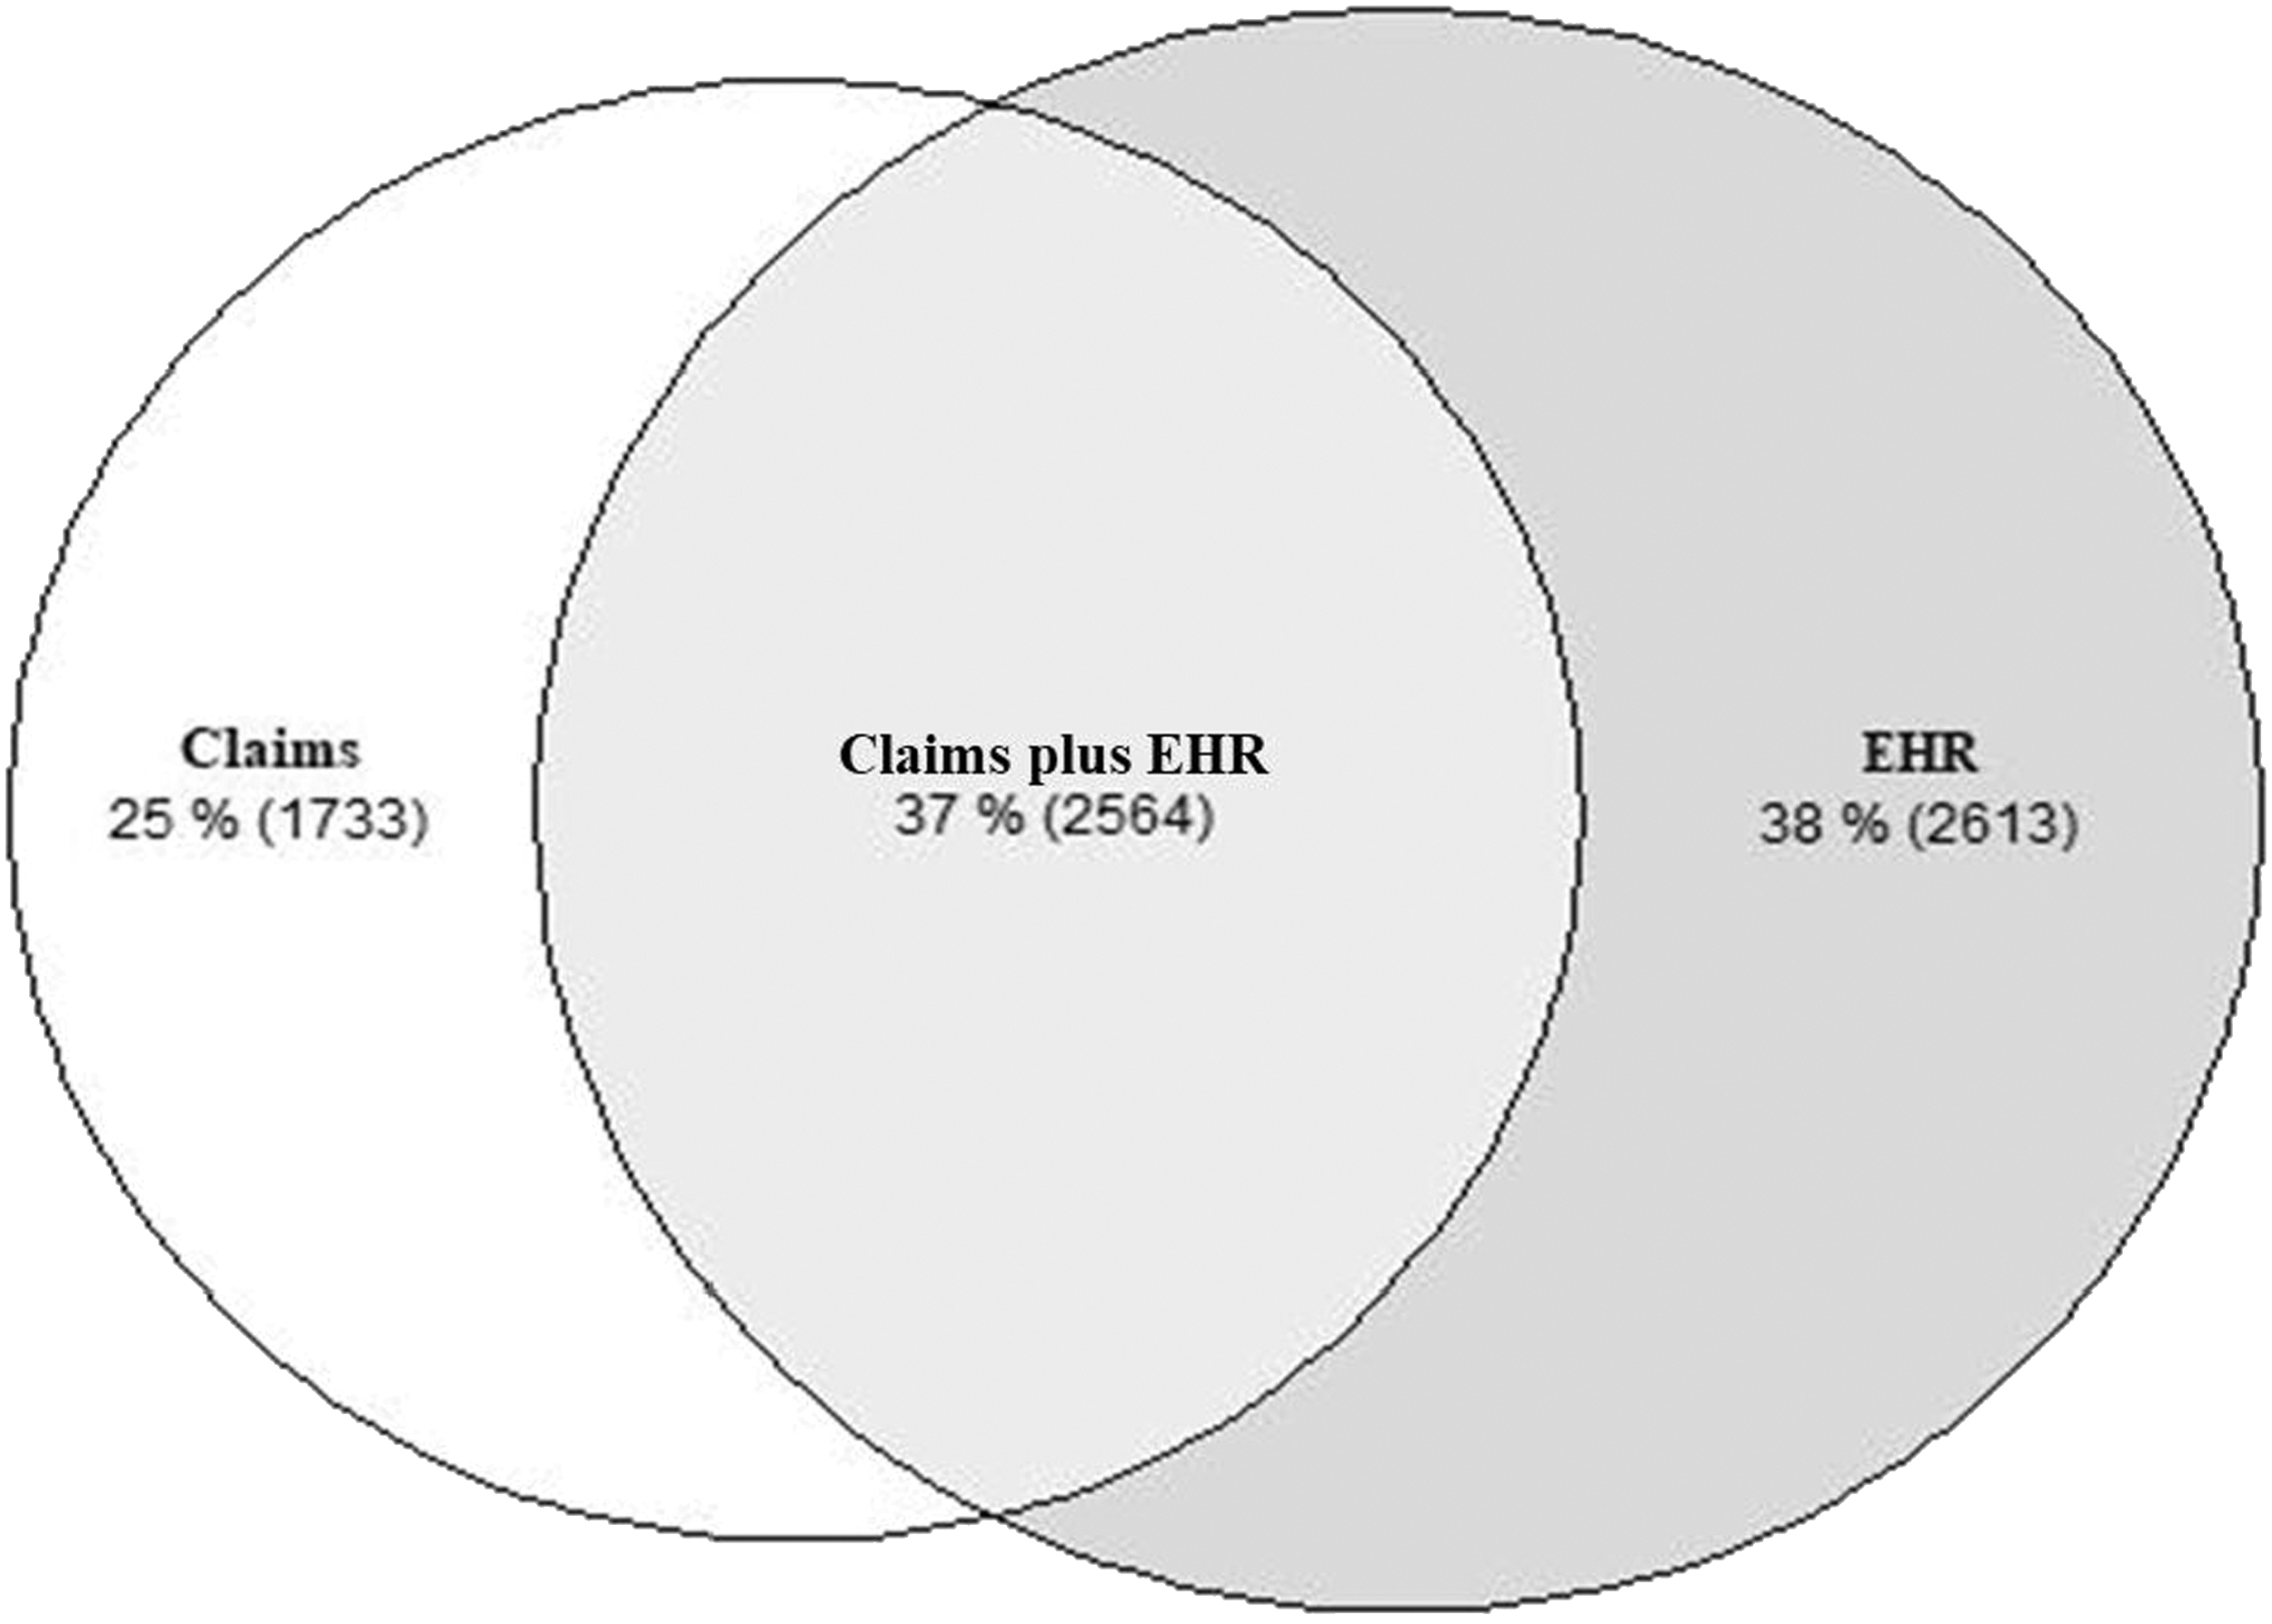
A Venn diagram depicting prevalence of International Classification of Diseases, 10th revision social needs codes across EHRs, claims, and overlap section of both data sources for the study population in 2018 (N = 6910). EHRs, electronic health records.
The burden of comorbidity was greater in those with documented SN codes than in those without: higher mean ADGs (claims: 9 vs. 6), higher Charlson Comorbidity Index (claims: 1.38 vs. 0.65), and higher ACG Dx-PM Risk Scores (claims: 3.8 vs. 1.6) across all 3 data sources (Table 1). Health care utilization and costs were higher in patients with SN codes. Patients with SNs had almost 3 times rates of hospitalization compared with those without, whereas this rate was 1.8 for ED visit with mean ED visit count of 1.7 (±4) versus 0.6 (±1) in claims data. Similarly, for total health care costs, those with SNs had mean costs of $5114 (±8099) compared with $2715 (±5398) for those without documented SNs in claims data (Table 1).
The most documented SNs domain was social domain (claims: 7.8%, EHRs: 9.6%, and claims plus EHRs: 12.6%) with safety subdomain being most prevalent in study population (claims: 6.1%, EHRs: 7.8%; claims plus EHRs: 10.1%). This was expected as 77% of ICD-10 SN codes are mapped to social domain within which safety subdomain includes most of ICD-10 codes (Supplementary Table S1). The next prevalent SNs domain varied by data source. For example, in claims, health care system domain was documented in 2.3% of patients, whereas in EHRs, economic domain was documented in 2.4% of patients (Table 2).
Prevalence of Social Needs Marker, Domains, and Subdomains in Claims, Electronic Health Records, and Claims Plus Electronic Health Records Data in the Study Population in 2018
Reporting number and percentage of patients.
Top ICD codes documented within each of 5 domains were relatively consistent across claims and EHR data set. For example, in claims, the top 2 documented ICD-10 codes for each of domains were social (S09.90XA-unspecified injury of head, R46.89-other symptoms and signs involving appearance and behavior), economic (Z72.89-other problems related to lifestyle, E63.9-nutritional deficiency, unspecified), health care system (Z76.89-persons encountering health services in other specified circumstances, Z91.14-patient's noncompliance with medical treatment and regimen), physical environment (Z59.0-homelessness, Z77.0-contact with and [suspected] exposure to hazardous, chiefly nonmedicinal, chemicals), and education (Z55.9-problems related to education and literacy, unspecified, Z55.8-other problems related to education and literacy).
In contrast, in EHRs data, the top 2 documented ICD-10 SN codes were social (X58-exposure to other specified factors, R46.89), economic (Z72.89, Z56.0-unspecified problems related to employment), health care system (Z76.89, Z91.14), physical environment (Z59.0, Z59.9-problem related to housing and economic circumstances, unspecified), and education (Z55.9, Z55.8) (Supplementary Table S2).
The SN marker improved prediction of ED visit and hospitalization outcomes for demographic-only model across all 3 data sources with AUC increasing between 2 and 4 percentage points (eg, using claims data, absolute AUC increased from 0.57 to 0.61 for ED visits and from 0.64 to 0.67 for hospitalization in concurrent models; Table 3). However, adding SN marker to Charlson model modestly improved ED visit prediction of both concurrent and prospective models. For example, while using combined EHRs and claims data, adding SN marker increased AUC of concurrent prediction models of ED visits from 0.61 to 0.63 in 2018.
Impact of Social Needs Marker on Predicting Health Care Utilization in the Study Population
Reporting AUC (95% CI). AUC (95% CI) was generated using 200 bootstrap runs. Bolded estimates are statistically significantly different between base and SN marker-enhanced models.
AUC, area under the curve; CI, confidence interval.
Integrating SN marker also improved hospitalization prediction in concurrent models across all 3 data sources (eg, increasing from 0.73 to 0.74 in 2018 model using claims data). Similarly, performance of ACG risk score models predicting concurrent and prospective ED visits improved only marginally after adding SN marker (0.66 to 0.67 in 2018 model using claims data), whereas that for hospitalization did not show any improvement across the 3 data sources (Table 3).
For linear regression models, which were developed to predict medical, pharmacy, and total health care costs in 2018 (concurrent) or 2019 (prospective), prediction performance of base demographic model (age and gender) improved modestly across all 3 data sources after adding SN marker for concurrent cost model (Table 4). For example, adjusted R2 for concurrent costs in claims data increased from 10.9 to 12.2. The demographic model was not statistically significantly improved in predicting prospective cost after adding SN marker as the 95% confidence interval of adjusted R2 enhanced model included adjusted R2 of the base model. There was no significant improvement in predictive performance of concurrent and prospective total cost models for both Charlson and ACG risk score models across all 3 data sources (Table 4).
Impact of Social Needs Marker on Predicting Costs Outcomes in the Study Population
Reporting adjusted R2 (95% CI), which was generated using 200 bootstrap runs. Bolded estimates are statistically significantly different between base and SN marker-enhanced models.
Sensitivity analyses included assessment of predictive model improvement after incorporating SNs of patients measured total number of SN codes as count variable (0 SN codes, 1–2 SN codes, and ≥3 SN codes), since the number of patients with more than 2 SN domains and subdomains was relatively small. No significant improvement was detected in model performance after including SN count variable compared with models with binary SN marker (Supplementary Tables S3 and S4).
Discussion
Health care providers and payers are increasingly collecting SNs data in EHRs and claims to better manage their patient populations. The value of individual-level SNs data in risk stratification, however, has not been assessed across different data sources. Given the importance of SNs assessment among Medicaid population, and to address the lack of social marker integration in risk-stratification models, this study used a linked data source of administrative claims and EHRs data to provide valuable insight about prevalence of individual-level SNs among Medicaid patients and its impact on predicting health care utilization.
A relatively higher documentation of SN ICD-10 codes was observed (EHRs: 13%, claims: 11%, and combined claims and EHRs: 17.6%) compared with past studies focusing on documentation of ICD-10 SNs Z-codes in Medicare fee-for-service population (eg, claims: 0.96%) and single-state general population (EHRs: 2.03%). 11,20 A difference in pattern of association between SNs and health care utilization was found such that adding SNs to prediction models improved prediction of ED visits for demographics-only model across all 3 data sets, but magnitude of prediction improvement was modest for diagnosis-based models (ie, Charlson and ACG risk score models).
The direction of association between those with SNs and health care utilization of ED visit is similar to other studies on Medicaid population. 21 –23 Similarly, SN marker improved hospitalization prediction models for demographics-only models across the 3 data sets, whereas improvement of diagnosis-based models was modest. This study did not find a significant impact of SNs in predicting health care costs.
Providers and health care organizations are increasingly held accountable for improving population health while also reducing overall health care expenditure, even though majority of SNs that contribute to these outcomes are exogenous to the medical system. Among other patient populations, patients in Medicaid programs experience health disparities and poor health outcomes partially due to their significantly higher SNs. 1 Thus, Medicaid programs across country now require MCOs to assess SNs of their patients and to implement initiatives to address needs identified during screening. 24
Moreover, several Medicaid programs across different states have developed various value-based payment models and performance systems that incorporate SN metrics in diagnosis-based prediction models. 2,4 Hence, accurately documenting SNs in available data sources in health care systems and understanding their impact on prediction of health care utilization and costs are important to identify high-risk patients and to develop interventions to better manage their care.
This study examines impact of adding SNs captured through ICD codes to diagnosis-based models to predict ED visits, inpatient hospitalization, and health care costs outcomes. The authors observe that addition of SNs information leads to improvement in performance of risk-adjustment models for ED visits and might suggest that patients with SNs were less likely to afford seeking health care services in ambulatory setting such as a primary care office, given lack of comprehensive health insurance and cost burden; therefore, they were more likely to use ED as their regular source of health care.
Future studies should be undertaken assessing impact of adding SN data on predicting “avoidable” ED visits, representing a visit with conditions or symptoms that can be treated in a regular outpatient visit, which might further show that utilization of ED services for patients with SNs could be a replacement for ambulatory health care services. 25 Similarly, this study finds that adding SNs to demographic-only and Charlson comorbidity score model modestly improved performance of prediction models for inpatient hospitalization.
The study findings of improvement in predictive models of health care utilization outcomes by integrating information on SNs from EHRs are similar to findings of various studies included in a recent systematic review, showing significant improvement in predicting various health outcomes such as hospitalization risk, 30-day rehospitalizations, and medication adherence by including information on SNs of patients. 26 This suggests that accurately documenting SNs using ICD codes might be a feasible method to systematically capture needs of patient population and could be leveraged by health care organizations and policy makers to incorporate in risk-stratification and risk-adjustment initiatives.
The study results also suggest that medical diagnosis markers (ie, models using Charlson and ACG Dx-PM scores) were better predictors of ED visit, hospitalizations, and health care costs than SN marker variable alone (when compared with combined model of demographics and SN markers). Moreover, when SN marker variable is added to medical diagnosis models, prediction performance of model improves only modestly for ED visits and inpatient hospitalizations but shows no significant improvement for total costs, medical costs, and pharmacy costs models. This suggests that impact of documented SN marker and medical diagnosis markers on prediction accuracy may be confounded.
One possible explanation could be that medical conditions drive both health care utilization and provider documentation of SNs simultaneously. For example, individuals with unstable living conditions resulting from homelessness are associated not only with higher medical conditions and health needs but also higher use of ED visits and frequent admission to hospital than the general population. However, controlled studies of housing interventions have shown no significant impact on reduction in ED visits and hospitalization rates in patients with mental illness and mixed based on baseline health needs. 27,28 Future studies should evaluate mechanistic process by which SNs, single domain or combined, impact health care utilization in different patient populations.
This study leverages both EHRs and claims data to compute a more comprehensive estimated prevalence of SNs rather than using billing codes only. The study findings can provide broader applications given that it described association of a constellation of SNs on health care utilization and costs. Thus, with increasing interest in integrating SNs assessment in clinical care and lack of optimal approach to risk screenings, this study demonstrated that ICD codes corresponding to different SN domains could be potentially retrieved from both claims and EHRs data, thus helping to identify patients with high overall social risk.
The SN codes would also enable health care systems to effectively target interventions and not rely solely on community-level SDOH data that pose a risk of ecological fallacy or making biased assumptions about individuals based on aggregated data. 29,30 Health care systems with access to only EHRs data could use these SN ICD codes to improve their ability to predict health care utilization such as ED visits and hospitalizations in those with greater SNs. 31 Moreover, more elaborate technical approaches like natural language processing can be used to identify and extract SNs mentioned in unstructured EHRs data (eg, provider's free-text notes) and thereby improve ability to accurately identify patients with unmet SNs. 32 –34
The findings of this study could be incorporated with the National Academy of Medicine framework for integrating social care into health care delivery and help organizations to improve their efforts in addressing SNs of their patients. 35 Such organizations could increase awareness on SNs of their patients using ICD-10 codes captured during clinical care, adjust their delivery process to account for SNs of their high-risk patients, and develop programs within their health system and in collaboration with community organizations (eg, social services, government resources) to address some of identified SNs associated with increased utilization and costs.
Future research should examine association of clusters or combinations of multiple SNs over longer periods of time with health outcomes in different patient populations (eg, patients with diabetes, cancer, or pregnancy). Moreover, research should also be undertaken to determine the distinct influence of different SNs on a range of health outcomes such as 30-day readmissions, 36 medication adherence, adverse pregnancy outcomes, 37 and use of preventive services to tease out mechanistic processes through which SNs impact health outcomes and to develop targeted interventions to address such needs.
Limitations
Several factors might limit generalizability of this study findings. The study population came from a single Medicaid-managed care plan within a defined geographic location, and prevalence of SNs may be different than other Medicaid population. SNs were measured for study sample only using ICD-10 codes in claims and EHRs data. There might be important gaps in capturing all SNs of a patient, which could not be quantified in the study by solely using ICD codes. Different challenges and barriers at the provider, health care systems, insurance, and patients' level might have resulted in low utilization of ICD codes to capture SNs.
Moreover, significant gaps exist in identifying patients with SNs and to estimate the prevalence of SNs among patients at population level including heterogeneous screening tools capturing different social domains with limited interoperability and infrequent documentation within EHRs in mostly nonstandard format. One study 21 of Louisiana state's largest Medicaid-managed care plan showed that 55% (n = 5681) of their Medicaid population self-reported having at least 1 unmet SNs on SDOH assessment, whereas another study 38 of safety-net hospital's federally qualified health centers in Indianapolis showed that 53% patients (n = 38,563) needed SNs services.
Similar prevalence rates (54% with at least 1 unmet SN) have been reported in a sample of low-income adult respondents to SDOH module of the 2017 Behavioral Risk Factor Surveillance System from 12 US states. 39 Thus, this study might have underestimated the actual prevalence and types of SNs in the patient population leading to biased estimates and potentially limiting use of these codes for risk-adjustment models. SNs were assigned to an individual based on ICD-10 codes documented in their EHRs in a single year. This could lead to biased estimates of association between SNs and health care utilization and costs if SNs changed over time.
A number of studies have documented lower levels of health care utilization in racial/ethnic minority population due to additional barriers they face while accessing care. Hence, association of SNs with health care utilization observed in this study may be underestimation as we did not include race/ethnicity variable in prediction models. Future studies should explore correlation between SNs and race/ethnicity in prediction models of health care utilization and costs. The study population included mostly younger population and none over 65 years as we did not have access to Medicare claims data. Older adults may have higher levels and different domains of SNs than their younger counterparts, hence future studies should assess and validate value of SNs in risk-stratifying elderly populations.
Conclusions
This study leveraged a combined claims and EHR database of patients receiving health services under a large Medicaid-managed care plan in Maryland. Despite relatively low prevalence of documentation of SN ICD-10 codes in claims and EHRs data, the study population included patients with wide ranges of SNs, demographics, and health care utilization, providing a distinct opportunity to examine association of SNs with health care outcomes and costs. The study findings provided a promising path to move forward with efforts to capture and integrate patient's SNs in health care delivery systems. Medicaid programs are increasingly using social risk assessment surveys to capture structured data from beneficiaries. 40
Such data can be mapped to SNs domains using standardized codes and utilized for risk stratification and population health management activities. This study findings could be applied by care management programs to expand SNs interventions to high-risk patients with chronic disease burden and provide guidance to health care organizations to improve screening for SNs using various data sources. Such approach would help health care organizations to develop care coordination activities and providing assistance programs and referrals to social services to meet the needs of their patients.
Footnotes
Acknowledgments
The article references the ACG system. Johns Hopkins University holds the copyright to the ACG System and receives royalties from the global distribution of the ACG system.
Authors' Contributions
Dr. Pandya served as the principal investigator of the project. Dr. Pandya, Dr. Hatef, and Dr. Kharrazi designed the study and selected the appropriate methodology for the evaluation. Dr. Pandya and Mr. Wu performed the analysis. All authors reviewed the results and contributed to the interpretation of the results. Dr. Pandya and Dr. Kharrazi drafted the article. All authors reviewed the article before submission.
Author Disclosure Statement
No competing financial interests exist.
Funding Information
No external funding supported this study. All authors are Johns Hopkins employees. The Johns Hopkins University receives royalties for nonacademic use of software based on the Johns Hopkins ACG methodology.
Supplementary Material
Supplementary Table S1
Supplementary Table S2
Supplementary Table S3
Supplementary Table S4
References
Supplementary Material
Please find the following supplemental material available below.
For Open Access articles published under a Creative Commons License, all supplemental material carries the same license as the article it is associated with.
For non-Open Access articles published, all supplemental material carries a non-exclusive license, and permission requests for re-use of supplemental material or any part of supplemental material shall be sent directly to the copyright owner as specified in the copyright notice associated with the article.
