




Abstract
The objective of this empirical exercise was to examine how drug providers in states that implemented the Medicaid expansion in 2014 reacted to the expansion compared with providers in states where Medicare was not expanded. Medicaid beneficiaries have been susceptible to higher cost and lower quality of health care. The Affordable Care Act increased access to drugs for uninsured people. Numerous studies highlighted the effects of the Medicaid expansion on beneficiaries. However, there is a gap in the literature that looks at prescription behavior of physicians during the Medicaid expansion that compared expanded states versus nonexpanded states. A difference-in-differences regression was used to estimate the average treatment effect of implementing the Medicaid expansion on each of the 6 outcomes of interest: (1) total cost of prescribing drugs, (2) number of total drug claims for non-Medicaid beneficiaries, (3) number of drug claims for Medicaid beneficiaries, (4) number of beneficiaries, (5) number of beneficiaries who were 65 years old or older, and (6) ratio of brand-name drugs. To address potential estimation biases, a matching procedure was used to ensure that pre- and post-Medicaid period trends were parallel. Our results provide evidence that, on average, the Medicaid expansion led each provider in expanded states prescribed more drugs for beneficiaries with low-income subsidies, whereas prescribed less drugs for other beneficiaries including those over 65 years old. The authors also show the proportion of brand-name drugs prescribed by a provider in expanded states declined due to the implementation of the Medicaid expansion. These results suggests that the Medicaid expansion has contributed to increasing access to health care by low-income citizens who were in need of prescriptions.
Introduction
On July 30, 1965, President Lyndon B. Johnson signed into law Medicaid (a government health care entitlement program for categories of poor, senior, and disabled citizens) and Medicare (a government health care entitlement program for seniors through Title XIX of the Social Security Act). Funded by both states and the federal government, Medicaid provides medical assistance to those individuals who meet the terms of eligibility. Medicaid is funded by cost sharing between the federal and state governments. Although Medicaid was established to aid citizens who could not afford health insurance, it is presently the largest health care coverage program in the country. 1
In May 2021, nearly 82 million people were insured through Medicaid. 2 Medicaid covers numerous types of health services. Some of the mandatory services include inpatient, outpatient, nursing home, physician, and transportation services, whereas some of the optional services include prescription drugs, dental services, and eye services. 3 Two-thirds of Medicaid expenditures support the health care and long-term care of the elderly and disabled, who make up 25% of Medicaid beneficiaries. Medicaid spending on children is only 20% of total Medicaid spending. 3 The program is also the principal source of long-term care coverage for Americans. 3 As the nation's largest insurer, Medicaid provides substantial financing for hospitals, physicians and physician services, community health centers, nursing home facilities, and jobs in the health care sector.
The Affordable Care Act (ACA) was put into effect in 2014, and the act expanded coverage to people with incomes below 138% of the federal poverty level (FPL). This was called the Medicaid expansion. Medicaid was expanded from 100% to incomes below 138% of the FPL, small businesses, and individuals with incomes between 100% of the statutory threshold and 133% of the FPL. However, 5% of an individual's income is disregarded, making 138% the practical threshold. 1 States played an important role in the expansion. Because of a supreme court ruling in 2012, states had the option of expanding Medicaid in their states.
Medicaid is the provider of last resort for the poor and disabled. During economic downturns, more people lose their employment-based health insurance protection, making more individuals and families Medicaid eligible and ultimately causing them to rely on public health programs to obtain health care. Medicaid thus involves a countercyclical relationship between unemployment and the number of Medicaid beneficiaries. This countercyclical government spending is linked to protect household income and promote the stimulus of economic activity. 4
Although vast amounts of literature are available on the benefits of expanded Medicaid to health care, there is a gap in the literature on the Medicaid expansion and its impact on provider and prescription drug payments. The authors used a natural quasi-experimental method to determine whether state expansions of Medicaid were associated with prescription drug payments. They hypothesized that Medicaid expansion would have an effect on prescription drug payments. Specifically, this article utilized a difference-in-differences approach to compare 6 outcome variables between states with and without the Medicaid expansion to examine the effect of the expansion on drug providers' prescribing practices.
The assumption underlying this approach was that health care trends in states with the Medicaid expansion would be different from those without the expansion. Because the Medicaid expansion resulted in a large increase in health care access for Medicaid-eligible recipients, the authors hypothesized it would have a significant impact on prescription drug payments as well. 5
Methods
When examining the impact of an implementation or intervention within health policy, the question is how to determine whether implementing the intervention caused the impact. The authors used a quasi-experimental design that incorporated the implementation of the Medicaid expansion to compare states with the Medicaid expansion that went into effect in 2014 and without it. They used data on drug prescribers and applied a difference-in-differences approach to examine how prescribers in states that implemented the Medicaid expansion responded to the Medicaid expansion in terms of their prescribing practices to beneficiaries. The data used in this study were provided by ProPublica; they covered annual data on the number of beneficiaries and the volume and cost of drugs prescribed by each prescriber from 2011 to 2016.
The basic difference-in-differences method can be applied where outcomes are observed for 2 groups (a treatment group and a control group) for 2 time periods (preperiod and postperiod). The treatment group is exposed to a treatment in the postperiod, but not in the preperiod. The control group is not exposed to the treatment during either period. In this study, the preperiod (postperiod) was from 2011 to 2013 (from 2014 to 2016) and the treatment group (control group) was a group of prescribers in the states with (without) the Medicaid expansion.
The difference-in-differences estimator, or the average treatment effect of the Medicaid expansion (ie, the impact of the Medicaid expansion) on an outcome, was estimated by subtracting the average difference in the outcomes between the 2 periods for the control group from the average difference for the treatment group.
States with and without Medicaid expansion
States that implemented the Medicaid expansion in 2014 without approving Section 1115 waivers were defined as states in the treatment group (Delaware, Hawaii, Kentucky, Maryland, Massachusetts, New York, North Dakota, Oregon, Rhode Island, Vermont, Nevada, West Virginia), whereas states that had not yet implemented the expansion by 2016 without approving Section 1115 waivers were defined as states in the control group (Alabama, Florida, Georgia, Idaho, Kansas, Maine, Missouri, North Carolina, Oklahoma, South Carolina, Oklahoma, South Carolina, South Dakota, Tennessee, Texas, Utah, Virginia, Wisconsin, Wyoming, Mississippi).
States that implemented the expansion between 2015 and 2016 (Alaska, Indiana) and states that approved Section 1115 waivers to operate the Medicaid expansion during the study period (Arizona, Arkansas, Indiana, Iowa, Michigan, Montana, Nebraska, New Hampshire, New Mexico, Ohio) were excluded from the analysis.
Empirical model
The following empirical equation was estimated:
where subscription i indicates the prescriber and t indicates the year. In addition, y is a dependent variable, Treat is dummy variable that takes a value of 1 if prescriber i works in a state in the treatment group, and Post is a dummy variable that takes a value of 1 from year 2014 to 2016. Furthermore,
For y, 6 outcomes were examined: (1) Cost (total cost paid for all claims), (2) Claim (number of claims for non-Medicaid patients who did not receive a low-income subsidy), (3) ClaimLis (number of claims for Medicaid patients who received a low-income subsidy), (4) Ben (number of beneficiaries under 65 years old who received at least 1 prescription from the provider), (5) Ben65 (number of beneficiaries who were 65 years old or older who received at least 1 prescription from the provider), and (6) Brand/Claim (percentage of brand-name drugs prescribed by the provider).
All variables except (6) Brand/Claim were converted to logarithmic values times 100. For example, the dependent variable regarding cost was ln(Cost) ·100 in the regression analysis so that the treatment effects could be interpreted in percentage terms. The dependent variable for (6) was a share in percentage terms, that is, Brand/Claim ·100 (%).
The authors hypothesized that the Medicaid expansion would have a positive impact on ClaimLis because drugs were made more affordable to patients with incomes between 100% and 138% of the FPL in the states that implemented the expansion. Accordingly, Brand/Claim was expected to decline in the states with the Medicaid expansion because brand-name drugs were not allowed to be prescribed to patients with Medicaid when generic drugs were available. However, it was unclear how the Medicaid expansion affected other outcomes, such as Cost, Claim, Ben, and Ben65.
Data selection
Certain concerns had to be addressed by selection of a valid sample so as to avoid potential estimation bias in the difference-in-differences framework. First, the estimation model assumed that only the Medicaid expansion and common shocks across all providers in the nation could alter the level of outcomes. However, if a provider changed his or her place of work from one to another, outcomes such as the number of beneficiaries and claims could change drastically for reasons other than the Medicaid expansion and common shocks. For this reason, providers who changed their places of work during the study period needed to be excluded.
Therefore, the sample was restricted to providers with a unique zip code from 2011 to 2016. Second, even in the states that implemented the Medicaid expansion, some doctors did not enroll in the Medicaid program. To estimate the impact of the Medicaid expansion, providers in states with the Medicaid expansion who did not enroll in the Medicare program for at least 1 year between 2014 and 2016 were excluded.
On the basis of the above-mentioned panel data on providers, Figure 1 describes per-provider values of the mean, median, 25th percentile, and 75th percentile from 2011 to 2016 for 6 outcomes. Note that the figure shows outcome trends per provider for states both with and without the Medicare expansion. The authors observed overall increasing trends for Cost, Claim, and Ben65 showing that the total cost of prescribing drugs increased nationally because of an aging population, despite the fact that the share of brand-name drugs began declining drastically from 2012. As of 2016, the mean values were ∼$429 thousand for Cost, 4541 claims for Claim, 350 beneficiaries for Ben, 314 beneficiaries for Ben65, 1962 claims for ClaimLis, and 0.23 for Brand/Claim.
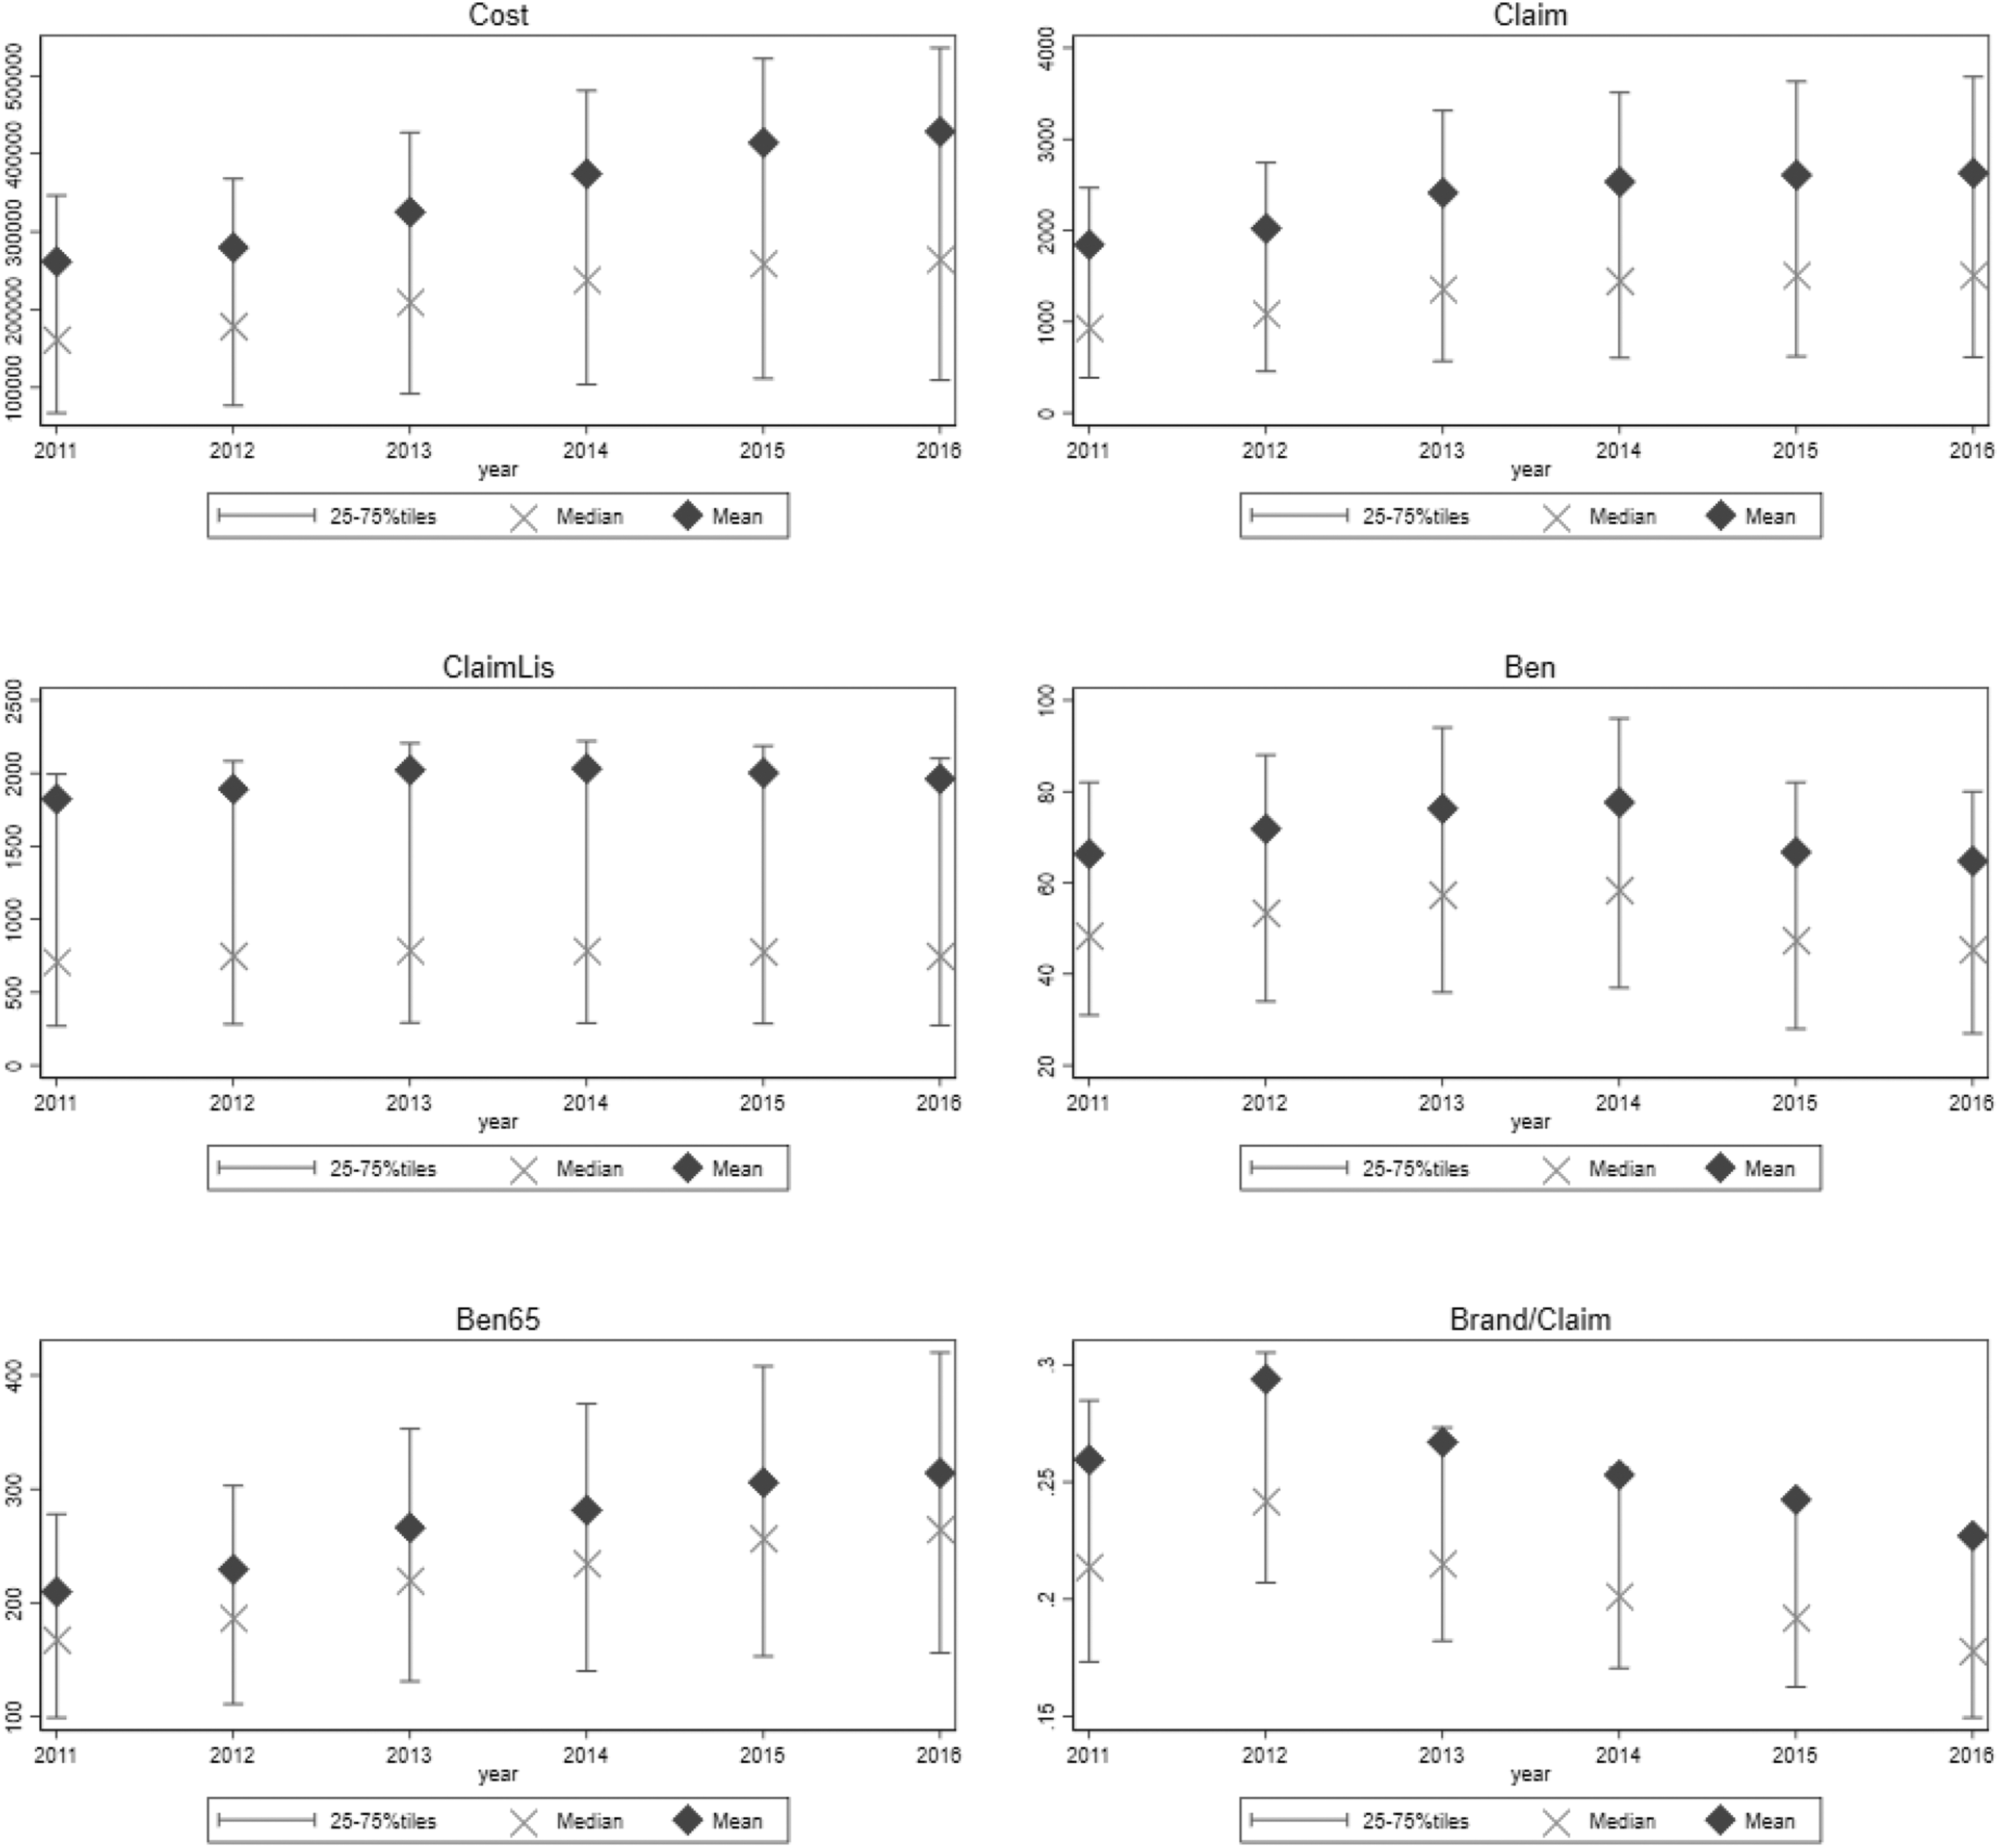
Trends of outcomes.
The third concern was the endogeneity issue that might arise from sample selection bias, in which providers in states that implemented the Medicaid expansion and those in states that did not might be different in nature. The parallel trends assumption is especially key to identifying causality in the difference-in-differences framework. It assumes that outcomes in the treatment group would have had the same trends as those in the control group if the Medicaid expansion was not introduced.
If the outcomes of providers in states that implemented the Medicaid expansion showed a persistent increasing (or decreasing) trend, compared with the outcomes of providers in states that did not, the difference-in-differences estimation would overestimate (or underestimate) the impact of the Medicaid expansion on the outcomes. To address this concern, the following steps were taken to select providers in the treatment group and in the control group that would satisfy parallel trends before the introduction of the Medicaid expansion so as to obtain valid treatment effects under the difference-in-differences approach: Samples were restricted to providers whose data on outcome y were available for the entire study period from 2011 to 2016. The difference in y between 2011 and 2013 was computed for every provider. Because y is a logarithmic value (or a ratio), the difference indicates a growth rate (or an increase in percentage points) of the outcome from 2011 to 2013. With the growth rate computed in step 2, we used one-to-one matching to select a set of providers in states without the Medicaid expansion that had growth rates from 2011 to 2013 similar to those of providers in states with the Medicaid expansion. Steps 2 and 3 were also conducted for the years between 2012 and 2013. Providers in states without the Medicaid expansion that were selected in both sets in steps 3 and 4 were kept as the control group for the estimation. Finally, one-to-one matching was used to select a treatment group that had growth rates from 2011 to 2013 similar to those of providers in the control group in step 5.
This matching procedure generated balanced panel data with the same number of providers for the treatment and control groups, which had similar trends before the Medicaid expansion was implemented.
Estimation Results
Table 1 gives the estimated average treatment effects on the 6 outcomes with the samples selected as described in the previous section. Parallel trends were supported statistically for all the models.
Estimation Results
Indicates a 1% significance; *indicates a 5% significance level in a 2-sided t-test. Numbers in parentheses are provider-cluster robust standard errors. X's in rows of Prescriber-fixed effects and Year-fixed effects indicate that these fixed effects are controlled in the regression.
As shown in column [1], no significant impact on Cost was observed. According to columns [2] and [3], on average, providers in a state that implemented the Medicaid expansion prescribed fewer drugs to non-Medicaid beneficiaries as a result of the Medicaid expansion, whereas they prescribed more drugs to Medicaid beneficiaries, compared with providers in a state that did not implement the Medicaid expansion.
In columns [4] and [5], Medicaid expansion had no significant impact on the number of beneficiaries who were less than 65 years old, whereas it had a significant negative impact on the number of beneficiaries who were more than 65 years old. The number of beneficiaries who were more than 65 years old per provider declined by 0.9% in states with the Medicaid expansion compared with those without the Medicaid expansion. Finally, as shown in column [6], a negative impact on Brand/Claim was observed, as expected. The ratio of brand-name drug prescriptions per provider declined by 23 percentage points in states with the Medicaid expansion relative to states without the Medicaid expansion.
Figure 2 describes the treatment effects by year (with year 2013 as the base year). Note that the impact of the Medicaid expansion on Claim and ClaimLis gradually amplified, whereas the impact on Ben65 remained constant in the postimplementation period. A lagged impact was observed for Brand/Claim.

Treatment effect for the years 2011–2016.
Discussion
These results (in particular, the significant impacts of 2 variables Claim and ClaimLis) documented that the Medicaid expansion led drug providers in states that implemented the expansion to write prescriptions for more patients covered by the care coverage and for fewer patients without the coverage. These results build on previous findings by Baicker et al, 6 indicating that Medicaid coverage was consistent with the preliminary results of the Oregon health care expansion, which showed increases in self-reported health.
Increasing costs of Medicaid coupled with low reimbursement rates may have had an effect on doctors accepting Medicaid patients. Furthermore, the individual mandate may have had an effect on decreasing the number of beneficiaries. The ACA mandated that all individuals in the United States receive health care through health insurance. Pooling risk is a fundamental concept in insurance and combining healthy with sick individuals can offset health care costs incurred by the chronically ill. In theory, if doctors used capitation, the pool of healthy insured individuals would have been larger, thus decreasing the number of beneficiaries seeking medical attention.
Furthermore, reducing financial barriers to care results in increased utilization/treatment rates and reduced out-of-pocket spending. 7 –9 As more patients gained access through Medicaid expansion, the results affirmed our hypothesis that prescriptions would rise too. The results also indicate the status of health among uninsured populations that they are in poorer health. 10 –12
A documented effect of expanding public insurance is that of crowd out. Crowd out is the effect that occurs when individuals drop their existing employer or individual market coverage and instead enroll in Medicaid through the expansion. Crowding out private health insurance can have a negative impact on health overall. The quality of care is well documented to be higher for private health care insurance than for Medicaid. 13 –15
For the variable Brand/Claim, per-provider prescriptions of brand-name drugs decreased in states that implemented the Medicaid expansion compared with states that did not. This result was likely because many states require providers to prescribe only generic drugs when these are available to patients who receive Medicaid coverage.
Conclusion
Previous studies have documented the positive influence of the Medicaid expansion by analyzing data on beneficiaries, such as the reduction in mortality rates, 16 –18 improvement on health outcomes, 19 –21 and increase in access to health care. 22 The purpose of this study was to use a rich data on drug providers and to add evidence on the impact of the Medicaid expansion to the existing body of the literature by examining prescribing behaviors of drug providers. The authors hypothesized that the Medicaid expansion would influence providers, drugs prescriptions, and patients in states with the Medicaid expansion in the way that has been implied by the previous studies.
The result from the difference-in-differences analysis on the study variables of interest reveals that drug claims for low-income patients per provider increased due to the Medicaid expansion. The authors also find providers in expanded states reduced the proportion of brand-name drugs after the implementation of the expansion compared with providers in nonexpanded states. These results support, from providers' data, that the evidence that the Medicaid expansion has contributed to increasing access for low-income patients who were in need of prescriptions to the health care.
Medicaid expansion may be among the most important means of access to health care due to the status of health among the uninsured population. The broader implications of our results indicate that the uninsured population, who were not covered by Medicaid, benefited from the Medicaid expansion. In addition, because other states have adopted the Medicaid expansion since 2014, future research should consider the current climate of the Medicaid expansion.
Authors' Contributions
Dr. Kim contributed to data curation, investigation, conceptualization, writing—original draft, writing—review and editing, supervision, project administration, funding acquisition, visualization, and methodology. Dr. Sadayuki took care of software, formal analysis, and methodology.
Disclaimer
Parts of the introduction was part of the corresponding author's dissertation.
Footnotes
Author Disclosure Statement
No competing financial interests exist.
Funding Information
Authors disclose funding was provided by Lehman College for the purchase of data through Propublica.