




Abstract
Health care systems continue to struggle with preventing 30-day readmissions to their institutions. Social determinants of health (SDOH) are important predictors of repeat visits to the hospital. In many health systems, SDOH data are limited to those variables that are most relevant to care delivery or payment (eg, race, gender, insurance status). Despite calls for integrating a more robust set of measures (eg, measures of health behaviors and living conditions) into the electronic health record (EHR), these data often have missing values necessitating the use of imputation to build a comprehensive picture of patients who are likely to return to the health system. Using logistic regression analyses and imputation of missing data from 2017 to 2018, this study uses measures found in the EHR (eg, tobacco use, living situation, problems at home, education) to assess those SDOH that might predict a return to the emergency department within 30 days of discharge from a health system. In both imputed and raw data, the total number of recorded health conditions was the most important predictor and collectively SDOH variables made a relatively small contributions in determining the likelihood of a return to the hospital. Although SDOH variables might be important in the design of programs aimed at preventing readmissions, they may not be useful in readmission predictive models.
Introduction
Reducing preventable hospital readmission continues to be a goal for many health systems. The Centers for Medicare and Medicaid Services (CMS) established a hospital readmission reduction program that penalized hospitals with high rates of readmission and has had some influence on hospital efforts to reduce readmissions. 1,2 The emergency department (ED) is a major source of inpatient admissions to hospitals in the United States. Out of ∼130 million visits to the ED in 2018, 16.2 million resulted in an inpatient admission. 3
ED visits account for ∼82% of unscheduled hospital admissions and 50% of readmissions. 4 Patients report that they go to the ED because they are uncertain and fearful about their health symptoms and are unable to obtain timely outpatient care. 5 An understanding of the characteristics of patients who return to the ED after discharge will contribute to the development of appropriate responses to reduce unnecessary hospital admissions and readmissions.
Social determinants of health (SDOH) are those factors that can have a direct relationship on health and well-being and include living and working conditions, individual health behaviors, and access to medical care. 6 Research has shown that measures of SDOH including socioeconomic status, the environment and community, social supports, and health care access are linked to mortality and morbidity, rates of health care utilization, and other health outcomes. 6 –10 And, in acute care settings, SDOH are shown to be important predictors of inpatient admissions, readmissions, and visits to the ED. 5,11 –14
Recent studies that also examined the efficacy of SDOH in predicting health care utilization showed value of SDOH in improving the prediction of ED admissions. Increasingly, there are calls for integrating a more robust set of SDOH measures into the electronic health record (EHR) that include the full range of a patient's living experiences including factors such as housing and food insecurity, transportation needs, stress, employment status, income, and utility needs 15,16 ; however, these data often have a high percentage of missing values. 17,18 Regardless of how insufficient or biased the data might be, health systems will need to use SDOH data to better understand their patients and, in the development of programs, to address their social needs. 19
Collecting all the traditional and expanding SDOH may be limited by time. Alternatively, identifying and collecting a limited number of critically essential SDOH variables in the EHR may provide just as much actionable information. 19 In addition, some studies focused on clinical variables captured in the EHR have suggested that various imputation methods or weighting techniques can help address concerns about missing data and allow health systems to use all SDOH data that are available. 20,21
There are many conceptual or theoretical models that help to describe the associations between SDOH and health care utilization and health outcomes or health status. 6,22 For example, Healthy People 2020 identifies 5 key SDOH: neighborhood and built environment, health and health care, social and community context, education, and economic stability. 22 For this study, the authors were primarily guided by the Braveman et al description of the Robert Wood Johnson Foundation (RWJF) model of “upstream” and “downstream” determinants. 23 Upstream determinants are those factors that represent the underlying causes of the downstream determinants and include economic opportunities and social resources and living and working conditions. 23
Downstream determinants are those factors that have a direct impact on health and include access to medical care and personal behaviors. 23 The comprehensive set of variables captured by the Academic Health Science Center (AHSC) EHR allows the authors to include representative measures from each of the RWJF domains (Table 1). The causal pathways linking SDOH to health are complicated and complex and must also include factors that are unique to individuals such as educational attainment, income, age, race, gender, and other variables of interest.
Measures of Social Determinants of Health in the Academic Health Science Center Electronic Medical Record
For example, Braveman and Gottlieb highlight the role of education and its association with knowledge of health conditions, work and the work environment, sense of control, and access to social supports. 6 As such, Table 1 provides the measures of SDOH by RWJF domain as aligned with the variable as collected in the EHR.
This study makes 2 significant contributions to the literature on SDOH and risk of returning to the ED after discharge from the hospital or ED. First, as described hereunder, an expansive view of SDOH is adopted that not only considers race, ethnicity, gender, and income, but also incorporates living situation, access to food and nutrition, and health behaviors. These potentially important predictors are generally captured in EHRs and allow for consideration of the relative importance of each variable in predicting the likelihood of a return to the ED within 30 days of discharge.
Second, this study was conducted in a real-world setting where missing data exist. Recent evidence from Feldman et al indicates that the missing data are important in understanding the risk of readmission. 18 However, the way these missing data are understood and used to inform decisions is not necessarily straightforward or conventional. 24 –26 As such, rigorous multiple imputation of those missing data was performed to use all the observations available in the data set.
In this exploratory study, the authors seek to understand how certain factors influence the likelihood of a return to the ED within 30 days after hospital discharge. Their assumption is that a return to the ED is a signal for a real or perceived deterioration in health. Therefore, they recognize that in addition to SDOH and other individual level characteristics, health or health status might also be important predictors of seeking health care from an ED or returning to that ED after discharge.
In this article, they demonstrate the use of EHR data from UAB Medicine, a large AHSC in Birmingham, Alabama, to explore the association of a comprehensive set of SDOH indicators and the likelihood of return to the ED after discharge from the hospital or ED. Their study findings will help health systems, clinicians, and practitioners develop a deeper understanding of those specific SDOH factors most associated with readmission and make informed strategic decisions contributing to readmission avoidance.
Methods
A cross-sectional retrospective observational study was conducted. The University of Alabama at Birmingham Institutional Review Board approved the project (no. 300001125).
Data source
This study's main data source, the EHR for the AHSC for calendar years 2017 and 2018, was merged with the Area Deprivation Index (ADI) 27 and the US Department of Agriculture Economic Research Service's Rural-Urban Commuting Area Codes. 28 The data include all adult patients who visited the ED at least once between January 2017 and December 2018, inclusive. If there were multiple visits, only the first visit was considered, as was done in a similar study. 29 The final sample had 123,697 unique patients. Excluded from the data were patients younger than 18 years, patients who were pregnant, and those who died in the hospital (n = 3403).
Measures
Measures of a patient's SDOH can be collected at any point during a patient's stay or encounter with the health system. The AHSC's EHR collects the measures included in Table 1, except for the ADI and urban/rural geographic location. In some instances, multiple measures were collected for the same SDOH factor, and these multiple measures were merged into a single item. What follows are explanations of those composites. Tobacco use was created by combining 2 questions: frequency of use (ie, how many cigarettes the patient smokes a day and whether the patient is currently a smoker or ever smoked).
Abuse at home was developed from the following items: patient feels unsafe at home (yes/no), abuse in household (yes/no), patient has safe place to go (yes/no), abused patient received injury at home (yes/no). Patients were coded as “feeling unsafe” if reported “yes” to feeling unsafe at home, but no to the other questions. Patients were coded as having a “significant history” of abuse if they responded “yes” to at least 2 questions, or only responded “yes” to being injured at home. Patients who responded “no” to all questions were coded as “no history of abuse.”
Feeding restriction was developed from the following items: patient needs help in feeding (complete independent/need minimal assistance/need total assistance) and patient has diet restrictions (regular/tube feeding). Patients reporting needing minimal assistance but had a regular diet were coded as “some” feeding restriction, whereas patients who needed total assistance and had tube feeding were coded as “significant” feeding restrictions. All other patients were coded as having “no” feeding restrictions.
Movement restriction was developed from the following items: patient needs mobility assistance (independent/partial assistance/total assistance) and patient's activities of daily living (independent/needs some help/dependent). Patients with “some” movement restriction reported either needing partial assistance or need some help, whereas patients with significant movement restriction reported either needing total assistance or being dependent. All other patients were coded as not having a movement restriction.
In the EHR, pain scores ranged from 1 to 10 where 10 refers to the worst pain possible. Pain score variable was categorized into 3 groups by percentiles using 0%–25%, 25%–75%, and 75%–100% as cut points. The groups are coded as low (scores between 1 and 3), medium (>3–7), and high (>7).
In the analytic file, the authors could not determine whether the health condition was current or had occurred in the past. They decided to count the number of conditions recorded in the EHR at the time of the index visit to convey complexity of a patient's situation. The count of the number of medical conditions ranged from 1 to >100. Low, medium, and high groups were created based on the actual count's percentiles where patients in the low group had 1 to 5 (1%–25%), medium group had 6 to 21 (25%–75%), and high group had >21 (75%–100%) health conditions.
To assess whether the patient lives in an urban or rural area, EHR data were merged with rural–urban commuting area (RUCA) codes using patient's zip code. RUCA codes classify areas at zip code levels as metropolitan, micropolitan, small town, and rural areas using the population density, urbanization, and daily commuting. 28 ADI is a composite index of zip code level indicators of income, education, and employment. 27,30 The index is provided in state decile rankings that range from 1 to 10, where 1 refers to the lowest level of disadvantage. 27 The ADI was categorized into low (1–3), medium (4–7), and high (8–10).
The dependent variable in the analysis was all-cause 30-day ED revisit (yes/no). It was considered “yes” if there was a subsequent visit to ED within 30-day postdischarge from the ED or the hospital.
As given in Supplementary Table S1, if the analysis is restricted to the complete cases, it would produce biased results as there seems to be significant differences between missing and nonmissing data. As the missing values had a nonmonotone pattern and all the variables were categorical, multiple imputation by chained equations (MICEs) was used. 31 Further information about the MICE methodology and Stata commands can be found in Royston and White's study. 32 Logistic and multinomial logistic regression models were used to impute the missing values.
Missing values were imputed using Stata 16.1 (StataCorp LLC, College Station, TX) with mi impute chained command. After an initial trial with 10 imputations, the education variable yielded a fraction of missing information 84% (ie, 84% of the total sampling variance was due to missing data). Therefore, MICE was rerun with 84 imputations. All the variables were used in the imputation (revisit, location, ADI, insurance status, employment rate, living situation, problems at home, marital status, abuse at home, alcohol use, tobacco use, substance abuse, feeding restrictions, movement restrictions, comorbidities, pain scores, body mass index, education level, gender, race, and age). The length of stay variable was also included as an auxiliary variable to increase predictive power.
Analysis
Descriptive analyses were conducted comparing frequency distributions between patients who did or did not return to the ED. The effect size (Cohen's W) is reported. When the sample size is large, the statistical tests almost always yield a statistically significant difference. The effect size demonstrates the magnitude of the difference between the 2 groups, whereas P-values only indicate that the difference is statistically significant. 33
Logistic regression was run where the authors regressed the 30-day ED revisit on the SDOH variables and patient characteristics, and report odds ratios with confidence intervals. They also ran a logistic weighted analysis to discover each independent variable's relative importance in predicting one's likelihood of ED revisits and present those findings graphically. 34 A significance level of 0.05 was used in evaluating the statistical tests. R and Stata 16.1 were used for data management and analyses. Additional tests for multicollinearity, and ordinary least squares were run to get variance inflation factors. None of the variance inflation factors were >1.6.
Results
History of abuse at home, problems at home, education, employment status, living situation, alcohol use, tobacco use, substance abuse, feeding restriction, and movement restriction had missing values for which imputed values were added. Table 2 using imputed values compares frequency distributions between individuals who returned to the ED within 30 days of discharge and those who did not. Effect sizes for most of the variables are <1, indicating that distributions between the 2 groups are similar. Of note is that individuals who returned to the ED had more recorded medical conditions than those who did not return to the ED. Supplementary Table S1 provides frequency distributions for each variable for the raw and imputed samples.
Comparison in Frequency Distributions Between Patients Who Did and Did Not Return to the Emergency Department Within 30 Days of Discharge from the Academic Health Science Center, 2017–2018, Imputed Values Individuals Who Visited the Emergency Department
ED, emergency department; HS, high school.
Table 3 gives odds ratio resulting from the logistic regression analyses on the imputed sample. Many of the variables are shown to be statistically significantly associated with a likelihood of a 30-day return to the ED postdischarge. For example, African American patients had higher odds (OR = 1.385, P < 0.001) than White patients, and individuals who were uninsured or self-pay compared with those with commercial insurance had higher odds (OR = 1.239, P < 0.001) of returning to the ED. Individuals with high pain scores, as compared with low pain scores, had higher likelihood (OR = 1.476, P < 0.001) of returning to the ED, and people who lived in shelters were more likely than people who were living alone (OR = 1.851, P < 0.001) to return to the ED.
Odds Ratios of returning to the Emergency Department within 30 Days of Discharge at the Academic Health Science Center, Imputed Sample, 2017–2018
HS, high school; Ref, reference category.
Interestingly, individuals who are between the ages of 45 and 64 years (OR = 823, P < 0.001), and 65 years and older (OR 0.617, P < 0.001) had lower probabilities than adults between 18 and 44 years to revisit the ED within the 30-day window. A strong and large association was seen between the number of recorded conditions in the medical record and a return to the ED. Individuals with a high number of recorded medical conditions had higher odds of returning to the ED than those with a small number of medical conditions (57.972, P < 0.001).
Supplementary Table S2 shows the same analyses using data without missing value imputations. In general, the odds ratios and significance levels in the raw data set were similar to those in the imputed sample. There were a few areas of difference between the 2 samples. Specifically, in the raw data, history of abuse and educational attainment were not statistically significant, unlike in the imputed sample. Tobacco use, which was not significant in the imputed sample, showed statistical significance in the raw data sample.
Relative importance of each variable in predicting the likelihood of a return to the ED is displayed in Figure 1. Overwhelmingly, the number of medical conditions makes the most contribution in indicating return to the ED. In the imputed sample, number of conditions explain ∼86% of the change in the likelihood of returning to the ED, whereas in the raw data, number of conditions explained about 68% of the change. In the raw data, the order of the relative importance for the other variables shifted.
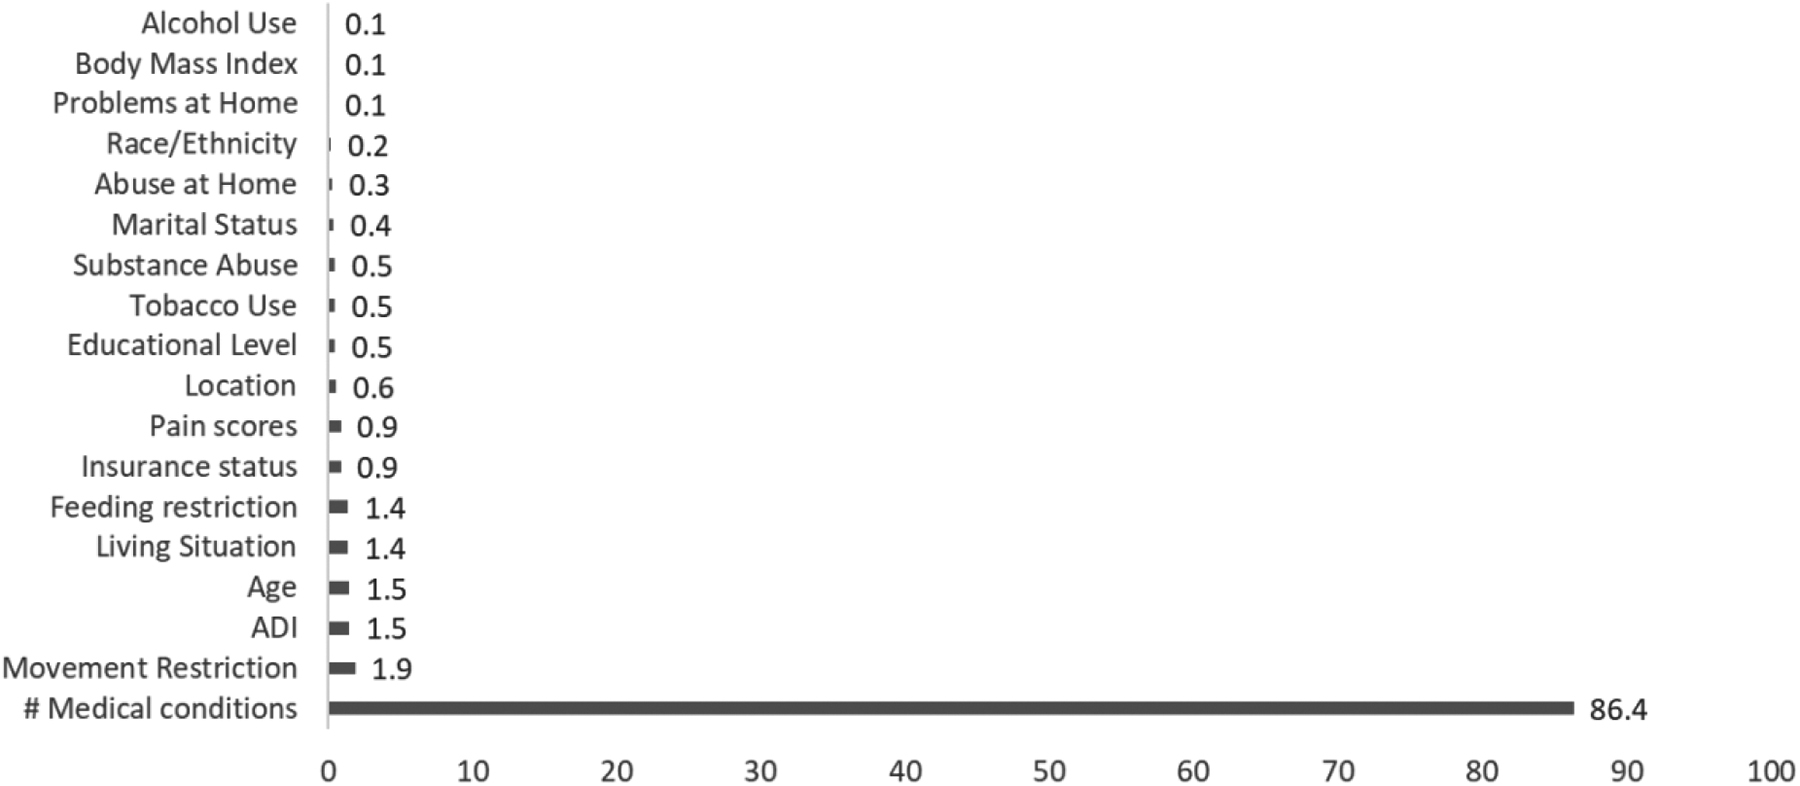
Relative importance or weight of variables in predicting the likelihood of a return to the emergency department within 30 days after hospital discharge.
For example, as shown in Supplementary Figure S1, pain, movement restriction, and problems at home were the next 3 variables in terms of relative importance, in that order. However, as shown in Figure 1, movement restriction, ADI, and age were the next 3 variables in terms of relative importance in the imputed sample.
Discussion
Although there is some evidence of the contributory value of SDOH data across the entire continuum of care, 5,11 –14 EHRs are frequently missing many of these critical data elements. This makes it difficult to incorporate these elements into models predicting revisits and to understand patients' social needs at the point of discharge. 18 The goal of this exploratory study was to show that there are a few critical SDOH data elements that are more likely to lead to sequelae, resulting readmission. This may suggest that it may be not necessary to collect every SDOH, but rather limit collection those that have the best predictive value. Building from the authors' previous study to understand the value of missing SDOH data, 18 this study imputed the missing SDOH values to understand those most likely to lead to ED readmission in 30 days.
After imputation and analysis, statistical significance for increased likelihood of 30-day readmission to the ED was shown for those who are most vulnerable, including, but not limited to, individuals who are African American, uninsured, and homeless or living in a shelter. Although the significance and the relative importance of the SDOH variables were different between the imputed and raw data, the number of reported diagnostic conditions in the her was found to be the most important significant predictor of a return to the ED.
The recent declaration by CMS Administrator Seema Verma saying that “…social determinants such as access to stable housing or gainful employment may not be strictly medical, but they nevertheless have a profound impact on a person's wellbeing” 35 illuminates a strength of this study, especially when juxtaposition against studies acknowledging that many of the critical social determinants are in unstructured data, thereby making the data difficult to access and near impossible to act upon. 36 For at least a decade, therEHR has been collecting structured data relative to an expanded set of social determinants.
These data are easily accessed and factored into care transition decisions. Even still, there are several limitations to this study. The first limitation is to acknowledge that there were missing data. If the original data set had been complete, there is some possibility that the authors would have different results and conclusions. In addition, they included the first encounter for those with multiple encounters, and individuals who have multiple encounters are more likely to have more complete data. Second is the potential for implicit bias when collecting SDOH data; whether it is the person asking the question or the person answering the question—for example, for questions around history of abuse or substance use either may not be asked or may not be answered honestly.
Third, this data set was from a large teaching hospital in the south. Therefore, generalizability may only extend to areas with similar demographics. This study was not a predictive model building exercise, but rather it is an exploratory study to examine the relationship between ED revisit and other variables such as patient demographics, clinical conditions, and SDOH.
Despite these limitations, the findings align with the emerging literature on the use of SDOH in predicting hospital utilization. Although SDOH factors can be associated with outcomes of care, the relative value of these measures in predictive models remain uncertain. For example, a recent systematic literature review concluded that neighborhood-level measures of SDOH (such as the ADI) are only able to provide a minimum contribution to predictive models for repeat ED visits, hospitalizations, hospital readmissions, and other health care services. 37
Other authors have also concluded that the addition of SDOH measures provides little to the predictive ability of readmission statistical models. 38 In this study, the authors also found that the SDOH variables collectively provided a relatively small contribution, as compared with the number of conditions, in explaining the risk of returning to the hospital.
Findings from this study have several implications for practice and research. There remains a strong theoretical basis for considering the role of SDOH in hospital use, especially in the design of appropriate transition of care strategies. Indeed, this study did demonstrate that there are certain groups of people, such as people with comorbidities, high ADI, and the uninsured are more likely to return to the ED after 30-day discharge from the hospital.
Health systems will need to develop robust transition of care programs that address underlying SDOH and health conditions that can best help this group of patients. However, given underlying structural and systemic barriers, such as the inability to connect individuals with robust access to outpatient care, preventing repeat visits to the ED continues to be fraught with systemic challenges. 39
The fact that this study and other studies are only able to demonstrate some minimal value of the relative importance of SDOH measures in identifying populations at risk could be because current measurement approaches are inadequate. For example, the data set included only structured data from the EHR, whereas the literature suggests that the combination of structured and unstructured data might provide a more comprehensive SDOH picture. Research should continue to focus on designing and then implementing robust measures of SDOH that incorporate structured and unstructured elements.
Further analyses could focus explicitly on populations with lengthy hospital status, or those with specific diagnoses or surgical procedures. It is also noted that EHR data were insufficient with many missing values. In this study, the authors were forced to impute missing observations. However, the analyses demonstrate that using imputed values did not fundamentally change the conclusions.
The authors' acknowledge is that a simple count of conditions does not account for severity and that standard research practice is to include validated measures of severity such as the Charlson Comorbidity Index. 40 However, the finding that a simple count of medical conditions ended up being an important predictor of readmissions suggests that this measure, even without accounting for severity, could serve as an easy proxy for administrators seeking to identify high-risk patients. Although many readmission prediction models tend to be very complex and involve multiple variables from the EHR, perhaps a more simplistic approach would yield similar results.
Future research could test this idea by comparing predicted versus observed admissions using count of conditions when compared with more complex prediction models. Hospital administrators can, therefore, be confident in leveraging available data to inform strategy aimed at reducing readmissions.
The finding that the number of medical conditions emerged as the predictor with the greatest relative importance makes logical and intuitive sense—individuals who are sicker are going to have the most difficult time managing their illness and are, therefore, most at risk for returning to the ED. Further research could include analyses stratified or segmented by either the number of conditions present or the number of prior visits to determine whether SDOH are more relevant within groups that have a high versus low number of conditions or visits.
Conclusions
Findings from this study suggest that multiple measures of SDOH while associated with the likelihood of return hospital visits may not be the most valuable predictor of these visits. Instead, the authors found that the count of medical conditions was the most important variable and individuals with more conditions were more likely to return to the ED. The count of medical conditions relative to measures of SDOH explained a major amount of the variation in likelihood of going to the ED after discharge.
Footnotes
Authors' Contribution
Dr. Hall conceived the paper, directed the analysis, conducted the literature review, drafted portions of the manuscript; Dr. Davlyatov conducted the analysis and drafted the  section of the paper; Mr. Orewa assisted with the analysis and drafted portions of the manuscript, Dr. Mehta directed the analysis, Dr. Feldman drafted and edited portions of the manuscript.
Author Disclosure Statement
No competing financial interests exist.
Funding Information
This study was funded by the National Science Foundation's Center for Health Care Organization and Transformation (CHOT) grant NSF1624690.
Supplementary Material
Supplementary Figure S1
Supplementary Table S1
Supplementary Table S2
References
Supplementary Material
Please find the following supplemental material available below.
For Open Access articles published under a Creative Commons License, all supplemental material carries the same license as the article it is associated with.
For non-Open Access articles published, all supplemental material carries a non-exclusive license, and permission requests for re-use of supplemental material or any part of supplemental material shall be sent directly to the copyright owner as specified in the copyright notice associated with the article.
