




Abstract
Given varied insurance acceptances and differing pay between insurances, our objective was to examine the number of California physicians enrolled in Medicare and Medicaid (Medi-Cal), stratified by specialty and graduation year. Medi-Cal and Medicare providers were extracted from publicly available databases (Centers for Medicare & Medicaid Services and California Health and Human Services) and were subsequently merged into one dataset using National Provider Identifier. From there, we stratified physicians by specialty and graduation year. We found that emergency medicine, radiology, pathology, anesthesiology, general surgery, and internal medicine had the highest percent of Medi-Cal-accepting physicians, whereas dermatology, psychiatry, physical medicine & rehabilitation, and plastic & reconstructive surgery physicians had the lowest. There also appears to be an inverse relationship between acceptance of Medi-Cal and earlier year of graduation (P < 0.05). This study demonstrated striking variability in Medi-Cal acceptance based upon physician years in practice and specialty. Older, experienced physicians, as well as physicians of certain specialties, are less likely to accept Medi-Cal.
Introduction
The Centers for Medicare and Medicaid Services (CMS) is the largest health care payer nationwide. 1 Medicare is a federally funded insurance program that primarily serves patients >65 years, who are disabled, and those on dialysis, whereas Medicaid, a federal-state assistance program, aims to serve low-income individuals. 2,3 Both Medicare and Medi-Cal, California’s branch of Medicaid, make up the largest proportion of health insurance in California outside of employment health coverage. 4 According to the California Department of Health Care Services (DHCS), roughly one-third of the state’s population is enrolled in Medi-Cal as of June 2021 (similar to enrollment in 2018 during the pre-COVID timeframe), making up 18% of the total number of individuals enrolled in Medicaid nationwide. 5,6 As such, the number of providers enrolled in Medi-Cal is of particular interest, especially in the context of the 2014 Medicaid expansion. 7
With the Medicaid expansion under the Affordable Care Act in 2014, studies have shown that those states that expanded the eligibility criteria experience an increase in access to care, while other states did not. 8 However, there remains a dearth of literature on whether this increase in access applies uniformly to all aspects and specialties within the health care system. In addition, there is evidence that physician participation in Medicaid continues to lag behind Medicare. 9 This can, perhaps, be attributed to lower physician reimbursement rates compared with Medicare. 10 With a third of Californians enrolled in Medi-Cal, it is important to explore the discrepancies in Medi-Cal physician participation and ways to motivate physicians to provide care for this patient population. This study aims to explore and define any possible discrepancy by examining the number of California physicians, by specialty and graduation year, enrolled in Medicare and Medi-Cal (California’s version of Medicaid).
Methods
Medicare
Medicare provider data were obtained from the Physician Compare National Downloadable File (updated twice monthly; May 21, 2021, version accessed). This dataset contains all physicians who have an approved Medicare enrollment and have ≥1 Medicare claim in the preceding 6 months. 11 We excluded duplicates, non-California-based providers, anyone listed as a non-MD or non-DO (we kept those with missing credentials), and those who graduated medical school after 2015 (so as to not include current residents). We subsequently filtered the dataset based on specialties to exclude providers who may have been in the “missing” category that were not physicians (i.e., dentists, nurses, optometrists, podiatrists) (Fig. 1).
Medi-Cal
Medi-Cal provider data were obtained from the California Health and Human Services (CHHS) Open Data Portal: Profile of Enrolled Medi-Cal Fee-for-Service Providers dataset (updated monthly; May 9, 2021, version accessed), which includes all providers who are actively enrolled in the Medi-Cal Fee-For-Service program. 12 Of note, this excludes providers who participate in Medi-Cal-managed care. While we initially attempted to filter the data similar to the Medicare data, we noticed multiple errors. For instance, dentists and medical businesses were grouped as physicians. As such, duplicates were removed to determine individual physicians who were included in the final analysis (Fig. 1).
Merger & analysis
With the assumption that the National Provider Identifier (NPI) is correct and accurate in both datasets, we merged the Medi-Cal dataset into the Medicare dataset using the NPI and deleted Medi-Cal entities that did not have a corresponding Medicare record. This way, errors from the Medi-Cal file (i.e., dentist and businesses that were listed as physicians) can be effectively filtered out. A visual representation of all filter and merging steps is detailed in Figure 1.
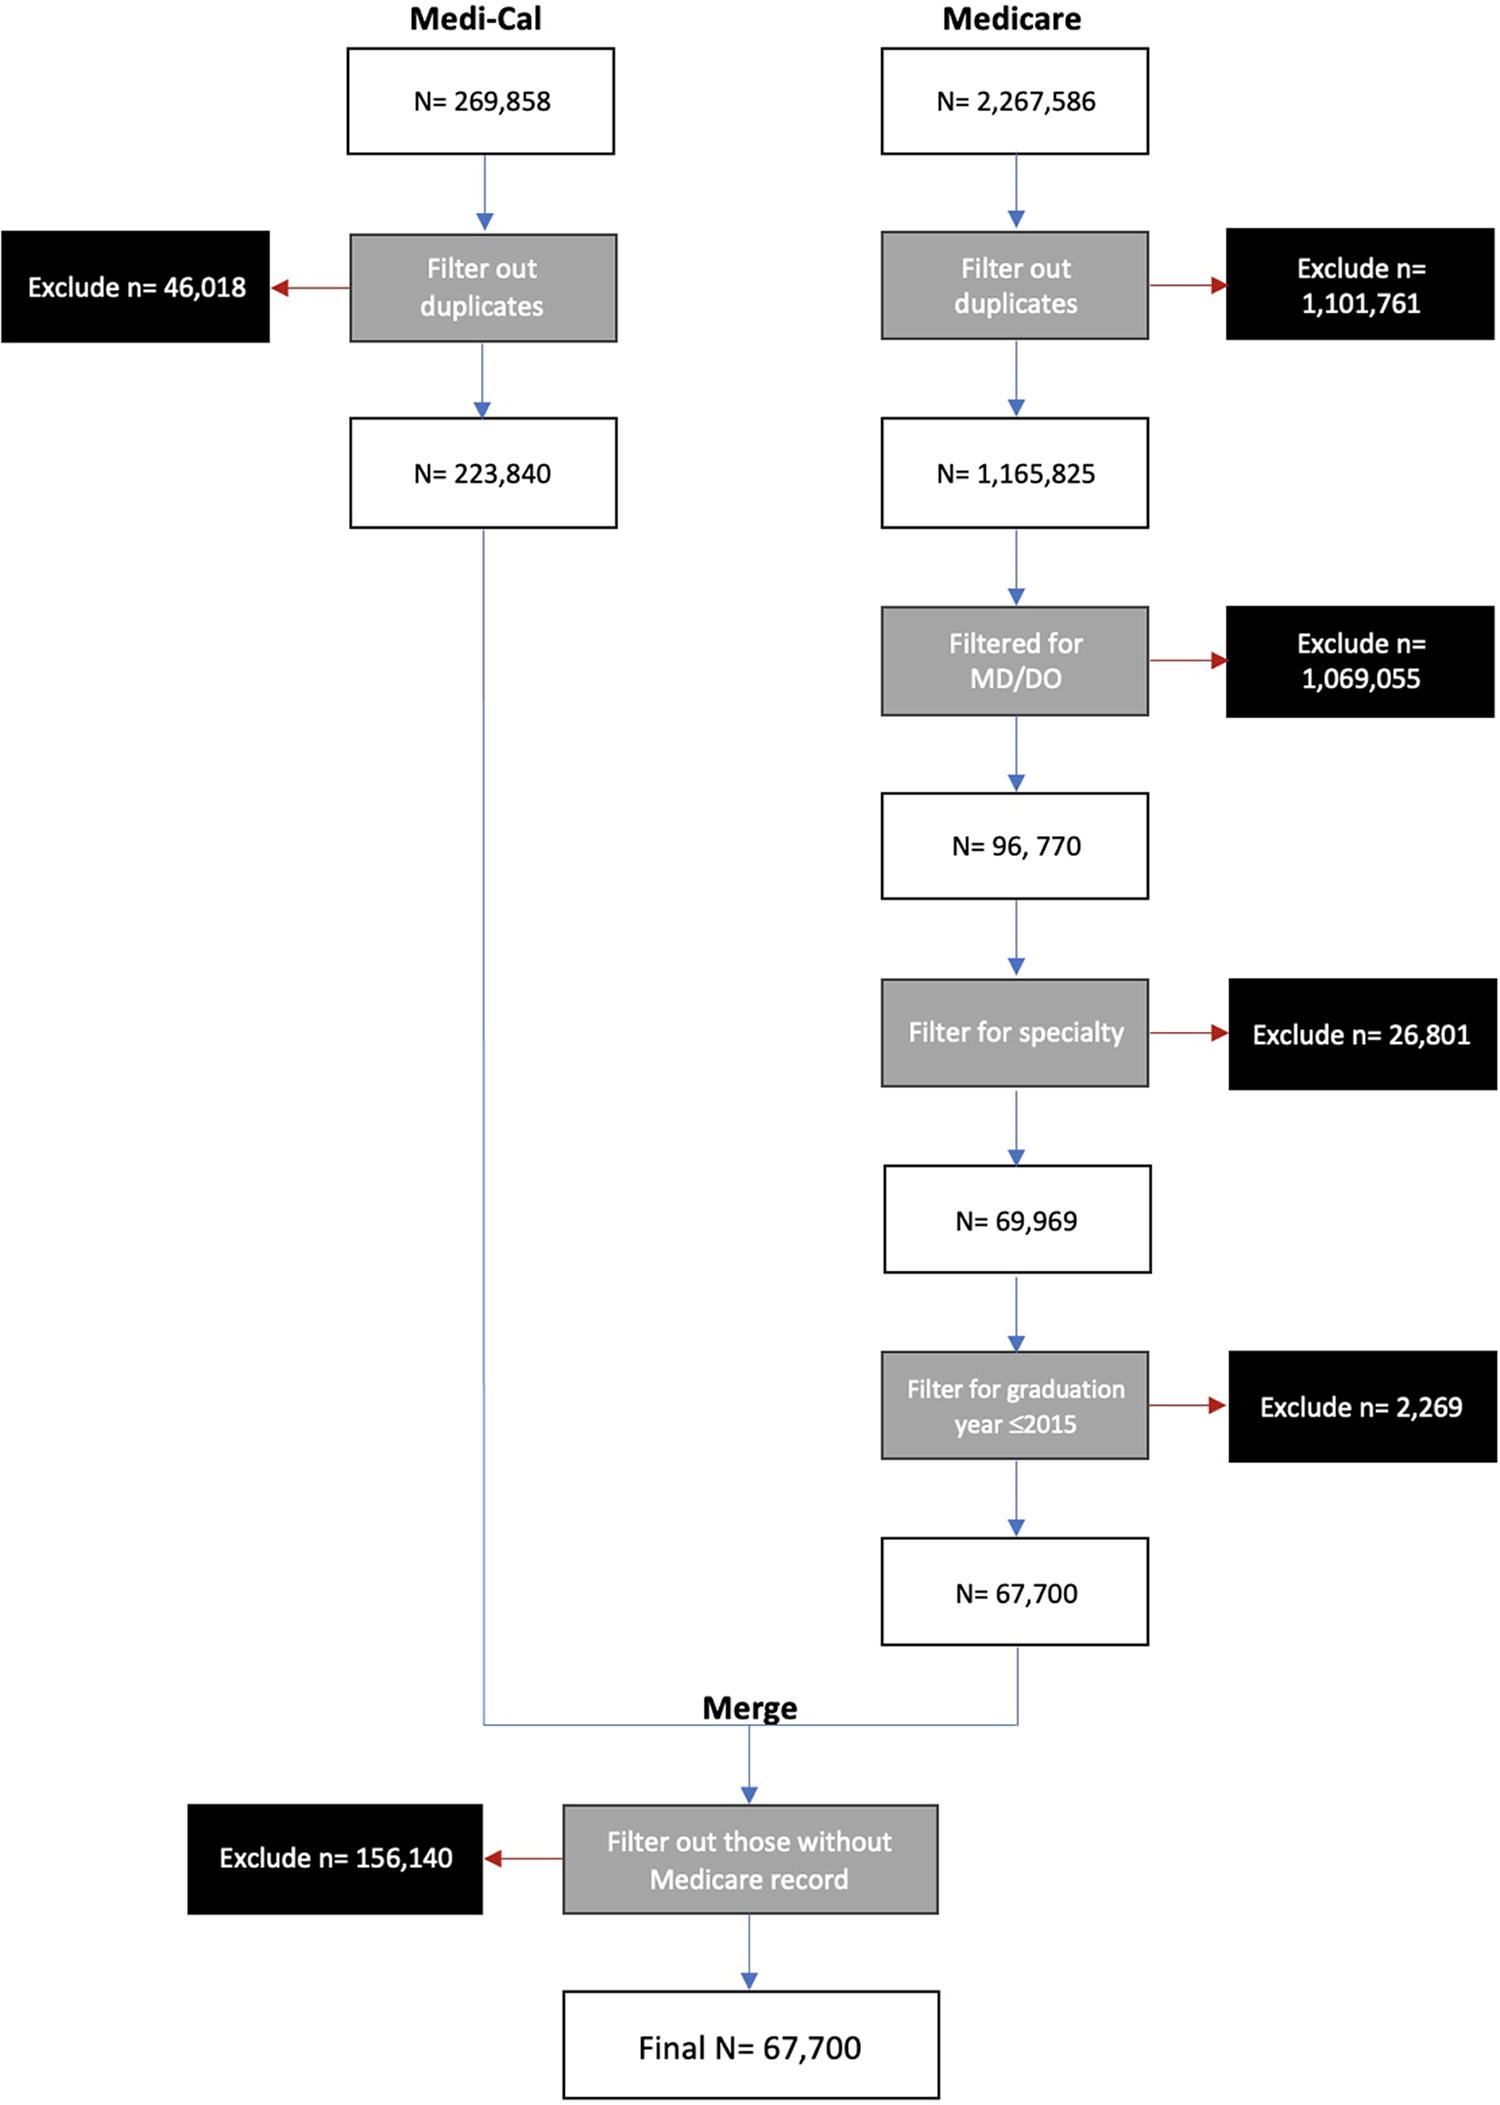
Flowchart of filtration and merging steps.
We then collapsed specialties and their corresponding subspecialties together, which can be seen in Table 1. We also organized physicians together based on medical school graduation year into decade groups: ≤1959, 1960s, 1970s, 1980s, 1990s, 2000s, and 2010–2015.
CA Physicians Enrolled in Medicare and Medi-Cal Broken Down into Specialties and Subspecialties
Subsequent descriptive and statistical analyses were all computed on IBM SPSS Statistics software version 27. A univariate binary logistic regression was performed. All statistical tests utilized a significance level of 0.05.
Comparison to AAMC data
Our final cohort of providers (n = 67,700) was much lower than the reported number of active California physicians (n = 105,907). 13 To ensure our sample was representative, we compared our data to the 2019 AAMC Number of Active Physicians. 14 Upon comparison (Table 2), we found that our physician numbers per specialty largely match the trend seen in the AAMC’s dataset. Twenty-nine of the 32 specialties evaluated within our cohort were within 1% of the distribution seen in the AAMC dataset.
Comparing Our Sample to the AAMC’s 2019 Physician Specialties
Preventive Medicine, Colon & Rectal Surgery, Surgical Oncology, Other/Undefined Physician Type are not included (n = 416; 0.6%).
The greatest discrepancy seen was within internal medicine, which represented 20.0% of our sample, as opposed to 13.5% in the AAMC dataset. Any deviation may be at least partially due to the exclusion of those who do not see Medicare patients, as well as primarily pediatric-serving physicians. Nevertheless, as no significantly large deviation was noted in terms of percent of providers between our sample and that of the AAMC, our data may be representative of physicians as a whole inside and outside of California.
Results
The initial sample size was 2,267,586 and 269,858 for Medicare and Medi-Cal physician enrollment in California, respectively. Following removal of duplicates and exclusion criteria, there were 67,700 and 231,684 Medicare and Medi-Cal physicians. After merging the files, we were left with a sample of 67,700 physicians who were enrolled in Medicare, but may or may not have been enrolled in Medi-Cal.
Of physicians enrolled in Medicare, those in emergency medicine (99.0%), radiology (96.8%), pathology (95.4%), anesthesiology (94.3%), general surgery (92.1%), and internal medicine (91.0%) were most often also enrolled in Medi-Cal, whereas those in dermatology (66.6%), psychiatry (71.4%), physical medicine & rehabilitation (74.7%), and plastic & reconstructive surgery (75.0%) had the lowest number of physicians enrolling in Medi-Cal (Table 1).
There appears to be an inverse relationship between Medi-Cal acceptance and earlier medical school graduation year, with 77.9% of those graduating medical school in 1960’s accepting Medi-Cal and 90.4% of those graduating between 2010 and 2015 (Table 3). Logistic regression analysis showed physicians with earlier graduation year generally had decreased odds of accepting Medi-Cal. For example, those who graduated in the 1970’s had an OR of 0.552 (95% CI: 0.503-0.605; P < 0.001) compared with those who graduated between 2010 and 2015 (Table 3).
Binary Logistic Regression Analysis of Physicians Accepting Medi-Cal Categorized by Graduation Year and CA Physicians Enrolled in Medicare and Medi-Cal Categorized by Graduation Year
CI, confidence interval; Reference, reference to odds ratio.
On binary logistic regression analysis of physicians by specialty, those in anesthesiology (Ref: Primary care; OR: 2.369; 95% CI: 2.089–2.686; P < 0.001), emergency medicine (Ref: Primary care; OR: 14.227; 95% CI: 10.0354–19.549; P < 0.001), internal medicine (Ref: Primary care; OR: 1.547; 95% CI: 1.431–1.673; P < 0.001), general surgery (Ref: Primary care; OR: 1.677; 95% CI: 1.460–1.9926; P < 0.001), OB/GYN (Ref: Primary care; OR: 1.195; 95% CI: 1.057–1.357; P = 0.001), ophthalmology (Ref: Primary care; OR: 1.242; 95% CI: 1.077–1.433; P < 0.001), neurology (Ref: Primary care; OR: 1.254; 95% CI: 1.065–1.478; P = 0.007), and radiology/pathology (Ref: Primary care; OR: 3.692; 95% CI: 3.184–4.282; P < 0.001) had increased odds of accepting Medi-Cal, while all other specialties had decreased odds of accepting Medi-Cal when compared with primary care (Table 4).
Binary Logistic Regression Analysis of Physicians Accepting Medi-Cal (If They Accept Medicare) Categorized by Specialty
CI, confidence interval; OR, odds ratio; Reference, reference to odds ratio.
On multivariate logistic regression to control for confounding factors, those who graduated between 2010 and 2015 (Ref: Before 1959; OR: 1.972; 95% CI: 1.147–3.391; P = 0.014) and physicians who specialize in anesthesiology (Ref: Primary care; OR: 2.320; 95% CI: 2.045–2.632; P < 0.001), emergency medicine (Ref: Primary care; OR: 13.136; 95% CI: 9.557–18.005; P < 0.001), internal medicine (Ref: Primary care; OR: 1.588; 95% CI: 1.468–1.718; P < 0.001), general surgery (Ref: Primary care; OR: 1.737; 95% CI: 1.511–1.997; P < 0.001), OB/GYN (Ref: Primary care; OR: 1.232; 95% CI: 1.085–1.399; P = 0.001), ophthalmology (Ref: Primary care; OR: 1.301; 95% CI: 1.127–1.502; P < 0.001), neurology (Ref: Primary care; OR: 1.254; 95% CI: 1.064–1.479; P = 0.007), and radiology/pathology (Ref: Primary care; OR: 3.692; 95% CI: 3.183–4.283; P < 0.001) had increased odds of accepting Medi-Cal (Table 5).
Multivariate Logistic Regression Analysis of Physicians Accepting Medi-Cal (If They Accept Medicare) Categorized by Graduation Year and Specialty
CI, confidence interval; OR, odds ratio; Reference, reference to odds ratio.
Discussion
This study examined the proportion of physicians, by specialty, enrolled in Medicare and Medi-Cal in California. We demonstrate significant variability in physician enrollment in Medi-Cal, 67%–99%, by specialty type. We also report an inverse relationship between Medi-Cal acceptance and medical school graduation year, with physicians graduating medical school between 2000 and 2015 significantly more likely to accept Medi-Cal patients, with a relatively graded decline in acceptance compared with prior years.
Prior research has demonstrated that physicians are less likely to accept new patients with Medicaid or Medi-Cal compared with those with Medicare or private insurance. 9,15 However, there is no current literature on the impact of years from medical school graduation on Medi-Cal acceptance. It should be noted that the year of medical school graduation is being utilized as a surrogate for years in practice, age, and/or seniority, although this may be an imperfect metric, given that physician practices may not always involve consecutive years of clinical practice, or enrollment at the time of medical school may not be at the same age. It is likely that as clinicians first enter practice, they are more likely to accept as many insurance carriers as possible, including Medi-Cal, which has historically reimbursed less, to grow their practice.
On the other hand, experienced clinicians with busy, established practices may have a higher likelihood of accepting new patients with insurances that reimburse more. Nevertheless, our results suggest that Medi-Cal patients may not only have access to a smaller pool of physicians but also may have less access to more senior physicians. 16,17 Although obviously an inexact metric, senior physicians may be more experienced. At least in the realm of surgery, more experienced surgeons may operate on higher-risk patients and have improved outcomes. 18,19 This, along with emerging research suggesting Medicaid patients have worse outcomes for many disease states due to a multitude of factors, 20 –23 suggests further research is required to understand reasons for the discrepancies in Medi-Cal acceptance.
These changes in outcome could be for a multitude of factors, with access to care being one of them. Efforts to increase physician participation should be investigated further to ensure Medi-Cal patients get access to high-quality care in all specialties of medicine, although there is ample research that suggests increased Medicaid reimbursement may at least partially help improve access to care. 24 –27 As time progresses, it will be interesting to see if the 2000–2015 graduates start to transition away from accepting Medi-Cal.
Discrepancy in Medi-Cal acceptance among specialties was also expected, as prior research has shown similar results. 26,27 This suggests that Medicaid expansion may not have uniformly improved access to care among all of medicine, and this underinsured cohort still lacks access to certain critical specialties, like psychiatry, dermatology, and certain surgical specialties. On the provider side, primary care physicians may bear the brunt of patients’ lack of access; care within these realms falls upon them to manage administrative burdens of increased patient loads, which may contribute to burnout and present further barriers to care.
Limitations
This analysis is not without limitations. Our results must be taken within the context of the discrepancy between the total number of physicians in our data (n = 67,700) compared with the reported number of active physicians in California (n = 110,603). 26 However, in comparing the two cohorts, the distribution of physicians is similar. Discrepancies may be due to having physicians who do not bill Medicare (i.e., cash-only businesses) or the inherent exclusion of pediatricians on our end, as pediatric patients are generally not insured through Medicare. This may also be confounded by physicians who leave clinical practice to pursue other careers (such as industry or hospital leadership), but still may maintain active medical licenses. However, the Bureau of Labor Statistics reports that there are 4300 active pediatricians in the state of California. 28
This suggests that the other confounding variables listed above may play a larger role in this discrepancy. Our results also may not be generalizable to the 12 states that have not undergone Medicaid expansion as access to care has been shown to increase with Medicaid expansion. 8,29 This study also excluded those who participate in Medi-Cal-managed care, although this may be less of a limiting factor for subspecialty care. 30 As we evaluated the number of physicians, this study does not address access to care by physician location or specific needs of community, although this is likely to amplify any discrepancy found herein. Similarly, this article is unable to evaluate the number of patient seen by physicians, who may limit the number of Medicaid patients they see. 31,32 Finally. our study is limited to the amount of and accuracy of information available in the databases.
Conclusion
This analysis of Medi-Cal (California’s version of Medicaid) acceptance among California physicians demonstrated striking variability in Medi-Cal acceptance based upon physician age and physician specialty. Physicians who graduated from medical school more remotely from present day, as well as physicians of certain specialties, are less likely to accept Medi-Cal. These results may be generalizable to most states and underscore a troubling relative lack of access among this arguably underinsured group. Further work must be done to understand these discrepancies, and work to close the gap.
Footnotes
Authors’ Contributions
S.J.T.: conceptualization, methodology, formal analysis, investigation, data curation, writing—original draft. T.V.N.: methodology, formal analysis, investigation, writing—original draft. A.T.D.: methodology, formal analysis, investigation, data curation, writing—Original Draft. J.L.B.: methodology, investigation, data curation, writing—Original Draft. R.P.M.: conceptualization, methodology, investigation, writing—review and editing, supervision. E.C.K.: conceptualization, methodology, investigation, writing—review and editing, supervision.
Author Disclosure Statement
The authors declare that there is no relevant conflict of interests.
Funding Information
The authors declare that there is no funding support.