
Abstract
This cross-sectional study assessed hepatitis C virus (HCV) antibody and RNA test results performed from 2016 to 2021 at a large US clinical reference laboratory. When individual patient factors (ie, income, education, and race/ethnicity) were not available, estimates from the US Census were linked to the residential zip code. The final analytic cohort comprised 19,543,908 individuals with 23,233,827 HCV antibody and RNA test results. An analysis of progressively increasing poverty quintiles demonstrated an increasing trend in both HCV antibody positivity (from 2.6% in the lowest quintile to 6.9% in the highest, P < 0.001 for trend) and HCV RNA positivity (from 1.0% to 3.6%, P < 0.001 for trend). Increasing levels of education were associated with a decreasing trend in both HCV antibody positivity (from 8.4% in the least educated quintile to 3.0% in the most, P < 0.001 for trend) and HCV RNA positivity (from 4.7% to 1.2%, P < 0.001 for trend). Persistent differences in positivity rates by these social determinants were observed over time. HCV antibody and RNA positivity rates were nearly identical in predominantly Black non-Hispanic, Hispanic, and White non-Hispanic zip codes. However, after adjustment for all other factors in the study, residents of predominantly Black non-Hispanic and Hispanic zip codes were significantly less likely to test positive for HCV RNA (adjusted odds ratios [AOR]: 0.51, 95% confidence interval [CI]: 0.51–0.52; AOR: 0.46, 95% CI: 0.46–0.46, respectively). These findings may benefit targeted intervention initiatives by public health agencies.
Introduction
The Centers for Disease Control and Prevention (CDC) defines social determinants of health (SDOH) as nonmedical factors that influence health outcomes, which include but are not limited to economic policies, political systems, social norms, racism, and climate change. 1 SDOH contribute to disparities in health care quality and access and must be addressed in research and intervention efforts. 2
An estimated 2.2 million noninstitutionalized people in the United States have hepatitis C, based on estimates from the National Health and Nutrition Examination Survey during 2017–2020. 3 From 2013 to 2020, the incidence rate of acute hepatitis C has more than doubled, increasing 15% from 2019 to 2020 alone. 4 The CDC estimated 66,700 acute hepatitis C virus (HCV) infections and 107,300 cases of newly reported chronic hepatitis C during 2020, estimates that may still be underestimated due to a significant decrease in testing during the COVID-19 pandemic. 4 Furthermore, the greatest increases in reported cases of acute hepatitis C infection were among non-Hispanic Black, Hispanic, and non-Hispanic White persons. 5
In 2020, the CDC updated HCV screening recommendations for adults, indicating that those of age 18 years and older be screened at least once over their lifetime and pregnant individuals be screened once during each pregnancy. 6 Recommended diagnostic testing for hepatitis C consists of a two-step sequence: first, a rapid or laboratory blood test for HCV antibodies, and then, if the sample is reactive, a subsequent nucleic acid test for the presence of HCV RNA to determine active infection. 7
Previous research has defined SDOH associated with increased HCV infection risk at both the individual and the community levels. At the individual level, HCV infection has been linked to SDOH factors, including education and income, as well as other demographic factors including age, sex race, and ethnicity. 5,8,9 For example, Backus et al found that among military veterans, Black men had the highest prevalence of HCV antibodies. 9 Additionally, a National Health and Nutrition Examination Survey, from 2003 to 2010, involving 273 participants ages 20 years or older who were HCV RNA positive, found Black non-Hispanic persons were more likely to have chronic hepatitis C compared with persons of other races and ethnicities. 8 Furthermore, chronically infected individuals were more likely to have less education and a lower family income. 8 At the community level, the probability of acquiring sexually transmitted diseases during pregnancy was shown to be associated with neighborhood characteristics, including isolation index and income inequality. 10 Identifying SDOH strongly associated with HCV infection and their relationship with other demographic factors may guide mitigation efforts and help achieve elimination goals. This study combines a substantial sample size of recent laboratory test results with U.S. Census Bureau information to investigate and identify SDOH associated with HCV infection across the United States.
Methods
In this cross-sectional study, the test results selected for potential inclusion were HCV antibody and RNA assays performed by Quest Diagnostics from 2016 to 2021 for individuals ages >18 years. In November 2015, Quest Diagnostics revised its HCV antibody screening test offerings to only include automatic reflex HCV RNA testing in the case of a positive HCV antibody specimen. Inclusion criteria were (1) test records must have included a Quest Diagnostics unique patient identifier, (2) individuals must have had at least one HCV antibody test during the study period, and (3) the test information for the individual must include a residential zip code to enable linking to US Census estimates. A Quest Diagnostics assigned internal unique patient identifier was utilized to assess the number of test results per individual, and each person was included only once per calendar year. If both a positive HCV antibody and a negative HCV antibody result were recorded within the same year, the positive result was selected for analysis. If an individual had multiple HCV antibody or RNA tests with the same result in a calendar year, the earliest test result was selected.
Demographic factors
Age and sex were determined from individual patient records in the Quest Diagnostics data warehouse. To estimate impacts of race/ethnicity associated with HCV laboratory results, US Census data from the 2018 American Community Survey (5 years) were obtained 11 and linked to an individual’s residential zip code. Zip codes with estimated proportions of Black non-Hispanic population over 50% were classified as “predominantly Black non-Hispanic.” The same pattern was followed for “predominantly Hispanic” and “predominantly White non-Hispanic” zip codes in a manner consistent with previous literature. 12,13 Any zip codes that did not fall under these definitions, either because there was no single race/ethnicity estimate over 50%, or, in rare cases, when a different race/ethnicity was predominant, were grouped together and labeled “other communities.”
Social determinants of health
To estimate the association between community-level factors associated with HCV laboratory results, poverty, 14 and proportion of the population with bachelor’s degrees (the definition used in this study for “education”), 15 zip code-associated estimates were also obtained from the 2018 American Community Survey (5 years). Quintiles of poverty and education level were made based on national, unweighted, and available estimates for all zip codes.
Statistical analyses
HCV RNA test positivity variance was estimated by calculation of 95% Wald confidence intervals (CIs). The Cochran–Armitage test was used to analyze trends in proportions of HCV antibody and HCV RNA test positivity for quintiles of education and poverty. Statistical significance of differences between the two groups was conducted using the chi-square test. Multivariable logistic regression models were fit to 6 years of pooled data to identify factors associated with HCV antibody and HCV RNA test positivity. To eliminate the potential impact of repeated patient measures, these models are limited to the first patient test result included in the pooled data. Variables in both models were chosen based on plausibility and remained in the final model using a stepwise entry criterion of P < 0.01. Model performance was assessed using the area under the receiver operating curve. Analyses were performed using SAS Studio 3.6 on SAS 9.4 (SAS Institute). This Quest Diagnostics Health Trends study was deemed exempt by the WCG Institutional Review Board.
Results
After removing 1,445,521 specimens that were multiple results from the same individual in the same calendar year and 1213 specimens from individuals without residential zip code data, the final analytic cohort comprised 23,233,827 specimens from 19,543,908 individuals (94.1% of specimens considered). The included cohort was 41.6% male and had a median (interquartile range) age of 45.9 (31.3–59.4) years. Additional study cohort demographic characteristics are shown in Table 1. Table 2 shows the distribution of HCV tests across national quintiles of poverty and education for each race/ethnicity zip code category. Key findings include 61.2% of the tests provided to residents of predominantly Black non-Hispanic zip codes and 47.9% of the tests provided to residents of predominantly Hispanic communities in this study were in the highest national poverty quintile, compared to only 8.4% of the test provided to residents of predominantly White non-Hispanic communities; 49.3% of tests from residents of predominantly White non-Hispanic communities were in the highest national education quintile compared to just 9.3% and 9.2% of the tests provided to residents of predominantly Black non-Hispanic and predominantly Hispanic communities, respectively.
Demographic and Social Determinants of Health Characteristics
Specimens missing data elements: 16,913 (sex), 264,171 (poverty quintile), 260,315 (education quintile), and 85,113 (provider specialty).
HCV, hepatitis C virus.
Descriptive Statistics for Predominant Race/Ethnicity Groups and Poverty/Education
Specimens from zip codes missing Census estimates: 264,171 for poverty and 260,315 for education.
Annual HCV antibody test volume increased 75% during the study period, from 2,724,321 in 2016 to 4,762,396 in 2021 (Fig. 1). There was a notable decline in test volume during the early months of the COVID-19 pandemic, March–May 2020, that rebounded to approximately the prior year’s testing levels by July 2020. Overall, a steady decline in HCV antibody positivity was observed during the study period, from 5.8% (95% CI: 5.8%–5.9%) in 2016 to 3.7% (95% CI: 3.7–3.7%) in 2021. HCV RNA test positivity rate patterns mirrored the HCV antibody test positivity rate patterns throughout the study period.
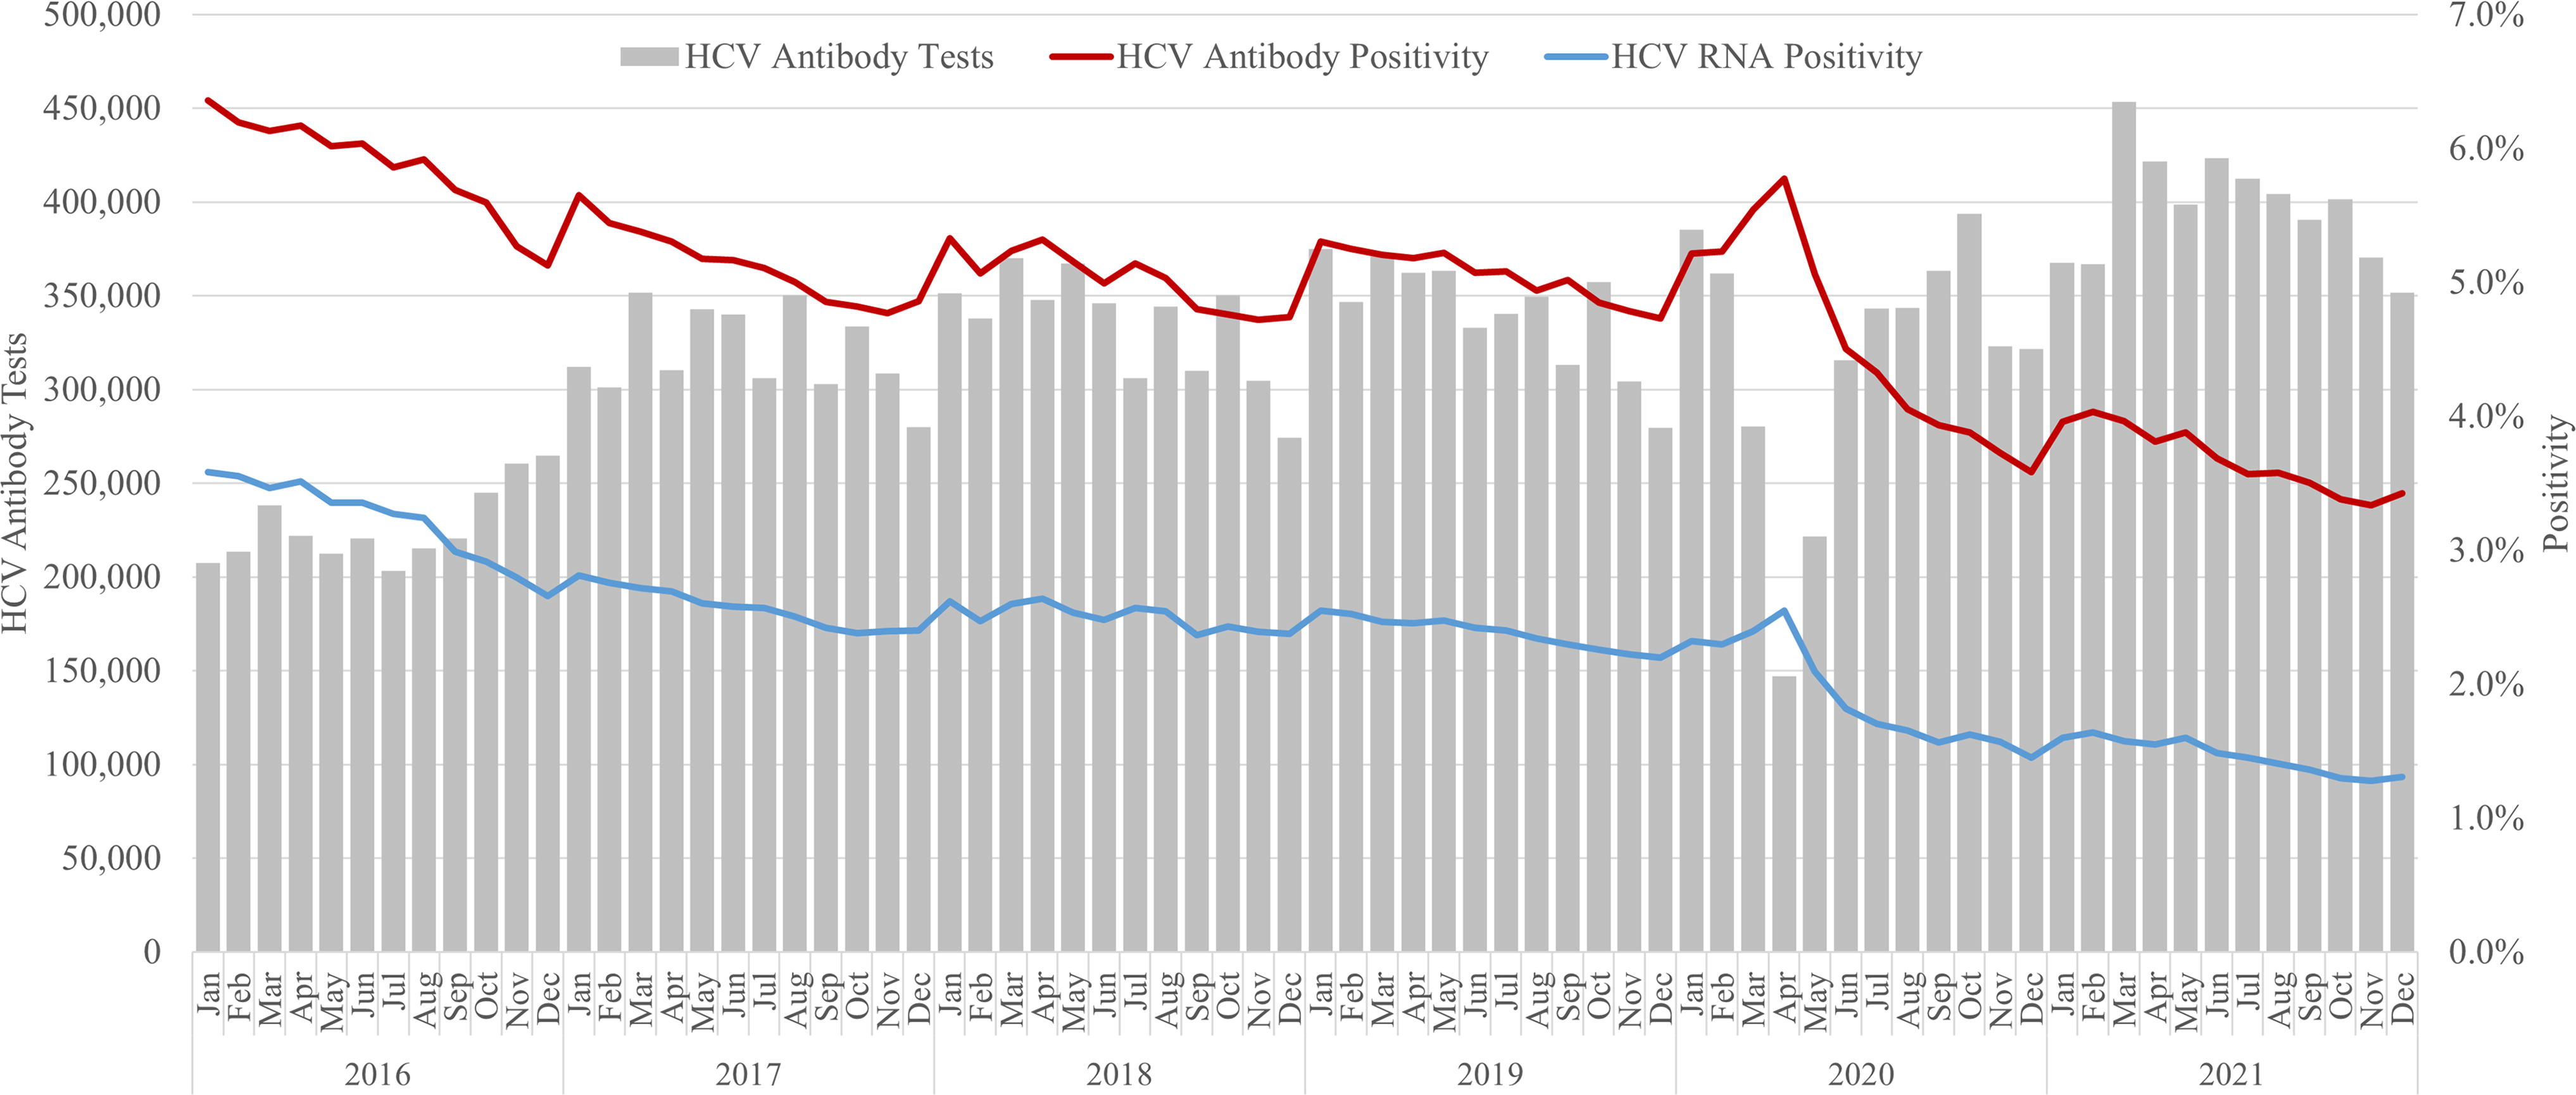
Trends of HCV antibody tests, HCV antibody positivity, and HCV RNA positivity rates. HCV, hepatitis C virus.
HCV positivity rates stratified by education and poverty quintiles are shown in Figure 2. Analysis of progressive poverty quintiles demonstrated a statistically significant increasing trend in both HCV antibody test positivity (from 2.6% in the lowest quintile to 6.9% in the highest, P < 0.001 for trend) and HCV RNA test positivity (from 1.0% to 3.6%, P < 0.001 for trend). Consistent differences in positivity rates among poverty quintile groups were observed throughout the study period (Fig. 2A–B). Increasing levels of education (as assessed by the proportion of the population with a bachelor’s degree) were associated with a decreasing trend in both HCV antibody test positivity (from 8.4% in the least educated quintile to 3.0% in the most educated quintile, P < 0.001 for trend) and HCV RNA test positivity (from 4.7% to 1.2%, P < 0.001 for trend). These differences also persisted throughout the study period (Fig. 2C–D). The proportion of HCV antibody-positive individuals that were also HCV RNA positive decreased among increasing education quintiles (57.1% to 41.2%, P < 0.001 for trend).
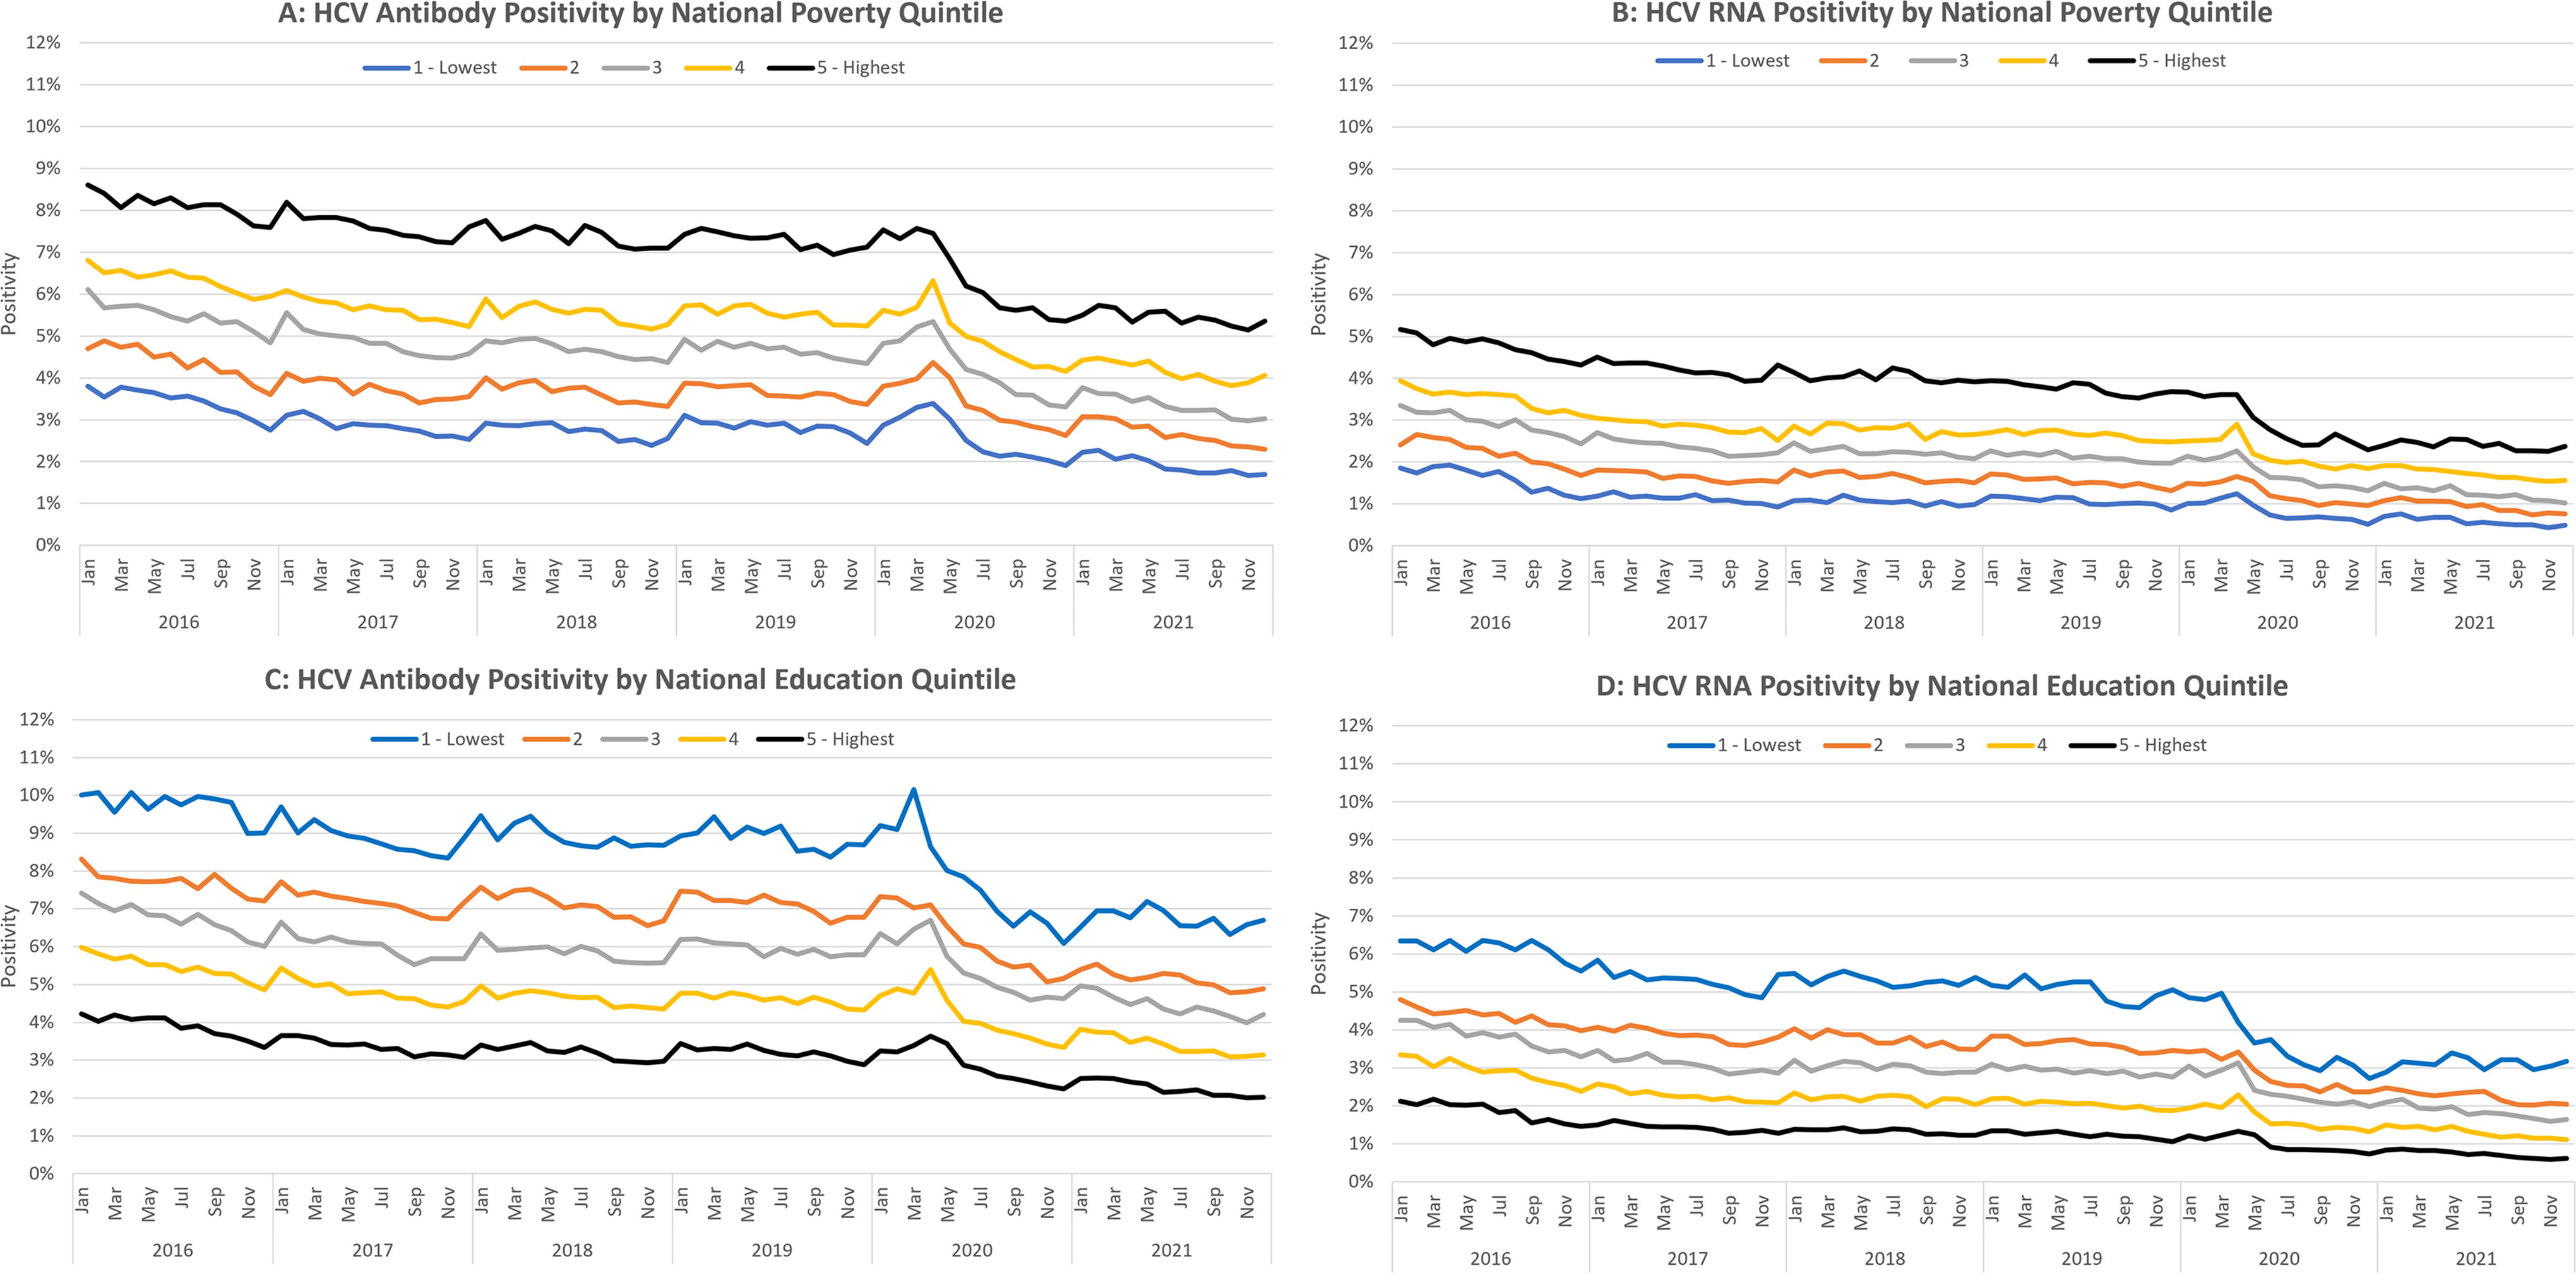
Trends of HCV antibody tests, HCV antibody positivity, and HCV RNA positivity rates by poverty and education quantile. HCV, hepatitis C virus.
HCV antibody positivity rates for predominant race and ethnicity communities were: Black non-Hispanic (5.0%, 95% CI: 5.0–5.0%), Hispanic (5.0%, 95% CI: 5.0–5.0%), and White non-Hispanic (4.9%, 95% CI: 4.9–4.9%). Similar patterns were demonstrated for HCV RNA positivity rates among predominant race and ethnicity communities: Black non-Hispanic (2.3%, 95% CI: 2.3–2.4%), Hispanic (2.4%, 95% CI: 2.4–2.4%), and White non-Hispanic (2.4%, 95% CI: 2.4–2.4%).
Other notable factors associated with elevated HCV antibody test positivity included rural individuals (8.4%, 95% CI: 8.3–8.4%) and those who received services from addiction medicine specialists (24.3%, 95% CI: 24.0–24.6%) and gastroenterology/hepatology specialists (11.2%, 95% CI: 11.1–11.3%). Specimens from individuals seeing obstetricians/gynecologists had notably low HCV antibody test positivity (1.3%, 95% CI: 1.3–1.3%). Factors associated with HCV RNA test positivity displayed similar patterns (Fig. 3).
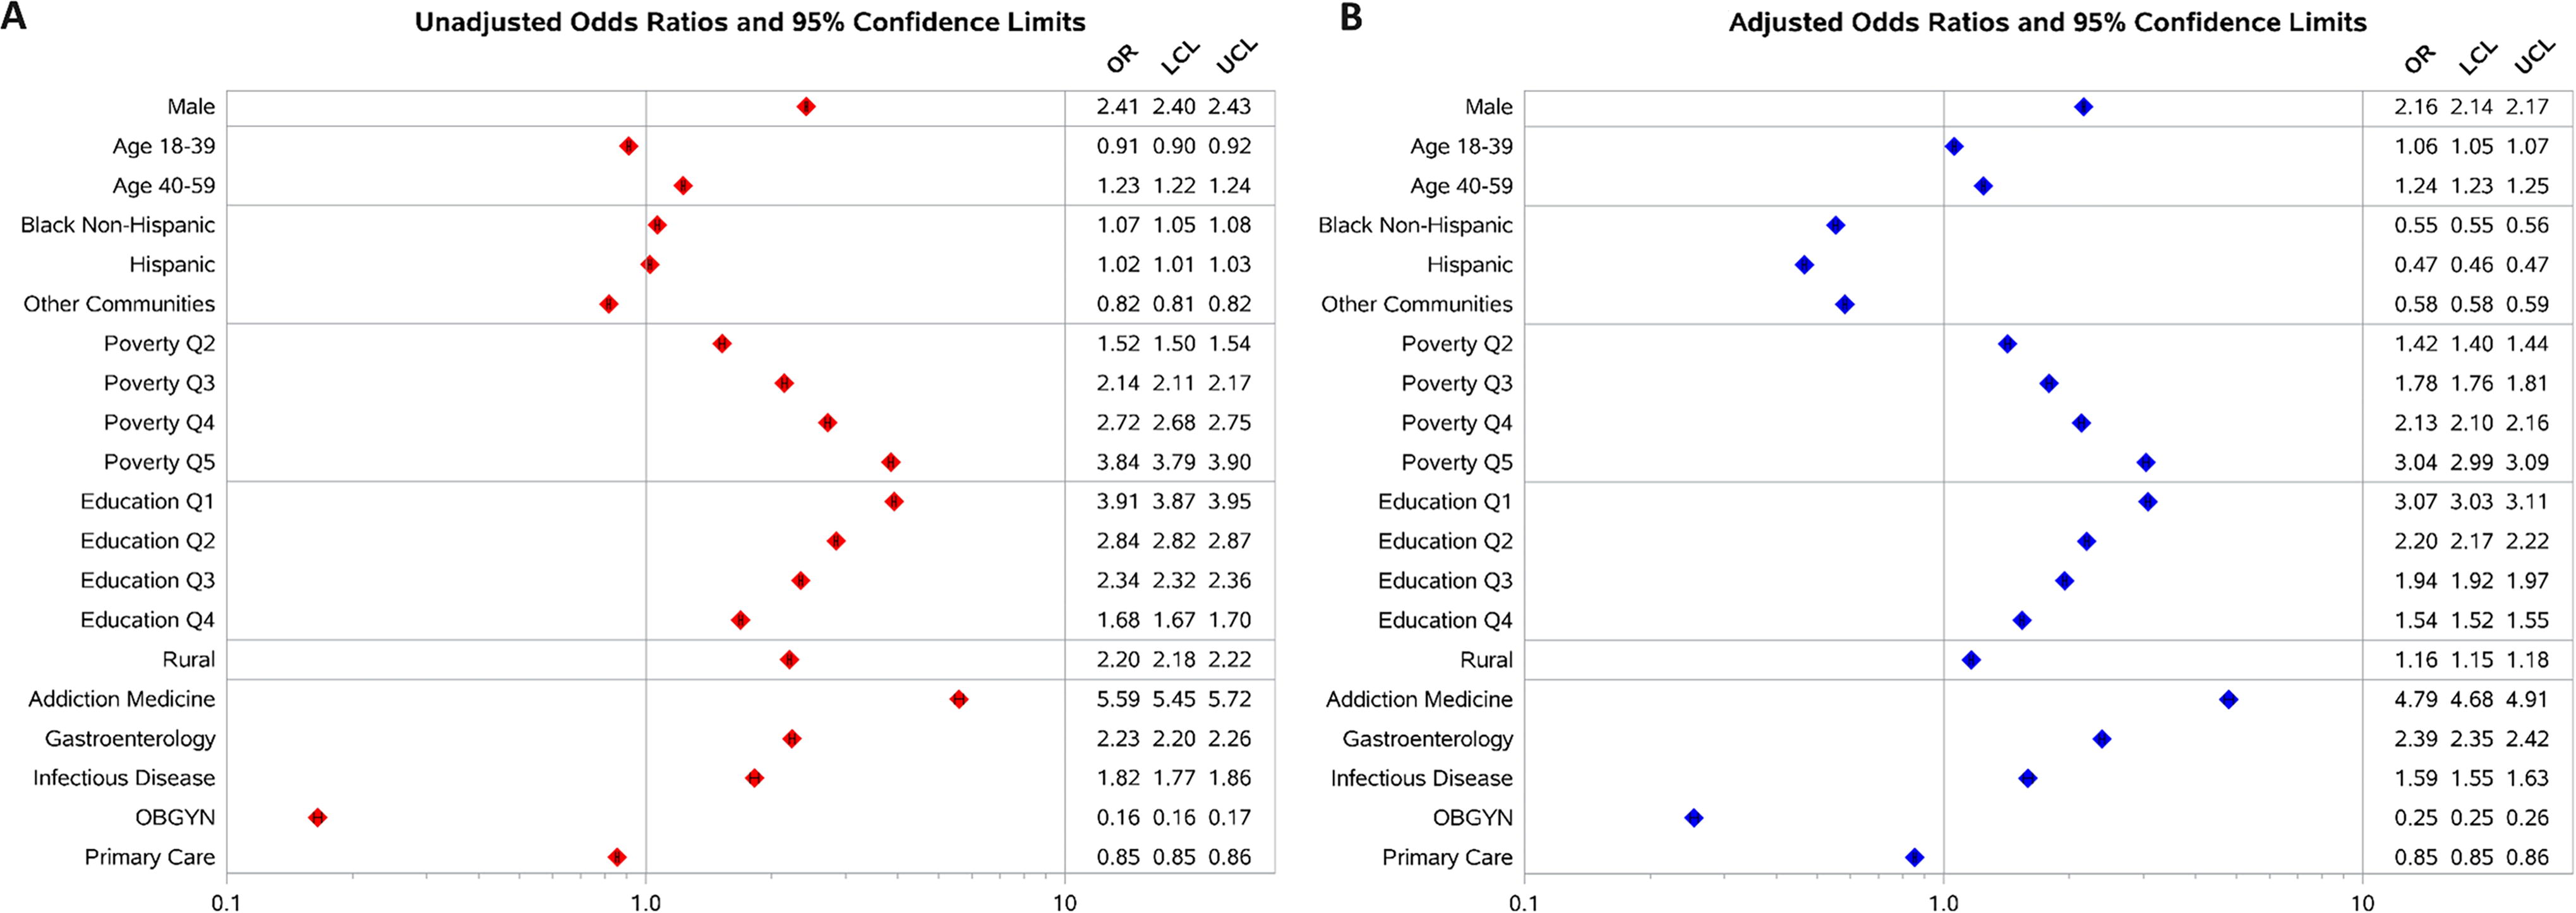
Factors associated with HCV RNA positivity. Reference groups are females, White non-Hispanic; national poverty Quintile 1 (lowest poverty), national education Quintile 5 (highest education), urban counties, and all other provider types. For multivariable models, AUC = 0.73. HCV, hepatitis C virus; AUC, area under the receiver operating curve.
In multivariable analysis adjusted for all factors examined in the study, the association between HCV RNA positivity and the SDOH elements explored in this study (poverty and education quintiles) remained strong, with clear stepwise increases in adjusted odds ratios (AORs; Fig. 3). While most unadjusted associations with HCV RNA positivity for many demographic and SDOH factors were confirmed in adjusted analyses, there were notable exceptions. Predominantly Black non-Hispanic communities were similar to predominantly White non-Hispanic communities in unadjusted analysis (odds ratio [OR]: 1.07, 95% CI: 1.05–1.08); however, after adjustment, individuals from Black non-Hispanic communities were significantly less likely to test positive for HCV RNA (0.55, 95% CI: 0.55–0.56). A similar pattern was observed for predominantly Hispanic communities (OR: 1.02, 95% CI: 1.01–1.03; AOR 0.47, 95% CI: 0.46–0.47). Patients living in rural areas demonstrated lower odds ratios in the adjusted model as well (OR: 2.20, 95% CI: 2.18–2.22; AOR: 1.16, 95% CI: 1.15–1.18). A multivariable model analyzing adjusted associations with HCV antibody positivity demonstrated similar associations (Fig. 4).
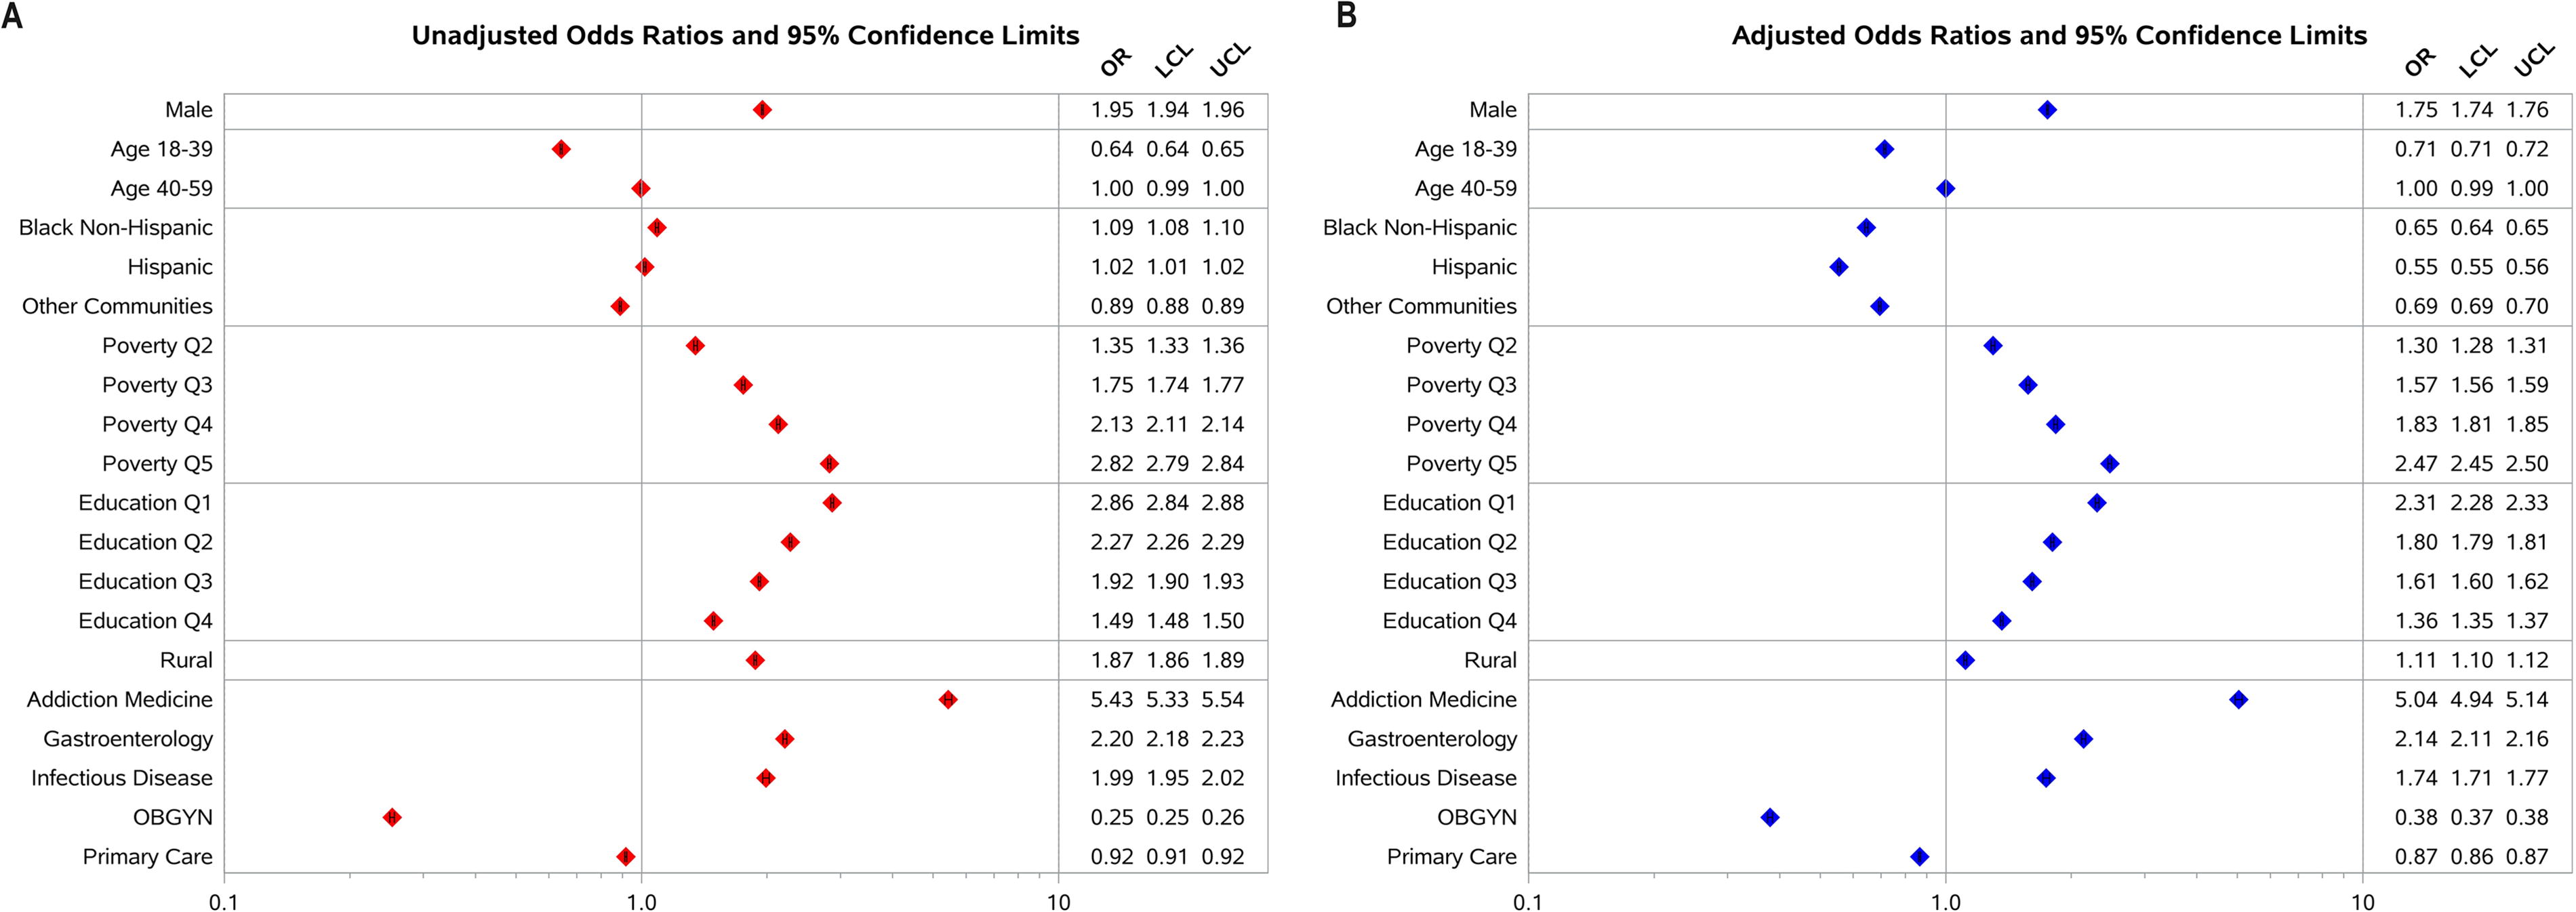
Factors associated with HCV antibody positivity. Reference groups are females, White non-Hispanic, national poverty Quintile 1 (lowest poverty), national education Quintile 5 (highest education), Urban Counties, and all other provider types. For multivariable models, AUC = 0.68. HCV, hepatitis C virus; AUC, area under the receiver operating curve.
Discussion
This study includes the largest HCV infection population sample size compared to previous studies by at least one order of magnitude. 8,9 In addition, both positive and negative HCV antibody and HCV RNA test results were included, which provide additional confidence in estimating the HCV infection rate in the United States. Overall, for the years 2016–2021, the volume of HCV antibody tests increased while the rate of HCV RNA positivity decreased. In 2020, the CDC released new testing recommendations. Although it is admittedly difficult to directly assess the impact of the change in recommendations, one possible explanation for the decrease in HCV RNA positivity may ostensibly be attributed to the inclusion of samples from adults at lower relative risk than those of prior guidelines: adults ≥18 years and pregnant women. However, this decrease was already apparent before 2020, suggesting overall HCV RNA positivity may have truly decreased. Furthermore, these results suggest the recent rise in cases of acute HCV infection reported by the CDC 4 is at least partially due to a significant increase in the number of people being tested, as evidenced by the 75% increase in testing during the study period. Examining poverty and education quintiles, HCV antibody and HCV RNA test positivity rates are consistently stratified and remarkably parallel through time. The differences in these positivity rates, too, are seemingly unaffected by the updated 2020 CDC testing recommendations. Unsurprisingly, increased HCV RNA test positivity rate was associated with higher poverty quintile and lower education quintile; there are many examples of increased poverty or lower education rates associated with increased risk for various infections. 10,16,17 Unexpectedly, however, and most interestingly, despite strong associations with poverty and education, the HCV RNA test positivity rates are approximately equal across race and ethnic groups. In fact, AORs demonstrate persons belonging to predominantly Black non-Hispanic or Hispanic communities are half as likely to test positively for HCV RNA than persons belonging to predominantly White non-Hispanic communities (0.55, 95% CI: 0.55–0.56 and 0.47, 95% CI: 0.46–0.47, respectively).
The results of this study align somewhat with previous literature, which demonstrated chronic HCV infections are more likely to be present in individuals with less education and lower family incomes. 8 However, contrary to previous studies, 8,9 while residents of predominantly Black non-Hispanic and Hispanic zip codes are also in zip codes with disproportionately higher levels of poverty and lower levels of education, the HCV antibody and HCV RNA test positivity rates were similar to those of residents of predominantly White non-Hispanic zip codes and, most importantly, substantially lower after adjustment. This study of a significantly expanded population sample size demonstrates that overall HCV infection prevalence is more uniform among zip codes characterized by predominant race and ethnicity throughout the United States. This critical observation suggests that intervention efforts that focus on the predominant racial/ethnic composition of zip codes may be misplaced; education- and poverty-focused efforts and policies may be more appropriate.
While race is not in itself a SDOH, structural racism is. Centuries of racism in the United States affect where people live, learn, and work and have created inequities in access to social and economic benefits. 18 Prior studies have recognized the importance of exploring the relationship between race/ethnicity and SDOH in many disease and infection outcomes. 17,19 –21 The data presented in Table 2 demonstrate that predominantly Black non-Hispanic and predominantly Hispanic communities are significantly more likely to have higher levels of poverty and lower levels of education than predominantly White non-Hispanic communities.
While this study is one of the largest HCV testing data sets in the United States, one major limitation is that patient data are sourced exclusively from persons who have access to health care in some capacity. There are many demographics and SDOH associated with decreased access to health care, including adults ages 30–59 years, male sex, Latino, Black, or Asian race, not having health insurance, and the geographical region of South as defined by the U.S. Census Bureau. 22 Lack of individual patient-level data for race/ethnicity, education, and poverty in this study is also an important limitation (eg, being a resident of a zip code that is predominantly Black non-Hispanic is not equivalent to being an individual of Black non-Hispanic background). There are other important factors associated with HCV infection that are not included in this analysis, including substance use, access to harm reduction services (syringe services programs and medications for opioid use disorder), and access to HCV treatments. Additionally, Quest Diagnostics is a major but not the only provider of HCV testing in the United States, which implies these results should be interpreted as coming from a large but not a nationally exhaustive source. Moreover, the CDC has expanded its HCV testing recommendations in recent years, as aforementioned, which conditionally recommend only specific patients be tested. This may have biasedly increased patient testing toward patients with lower relative risk than those of prior guidelines. Moreover, the substantial decrease in accessible health care during the COVID-19 pandemic, especially in the first few months, suggests HCV positivity rates during that time period should be interpreted with caution.
Conclusion
This study demonstrates a strong relationship between selected SDOH elements (education and poverty levels) and HCV infection throughout the study period. Predominantly Black non-Hispanic, Hispanic, and White non-Hispanic communities have remarkably similar HCV positivity rates despite significant differences in overall education and poverty levels. These findings may benefit targeted intervention initiatives by public health agencies, including increased testing and treatment in high poverty and/or low education communities.
Footnotes
Acknowledgments
The authors appreciate the input and review of earlier drafts by Dr. Hasan Symum, Dr. William W. Thompson, and Mr. Ademola Osinubi, all of the CDC.
Authors’ Contributions
J.K.N., W.A.M., and H.W.K. conceptualized and designed the study. J.K.N., A.P., and A.S. drafted the initial article. All authors critically reviewed and revised the article. All authors approved the final article as submitted and agree to be accountable for all aspects of the work.
Data Sharing Statement
Requests for data to researchers should be addressed to the corresponding author.
Author Disclosure Statement
J.K.N., H.W.K., and W.A.M. are employed or contracted by Quest Diagnostics and own stock in Quest Diagnostics. A.P. and A.S. are employees of Quest Diagnostics.
Funding Information
No funding was received for this article.