




Abstract
We investigated whether blood N-glycan changes can be used as a diagnostic biomarker for Alzheimer disease (AD). We used DNA sequencer-assisted, fluorophore-assisted carbohydrate electrophoresis (DSA-FACE) technology to assay N-glycans in sera from 79 autopsy-confirmed dementia patients and 149 healthy controls. One N-glycan (NA2F) was substantially decreased in AD patients but not in controls. Use of NA2F for discriminating AD between dementia patients and healthy controls showed a diagnostic accuracy of 85.7% ± 2.8% with 92% specificity and 70% sensitivity. The decrease in the level of NA2F in AD patients compared to non-AD patients was more pronounced in females (p < 0.0001) than in males (p < 0.014). Use of NA2F to differentiate female AD from female non-AD patients reached a diagnostic accuracy of 90.7% ± 4.8 %. Pearson correlation analysis showed that in female dementia patients, serum NA2F levels were significantly correlated with the cerebrospinal fluid (CSF) β-amyloid peptide of 42 amino acids (Aβ1–42) and tau phosphorylated at threonine 181 (P-tau181P) levels, whereas in male dementia patients serum NA2F levels were significantly correlated only with CSF total tau protein (T-tau) level. Thus, we suggest that the serum N-glycan marker might be suitable for longitudinal and follow-up studies.
Introduction
Diagnosis of probable AD is made according to clinical diagnostic criteria based mainly on the exclusion of other disorders, and the required diagnostic work up is time-consuming and expensive. 2 –4 Low average specificity levels of 48% for clinical diagnosis of possible AD reflect the overlap of clinical profiles between AD and non-AD dementias. 5 Because these clinical criteria lack diagnostic accuracy, definitive diagnosis of AD can only be made by post mortem examination of the brain.
A promising approach to increasing diagnostic accuracy is the use of cerebrospinal fluid (CSF) biomarkers. Many publications have confirmed the relevance of total tau protein (T-tau) and β-amyloid peptide of 42 amino acids (Aβ1–42) in the pathogenic processes associated with the disease, and have shown that the combined determination of these markers in CSF can have an added value in diagnosing AD. 6 –8 The combined assessment of CSF Aβ1–42, T-tau, and tau phosphorylated at threonine 181 (P-tau181P) could increase specificity of discriminating AD from other degenerative dementias. 6,9 However, routine clinical analysis of CSF biomarkers is hampered by the need for the invasive procedure of lumbar puncture. Because no specific “blood test” is currently available for AD diagnosis, 10 a specific serological marker, whether used alone or together with others, is needed for early detection of AD and dementia.
Protein glycosylation, the most common co-translational modification, plays an important biological role by influencing the functions of glycoproteins. 11 Glycoproteins are important for initiation of various cellular recognition signals that are essential for the maintenance of the ordered social life of each cell within a multicellular organism. 12 Because the biosynthesis of glycans is not controlled by interaction with a template but depends on the complicated concerted action of glycosyltransferases, the structures of glycans are much more variable than those of proteins and nucleic acids, and they can be easily altered by the physiological condition of the cells. Our recent study showed that the level of N-glycans in serum changes during healthy aging, 13 prompting questions about whether these changes can be used for diagnosis and prognosis of age-related disease, including the possible development of a biomarker for AD and/or dementia syndromes of neurodegenerative origin. As an early step in this direction, we studied changes in the blood N-glycome in autopsy-confirmed dementia patients and attempted to identify a blood sugar marker for diagnosis of AD.
Materials and Methods
Study population
Serum samples from 79 patients with autopsy-confirmed dementia were included. All sera samples were obtained from the Biobank, Institute Born-Bunge, Antwerp, Belgium. Two control groups were included: 50 samples from people older than 60 years (from the Biobank, Institute Born-Bunge) and 99 samples from people 20–60 years old (from the Red Cross, Ghent). Age and gender were recorded. For dementia patients, we also recorded the scores of the Mini-Mental State Examination (MMSE) 14 at the time of serum sampling, year of clinical diagnosis, clinical and pathological diagnoses, year of death, and date of autopsy. The study was approved by the local ethics committee (CME Middelheim Hospital, Antwerp). The healthy control samples received from the Red Cross in 2006 were stored at −80°C until analysis. The mean storage time (± standard deviation [SD]) for the dementia samples was 9 ± 3 years.
CSF and serum had been obtained during clinical work up of the patient. Most patients were at the moderate to severe dementia stages at serum sampling, as is reflected by the mean MMSE score in AD (10.5 ± 5.4) and non-AD (12.9 ± 9.2) patients. CSF was obtained by lumbar puncture at the L3/L4 or L4/L5 intervertebral space. All samples were stored at −80°C until analysis.
Pathological criteria
All diagnoses were established by the same neuropathologist who was blinded for the CSF results as described in detail in Engelborghs et al. 15 For AD patients, the neuropathological criteria of Braak and Braak 16,17 and of Jellinger 18 were applied, whereas frontotemporal dementia (FTD) patients were diagnosed neuropathologically according to Jackson and Lowe 19 and Markesbery 20 (1998). The pathological criteria of Kosaka et al. 21 were used for diagnosing dementia with Lewy bodies (DLB). Mixed dementia (MXD) and vascular dementia (VAD) were diagnosed according to Markesbery. 20
CSF analysis
CSF levels of Aβ1–42, T-tau, and P-tau181P were determined with commercially available single-parameter enzyme-linked immunosorbent assay (ELISA) kits from Innogenetics, Ghent, Belgium (respectively, INNOTEST® β-AMYLOID(1–42), INNOTEST® hTAU Ag, and INNOTEST® PHOSPHOTAU(181P)). All samples were run in duplicate. If the intraassay coefficient of variation was greater than 20%, samples were retested. If the concentrations obtained were out of range (optical density [OD] values not between mean OD values of highest and lowest calibrator concentration), samples were retested with an extension of the calibrator concentration range. The concentration ranges of the test kits are described in the package inserts (P-tau181P, 15.6–500 pg/mL; T-tau, 75–1200 pg/mL; Aβ1–42, 125–2000 pg/mL).
N-glycome analysis
The N-glycans were analyzed as described. 22 In brief, the N-linked glycans present on the serum proteins in 2 μL of serum were released by peptide N-glycosidase F (PNGaseF; New England Biolabs) and derivatized with 8-amino-1,3,6-pyrenetrisulfonic acid (APTS; Molecular Probes, Eugene, CA). The labeled N-glycans were analyzed by DNA sequencer-assisted, fluorophore-assisted carbohydrate electrophoresis (DSA-FACE) technology using a capillary electrophoresis (CE)-based ABI3130 sequencer. Data were analyzed with the GeneMapper v3.7 software (Applied Biosystems, Foster City, CA). We measured the heights of the peaks that were detected in all the samples, obtained a numerical description of the profiles. The intra- and interassay CVs of the glycan analysis are less than 5%.
Statistical analysis
Statistical analyses were performed with SPSS 15.0 for Windows software (SPSS, Chicago, IL). Results are presented as means ± SD. All reported p values are two-tailed, using a t-test for independent samples. Pearson coefficients of correlation (with 95% confidence intervals and their associated probability, p) were used to evaluate the strength of linear dependence between two variables. The correlation coefficient is denoted by r. The receiver operating characteristics (ROC) curve was used as an index of accuracy; values close to 1.0 indicate high diagnostic accuracy.
Results
Description of the study population
The neuropathologically diagnosed dementia patients (n = 79) consisted of 48 AD patients (n = 24 females, n = 24 males) and 31 patients with other dementias (n = 13 female, n = 18 male). The other dementias, which included FTD, DLB, and VAD, were pooled as a group of non-AD. The MMSE score and CSF analyses of the patients and age-matched controls (>60 years) are summarized in Table 1. The MMSE scores were significantly lower (p < 0.0001) in AD and non-AD patients than in the age-matched healthy group (age >60 years). The value of Aβ1–42 in CSF was lower in dementia patients than in age-matched controls (age >60 years), but the difference was significant only for AD patients (p = 0.041), not for non-AD patients (p = 0.596). The mean values of T-tau and p-tau181p were higher in AD patients compared to age-matched controls (age >60 years), but the difference was not statistically significant.
p < 0.0001 compared to healthy group of age >60 years.
p < 0.05 compared to healthy group of age >60 years.
CSF, Cerebrospinal fluid; MMSE, Mini-Mental State Examination; T-tau, total tau-protein ; P-tau181P, tau phosphorylated at threonine 181; Aβ1–42, β-amyloid peptide of 42 amino acids; SD, standard deviation; AD, Alzheimer disease.
We used DSA-FACE to determine the N-glycome profiles of desialylated sera obtained from patients with AD (n = 48) or non-AD (n = 31), as well as from healthy controls (n = 149). The N-glycans detected in serum are represented as peaks, and their structures are shown in Fig. 1. The relative concentration of each N-glycan was quantified by normalizing the height of its peak to the sum of the heights of all peaks in the profile (Supplementary Fig. S1).
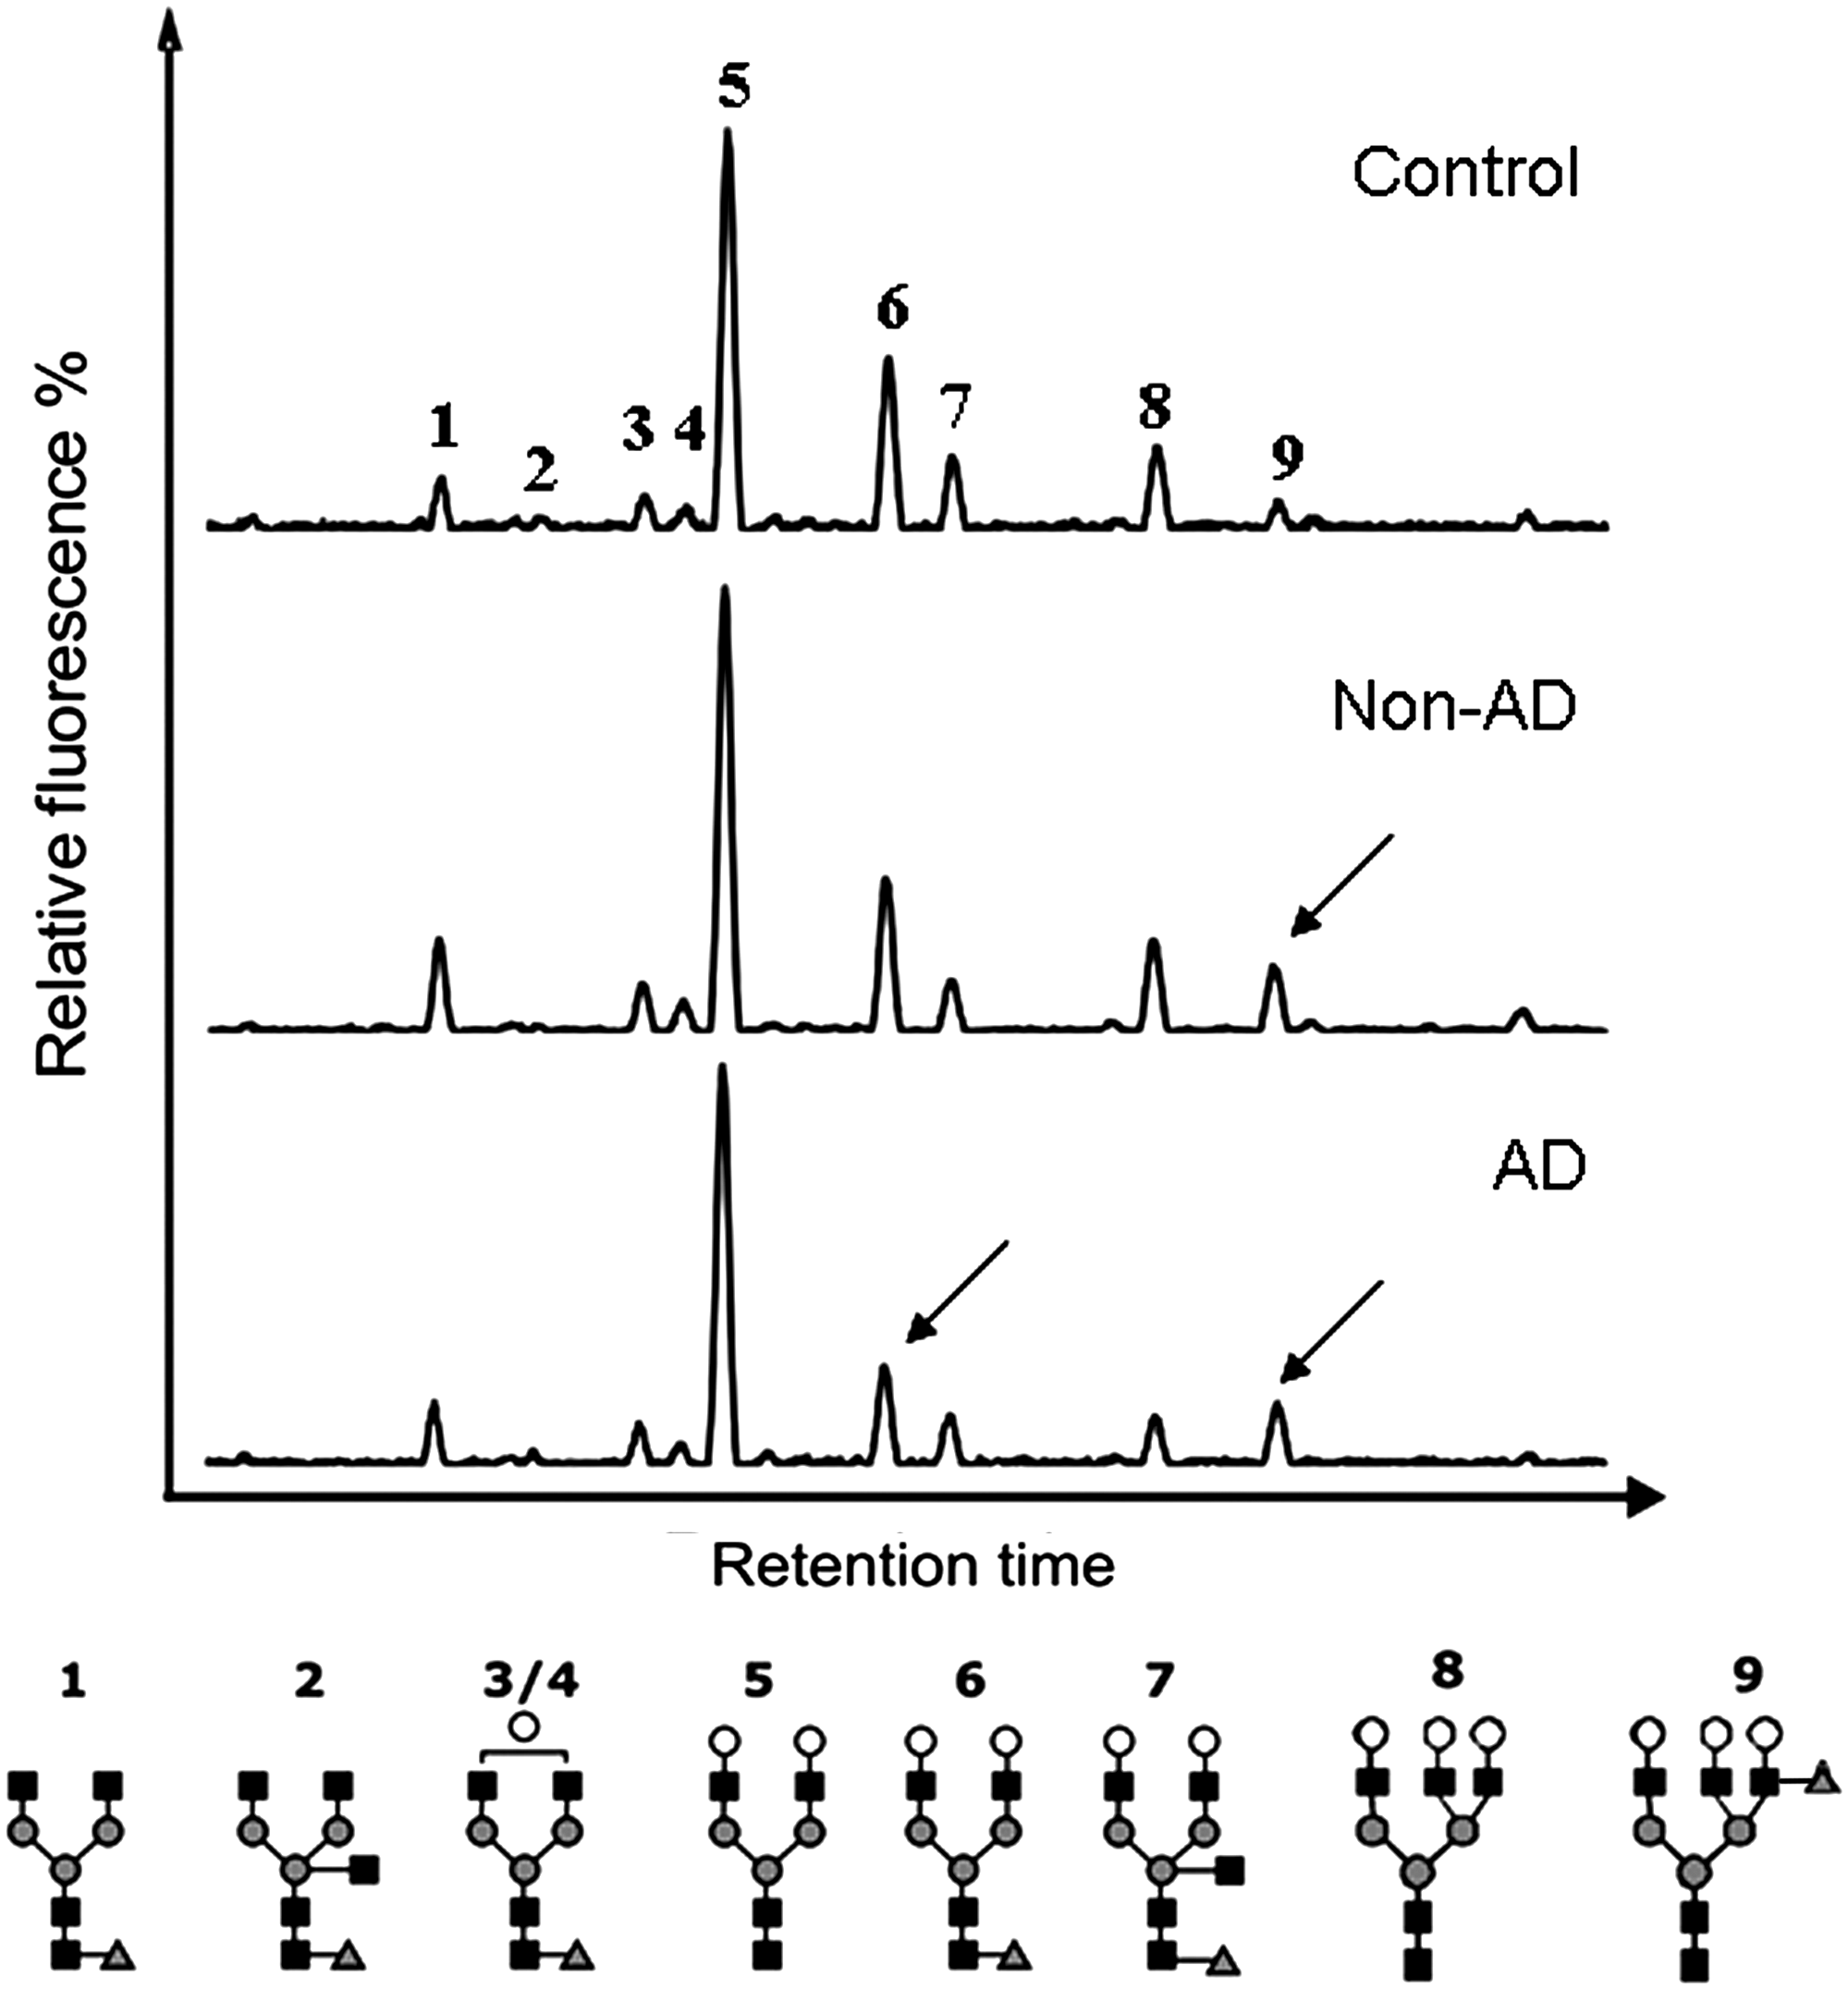
A typical desialylated N-glycan profile from total serum protein. The middle and lower panels represent non-Alzheimer disease (AD) and AD patients, respectively. The arrowhead indicates altered N-glycan in the patients compared to age matched controls (upper panel). The structures of the N-glycan peaks are shown below the panels. The vertical axis represents the glycan values of the peaks as percent relative to fluorescence level. The horizontal axis represents the retention time of N-glycans. Peak 1 is an agalacto, core-α-1,6-fucosylated biantennary glycan (NGA2F), peak 2 is an agalacto, core-α-1,6-fucosylated bisecting biantennary (NGA2FB), peak 3 and peak 4 are single agalacto, core-α-1,6-fucosylated biantennaries (NG1A2F), peak 5 is a bigalacto, biantennary glycan (NA2), peak 6 is a bigalacto, core-α-1,6-fucosylated biantennary (NA2F), peak 7 is a bigalacto, core-α-1,6-fucosylated bisecting biantennary (NA2FB), peak 8 is a tri-antennary (NA3), and peak 9 is a branching α-1,3-fucosylated tri-antennary (NA3Fb). (▪) β-Linked N-acetylglucosamine (GlcNAc); (○) β-linked galactose; α-1,3/6-linked fucose; (▴) α/β-linked mannose.
Decreased level of NA2F in AD patients
The level of peak 6 (a core-α-1,6-fucosylated biantennary; NA2F) in healthy adults was lower in those >60 years than in those <60 years, consistent with our previous study. 13 However, NA2F was substantially decreased in AD patients compared to an age-matched control group (>60 years) (Fig. 2); the difference was significant in females (p < 0.003), but not in males (p < 0.344). Compared to age-matched non-AD patients, both male and female AD patients had significantly lower NA2F (p < 0.014 and p < 0.0001, respectively) (Fig. 2).
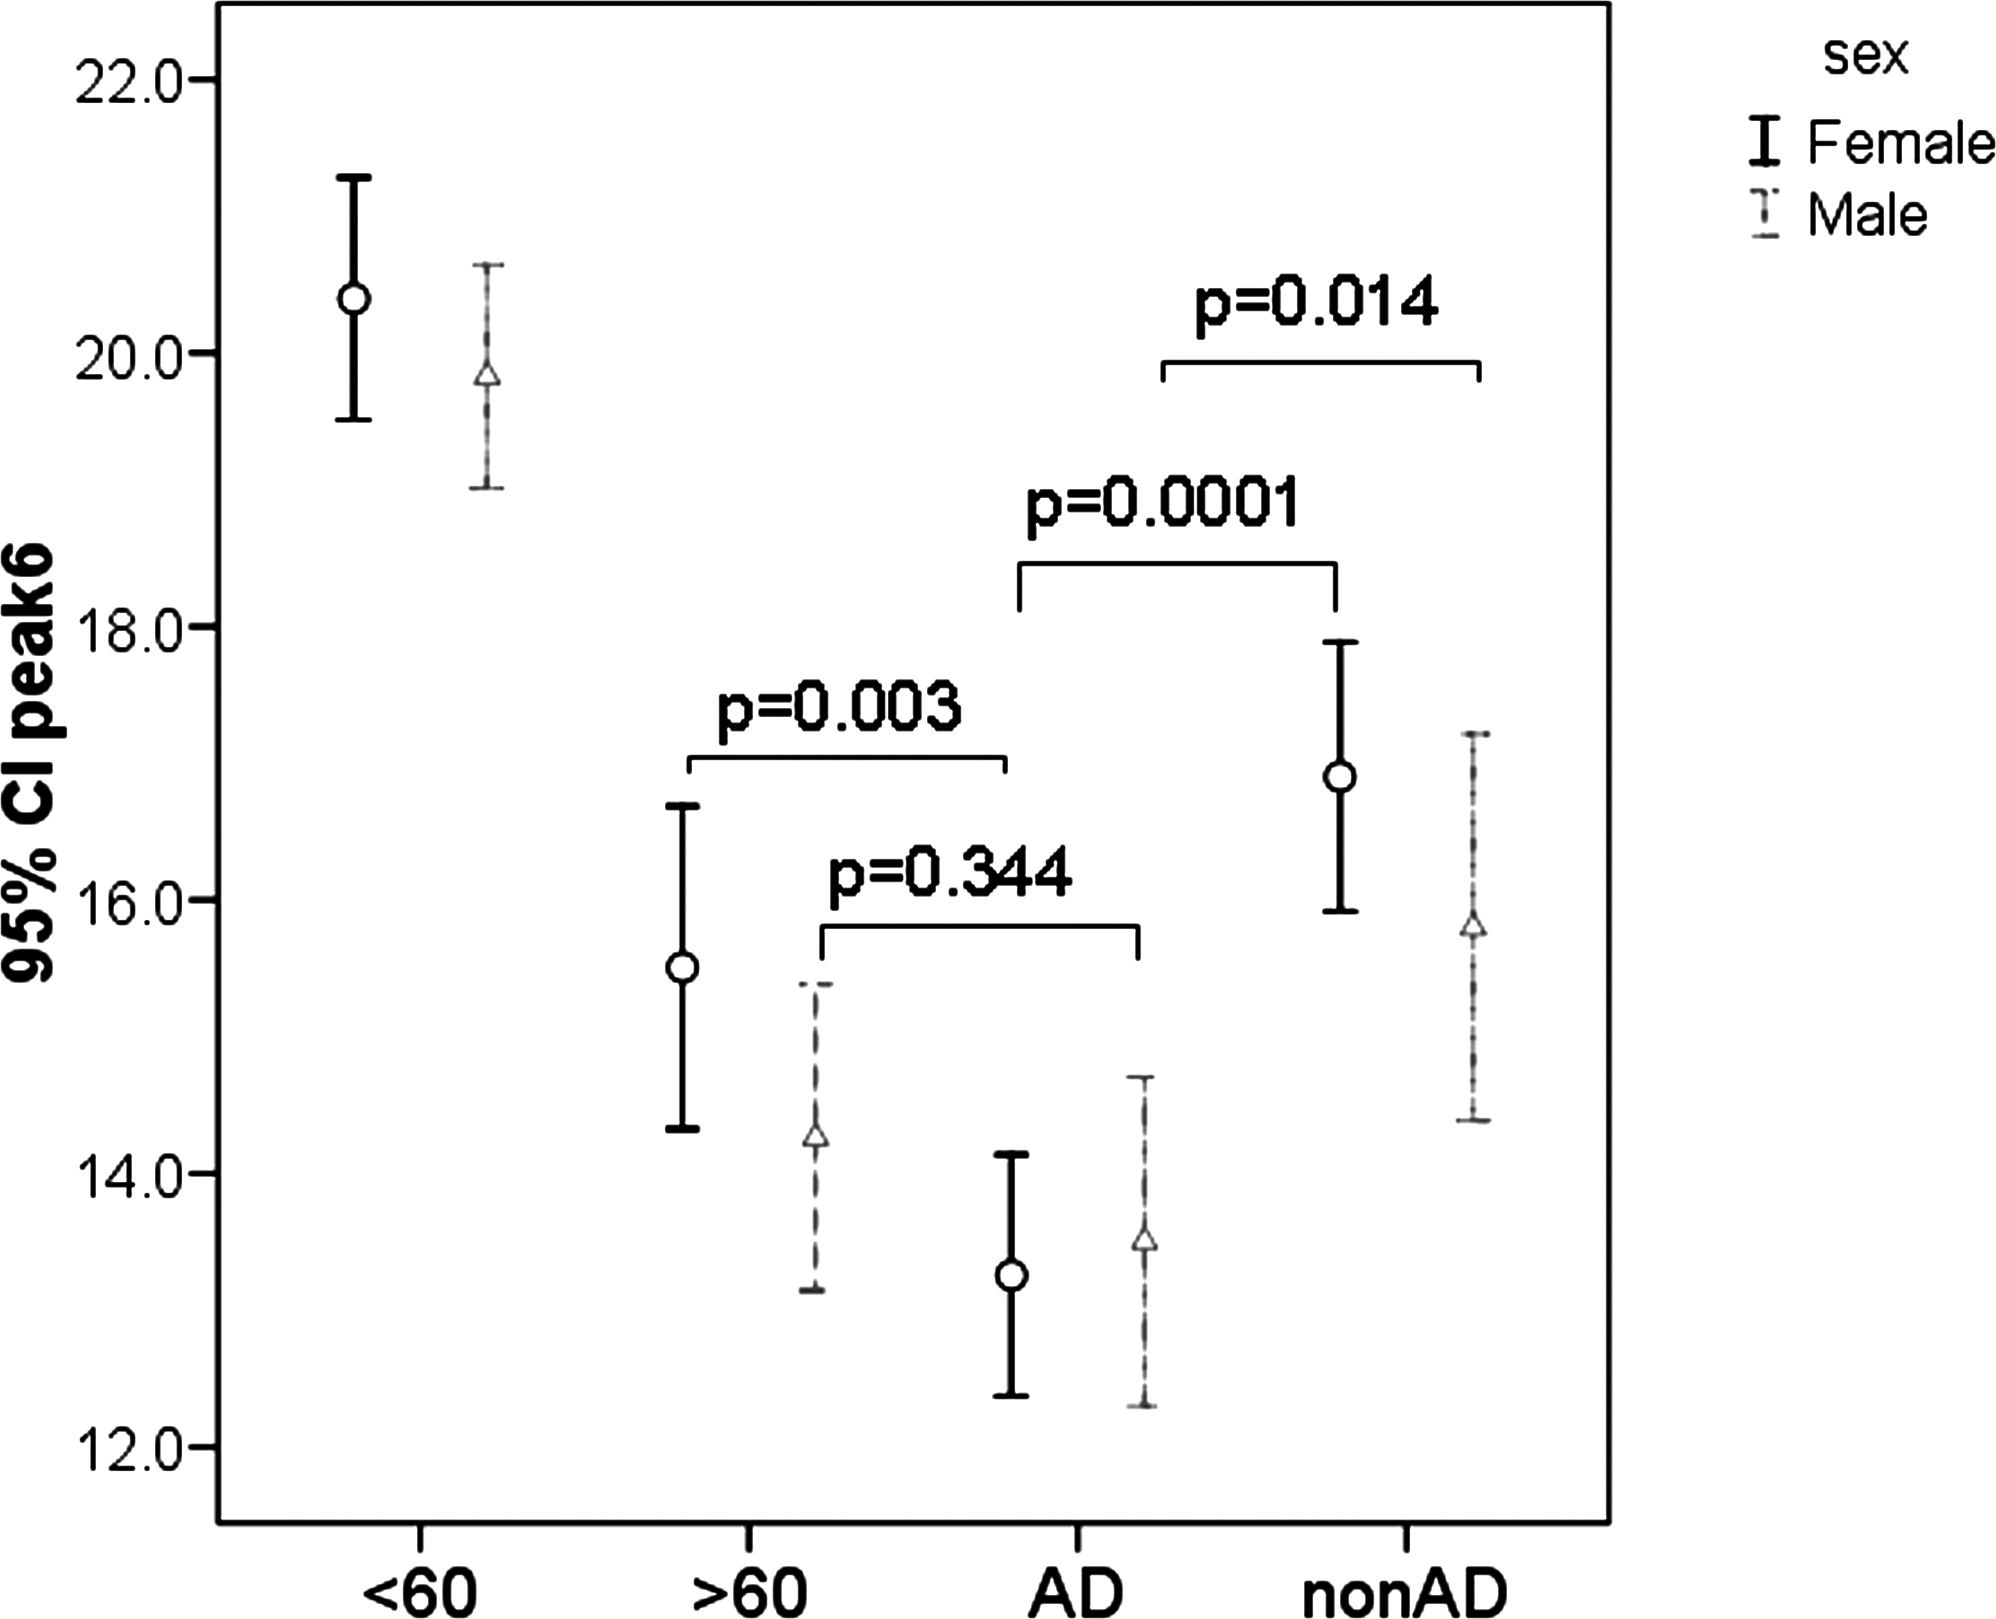
A diagnostic variable peak 6 (bigalactosylated, core-α-1,6-fucosylated biantennary; NA2F) for the detection of Alzheimer disease (AD) in dementias. The vertical axis represents the glycan value of peak 6 (NA2F). The glycan value of peak 6 was significantly lower in AD patients (n = 48; age = 80.0 ± 8.6 years) compared to age-matched non-AD patients (n = 31; age = 74.7 ± 9.6 years) and age-matched healthy controls (age >60: age = 78.0 ± 5.1 years). Error bars represent 95% confidence intervals (CI) for the means.
ROC curve analysis showed that peak 6 (NA2F) could distinguish AD patients (n = 48) from non-AD patients and healthy controls (n = 180) with an overall accuracy of 85.7 ± 2.8% with 92% specificity and 70% sensitivity (for NA2F cutoff value of 16) (Fig. 3). As the decreased level of NA2F was significant when using peak 6 (NA2F) to discriminate female AD (n = 24) from female non-AD (n = 13) patients and female healthy controls (n = 76), the diagnostic power improved and reached 90.2 ± 3.1%.

Receiver operating characteristic (ROC) curve for prediction of clinically significant discrimination of Alzheimer disease (AD) patients (n = 48) from the non-AD patients and healthy individuals (n = 180) using the value of peak 6 (NA2F). Area under the curve (AUC) shows the diagnostic power of peak 6 (85.7% ± 2.8%). The dashed line indicates sensitivity and specificity for bigalactosylated, core-α-1,6-fucosylated biantennary (NA2F) cutoff value of 16.
Altered N-glycan profiles in female dementia patients
The level of peak 9 (NA3Fb), a branching α-1,3-fucosylated trigalactosylated tri-antennary, was significantly higher (p < 0.006) in the female dementia patients (including AD and non-AD) compared to age-matched controls (Fig. 4). Although the level of peak 9 in male dementia patients was as high as in female patients, it was not significantly different (p < 0.966) from the male age-matched group (>60 years). This could be due to the high levels of peak 9 in age group of >60 years.
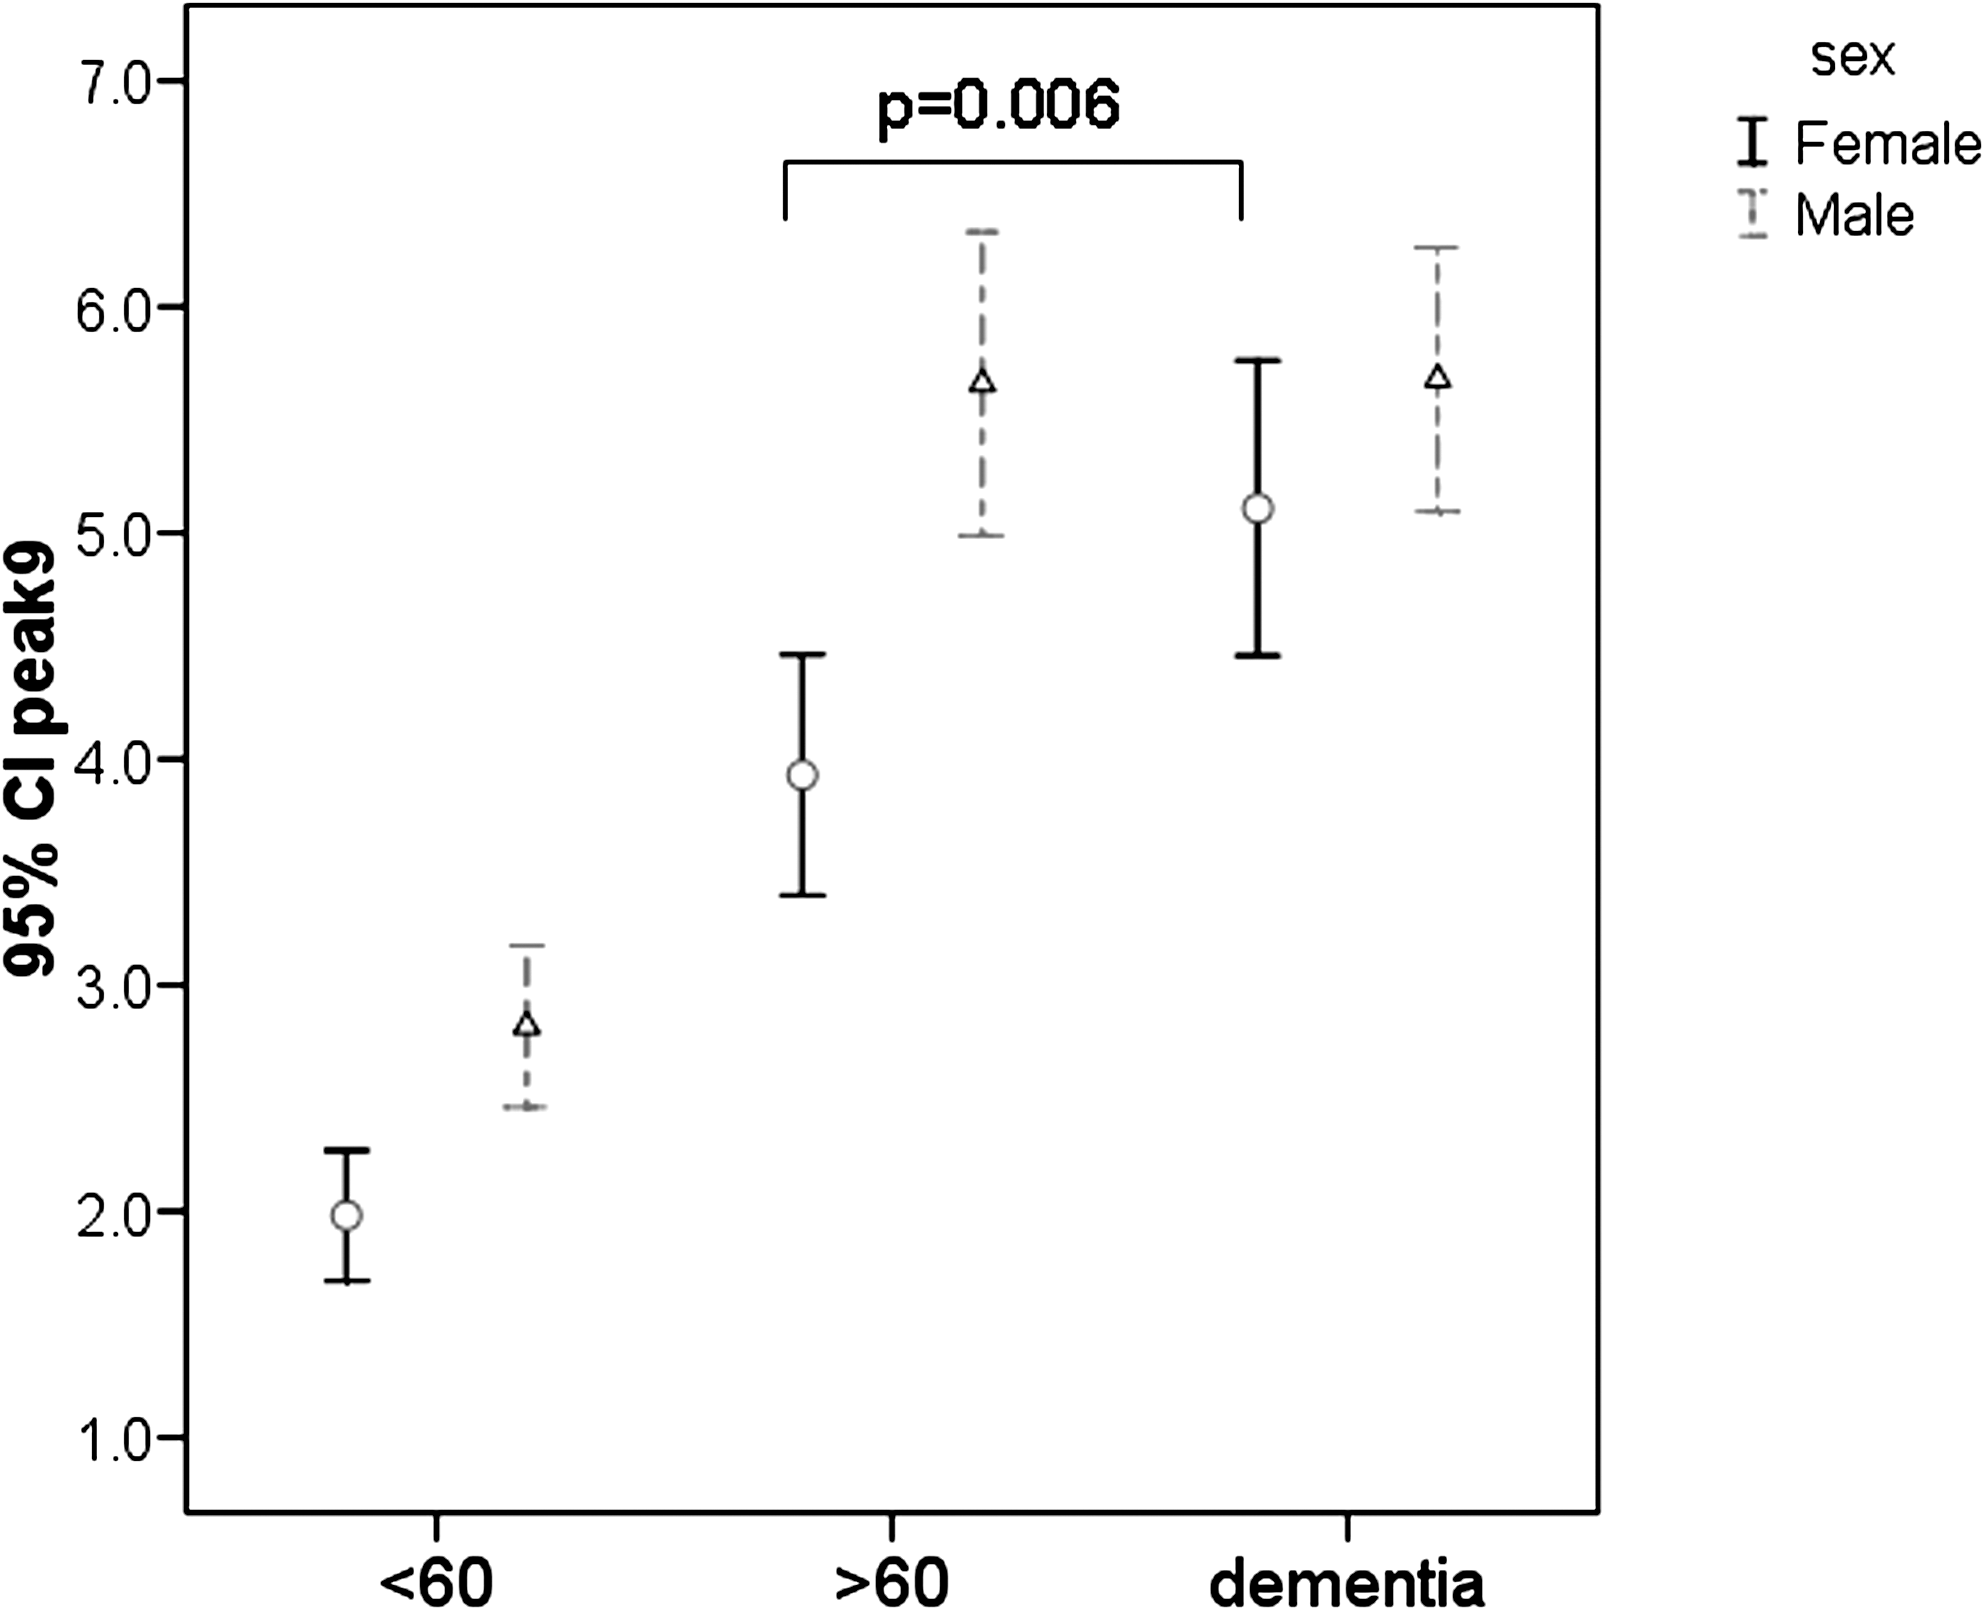
A diagnostic variable peak 9 (branching α-1,3-fucosylated trigalactosylated tri-antennary; NA3Fb) for the detection of dementia patients. The level of peak 9 was significantly (p = 0.006) increased in female dementia patients compared to age-matched controls (>60 years). The vertical axis represents the peak 9 height. Error bars represent the 95% confidence intervals (CI) for the mean values.
ROC curve analysis showed that peak 9 (NA3Fb) had an overall accuracy of 86.6% ± 3.5% for distinguishing female dementia patients (n = 37) from female healthy controls (n = 76).
Correlation of N-glycan NA2F with CSF biomarkers
Correlations among glycans, CSF biomarker levels, and MMSE scores in dementia patients were analyzed by the Pearson correlation coefficient test. The N-glycans (NA2F and NA3Fb) did not correlate with the MMSE score. Interestingly, NA2F was associated with CSF biomarkers: In female dementia patients, the level of NA2F (peak 6) was positively correlated with Aβ1–42 level (γ = 0.382, p < 0.026) and negatively with CSF P-tau181P level (γ = −0.3957, p < 0.021), but not significantly correlated with T-tau levels (γ = −0.291, p < 0.095). In contrast, the level of peak 6 in male patients was negatively correlated with CSF T-tau levels (γ = −0.319, p < 0.042), but not significantly with levels of P-tau181P (γ = −0.285, p < 0.070) and Aβ1–42 (γ = −0.206, p < 0.196). The level of NA3Fb (peak 9) was not correlated with CSF biomarker levels in either female or male patients. The MMSE score was not correlated with the CSF biomarker levels in either female or male patients (AD and non-AD). CSF P-tau181P levels were positively correlated with T-tau in female (γ = 0.610, p < 0.0001) and male (γ = 0.498, p < 0.001) dementia patients (AD and non-AD). However, CSF levels of Aβ1–42 were correlated neither with the level of P-tau181P nor with T-tau in either female or male dementia patients.
Discussion
Previously, we showed that several serum glycans change during human aging. 13 Here, we studied serum glycomics in AD and non-AD dementia patients in whom diagnoses were confirmed by postmortem neuropathological examination of the brain. Among dementia patients, the relative level of NA2F (peak 6) in non-AD patients was not different from an age-matched group, whereas a decreased relative level of NA2F was observed in AD patients, particularly in female patients. For identifying AD from non-AD dementia patients, NA2F showed a diagnostic accuracy of 82.3% ± 4.9%. Because it is notoriously difficult to discriminate AD from non-AD dementia using CSF biomarkers, the serum glycan marker NA2F (peak 6) could provide a valuable supplementary tool to be used with other biomarkers for differential diagnosis of AD from other dementias.
AD is characterized by the formation in the brain of plaques composed of Aβ and tangles composed of hyperphosphorylated tau. 22 CSF of AD patients shows decreased levels of Aβ-42 and increased total tau (T-tau) or phosphorylated tau (p-tau). 23,24 Amyloid precursor protein (APP) is a single transmembrane polypeptide that is co-translationally modified with N- and O-linked sugars. 25 Monosaccharide composition analysis and specific lectin staining indicated that tau in AD brain is glycosylated mainly through N-linkage. 26,27 Wang et al. 28 showed that paired helical filament (PHF) tangles isolated from AD brains are glycosylated, whereas no glycan is detected in normal tau, suggesting that tau is disease-specifically N-glycosylated in AD brain. It was proposed that N-glycosylated tau is more rapidly phosphorylated by kinases, 26 which could explain the well-known high degree of phosphorylation of P-tau in AD. 27,29 N-glycosylation normally occurs in the rough endoplasmic reticulum (RER) and Golgi apparatus and is generally believed to be restricted to membrane-bound and secreted proteins. It is unknown how tau, a cytoplasmic protein, is glycosylated in AD brain. The disruption of the vesicular transport system observed in AD brains suggests that defects in the membrane trafficking system, including axonal vesicular transport, might be a cause of AD pathogenesis. 30 In this study, we found significant correlations between concentrations of NA2F (peak 6) on the one hand and CSF Aβ1–42 and P-tau181P levels on the other hand in female dementia patients, and between concentrations of NA2F (peak 6) and CSF T-tau levels in male dementia patients. It is conceivable that the alteration of N-glycosylation in AD could affect a glycoprotein's activity, its binding to its substrate, or its secretion rate as it is trafficked through the endoplasmic reticulum (ER) and Golgi apparatus.
In conclusion, the serum N-glycan profile is altered during development of AD. Serum N-glycan profiling, a noninvasive blood test, might be suitable for longitudinal and follow-up studies of AD. Development of a valid, reliable blood glycan biomarker for AD will aid clinicians in recognizing the disease in its earliest symptomatic stages, and might also help to identify the illness before dementia or other symptoms appear. As disease-modifying pharmacological treatments for AD become available, early diagnosis will permit early intervention and could enhance drug therapy outcomes. 31 –34 However, the usefulness of glycome diagnostics for screening, follow up, and management of AD or dementia patients should be evaluated further in independent neuropathologically confirmed cases.
Footnotes
Acknowledgments
We thank Dr. Amin Bredan for editing the manuscript. The authors thank all blood donors for their participation and B. Vandekerckhove of the Blood Transfusion Center of the Red Cross, Ghent. This work was supported by a grant from Ghent University (BOF No. 01106205), Flanders-China Bilateral project (011S605), the Institute Born-Bunge, the central Biobank facility of the Institute Born-Bunge–University of Antwerp, International Alzheimer Research Foundation (Stichting voor Alzheimer Onderzoek), the Interuniversity Attraction Poles (IAP) program P6/43 of the Belgian Federal Science Policy Office, the Methusalem Excellence Grant of the Flemish Government, Medical Research Foundation Antwerp, Neurosearch Antwerp, the Thomas Riellaerts Research Fund, the Research Foundation–Flanders (FWO–F; grant no G.0127.07), and the Institute for Promotion of Innovation through Science and Technology in Flanders (IWT-Vlaanderen). N.L.B. holds a National Grant of UNESCO-L'Oréal for Women in Science and is a Ph.D. fellow of the Research Foundation–Flanders (FWO-F).
References
Supplementary Material
Please find the following supplemental material available below.
For Open Access articles published under a Creative Commons License, all supplemental material carries the same license as the article it is associated with.
For non-Open Access articles published, all supplemental material carries a non-exclusive license, and permission requests for re-use of supplemental material or any part of supplemental material shall be sent directly to the copyright owner as specified in the copyright notice associated with the article.
