




Abstract
Background:
Adiponectin, leptin, and resistin are involved in bone metabolism, but the evidence regarding their effects is not conclusive. We analyzed the relationship between these adipokines, vitamin D, and bone health using a cluster analysis approach.
Methods:
We used cross-sectional data coming from the InCHIANTI study, in which bone density and area were estimated using computed tomography. The sample size was 690 (women, 57.5%; mean age, 75.2 years; range, 65–102). Five clusters were generated on the basis of gender, age, adipokines, and vitamin D concentrations. The clusters were characterized, respectively, by higher resistin and older age (hR-O, n=134), higher vitamin D and younger age (hD-Y, n=152), higher adiponectin (hA, n=65), and higher leptin (hL, n=52). The last cluster had intermediate values of all the constituting variables (I, n=287). The clusters were compared with respect to bone parameters and clinical characteristics.
Results:
Cluster hR-O had the lowest total and cortical bone density. Cluster hD-Y had the lowest adiponectin (9.29 g/mL) and leptin (7.9 ng/mL) serum concentrations, the highest prevalence of men (71.1%), and total/cortical bone density and area. No statistically significant difference across clusters was observed for age- and sex-standardized measures of bone mineral density and bone area, but leptin was associated with these parameters in a linear model adjusted for age, gender, vitamin D, resistin, and leptin.
Conclusions:
In an elderly population, age and sex almost completely explain the variability in bone status across cluster characterized by different levels of circulating adipokines and vitamin D. The role of leptin, however, seems worthy of consideration.
Introduction
T
The poor concordance between experimental and clinical studies and the complexity of the network of factors conditioning bone health make the available evidence on the effects of individual adipokines far from being conclusive. Vitamin D and adipokines not only act on bone independently, but also are linked by complex relationships. In experimental models, adiponectin expression is enhanced by 52% by a high-calcium diet, 16 whereas a positive association between vitamin D and adiponectin was found in young subjects 17 and in healthy adults from the Framingham Offspring Study. 18 Baseline leptin, instead, is associated with decrease in vitamin D serum concentration over a follow-up of 2.5 years in a cohort of elderly people. 19
So far, the relationship between adipokines and bone density has been analyzed taking into account the effect of individual adipokines on BMD. In this approach, other adipokines are modeled as confounders or effect modifiers, and potentially important patterns of adipokines corresponding to different states of bone health may go undetected. The objective of this study is to analyze the relationship between adipokines, vitamin D, and bone health using a cluster analysis approach. This type of analysis classifies patients on the basis of their state with regard to the variables of interest without any a priori assumption. We used data from a large cohort of community-dwelling elderly people in which information on different bone characteristics (trabecular and cortical bone mass; total, cortical, and medullary cross-sectional area) were obtained using peripheral quantitative computed tomography (pQCT). The database also provides a wide array of clinical and laboratory data that allow verification of whether the clusters obtained on the basis of adipokines and vitamin D pattern are clinically and biologically different.
Methods
Study population
We used data from the InCHIANTI study, which was designed to investigate the factors contributing to the decline of mobility in older persons. 20 The participants in the study were randomly selected from the populations of two town areas in the Chianti region, Greve in Chianti and Bagno a Ripoli. The Italian National Institute of Research and Care on Aging ethical committee approved the study protocol. Participants received an extensive description of the study and signed an informed participation consent that included permission to conduct analyses on the biological specimens collected and stored. For those unable to consent fully because of cognitive or physical problems, surrogate consent was also obtained from a close relative. The eligible participants were interviewed at their homes by trained study researchers using a structured questionnaire aimed at investigating their health status, their physical and cognitive performance, and other factors possibly related to loss of independence in late life. The interview was followed by a physical examination at the study clinic.
Laboratory data
Blood samples obtained after the patient had fasted for 12 hr and rested for at least 15 min were centrifuged and stored at −80°C until analyzed. Serum 25-OH vitamin D was measured by radioimmunoassay (RIA kit; DiaSorin, Stillwater, Minnesota), and intra-assay and inter-assay coefficients of variation were 8.1% and 10.2%, respectively. 21 Serum adiponectin was measured using RIA assay (Human Adiponectin RIA Kit; LINCO Research, Inc., St. Charles, MO; minimum detectable concentration (MDC)=1 ng/mL in 100 μL sample, coefficient of variation [CV]<10%). Serum leptin was determined using enzyme-linked immunosorbent assay (ELISA; Human Endocrine LINCOplex Kit; MDC=1 ng/mL in 100 μL sample, CV<7%). Serum resistin concentration was measured using ELISA assay (Alpco Diagnostics, Salem, NH; MDC=0.2 ng/mL, CV<7%). 22
Estimation of bone parameters
Bone mass density was estimated using pQCT using a XCT 2000 device (Stratec Medizin-technik, Pforzheim, Germany). The tibio-talar joint was identified using a pQCT longitudinal scout and used as an anatomic marker for the identification of measurements sites. Standard (2.5-mm thickness) transverse scans were obtained at 4% and 38% of tibial length to measure trabecular and cortical bone density, respectively. The cross-sectional images obtained by pQCT were analyzed using BonAlyse software (BonAlyse Oy, Jyvaskyla, Finland) that automatically identifies cortical and trabecular bone and assesses its density. Areas with density values >710 mg/cm were considered as cortical bone, whereas areas with densities between 180 and 710 mg/cm were considered as trabecular bone. We also took into account the cortical bone area at 38%, defined as the surface between the external and the internal margin of the cortical ring, and the medullary cross-sectional area at 38%, defined as the difference between the total area within the periostium and the cortical bone area. 23 BMD and bone area parameters were expressed as absolute variables and as age- and sex-standardized values.
Sample selection
From the 1092 participants with laboratory data, we excluded those using corticosteroids or hormone replacement therapy and those diagnosed with diabetes or hyperthyroidism (n=192). Finally, to avoid the heterogeneity related to different menopausal state, we excluded participants aged <65 years (n=210). The final sample size was 690.
Analytic approach
We used a k-means cluster analysis to divide participants on the basis of serum adiponectin, leptin, resistin, and vitamin D concentration. Because these variables are likely to be dependent on age and gender, we also included these variables in the cluster analysis. We opted for a five-cluster solution based on the number variables taken into account and on the graphical evaluation of the within-group sum of squares obtained with different number of cluster. Each cluster expresses the pattern of the biochemical variables included that best differentiate patients into distinct groups. The first cluster was characterized by older age (mean=85 years, standard deviation [SD]=5.6), a relatively high prevalence of men (46%), and higher resistin concentration (5.64 ng/mL) (pattern hR-O, n=134). This cluster was also characterized by the lowest concentration of vitamin D (32.4 nmol/L), and by relatively low leptin concentration (9.4 ng/mL).
The second cluster had the lowest mean age (70.2 years, SD=4.1), was made up predominantly by men (71%), and had the highest concentration of vitamin D (90.3 nmol/L) (pattern hD, n=152). This group had the lowest mean concentration of both adiponectin (9.3 ng/mL) and leptin (7.9 ng/mL).
The third cluster was characterized by the highest mean serum concentration of adiponectin (mean=38.4 ng/mL, SD=9.3) (pattern hA, n=65). The fourth cluster included mostly women (90%) and had the highest mean leptin concentration (mean=52.2 ng/mL, SD=28.7) (pattern hL, n=52). Finally, the fifth cluster had a intermediate characteristics (I, n=287) compared to the other clusters.
Clusters were compared using descriptive statistics (means and SD or percentages, as appropriate) with regard to demographic characteristics, serum concentration of substances known to affect bone metabolism (parathyroid hormone [PTH], dehydroepiandrosterone sulfate [DHEAS], testosterone, estradiol, cortisol, insulin-like growth factor 1 [IGF-1], thyroid-stimulating hormone [TSH]), markers of bone metabolism (N-telopeptide), and bone quality indicators (see above). We also analyzed high-sensitivity C-reactive protein (CRP) as a marker of inflammation. This marker is mostly used for cardiovascular risk assessment, with highest risk for values >3 mg/L; concentrations >10 mg/L indicate acute inflammation.
Clusters were also compared with respect to lifestyle characteristics (level of physical activity between the fifth and seventh decade, time spent outside home, smoking), anthropometric variables (body mass index [BMI], waist circumference), and prevalence of frailty, defined as the presence of at least three of the following conditions: Low walking speed, low handgrip strength, low physical activity level, unintentional weight loss (5 kg in the past year), and self-reported exhaustion. 24 Low physical activity was defined as less than 1–2 hr/week of moderate or less than 4 hr/week of light physical exercise.
Statistical significance of the differences between clusters was evaluated using a generalized linear model with Tukey correction for multiple comparisons. To provide a comparison between the results obtained with a cluster analysis versus a conventional analysis, we also evaluated linear regression models having bone parameters as the outcome variable and vitamin D, adipokines, age, and gender as explanatory variables. The analyses were performed using R Statistical Software version 2.10.1 for Linux (R Foundation for Statistical Computing, Wien, Austria) and SAS version 9 for Windows (SAS Institute, Cary NC).
Results
The mean age of our sample was 75.2 years (SD=7.6), women were 397 (57.5%). The biochemical pattern of the five groups in terms of the clustering variables is shown in Table 1, whereas Fig. 1 shows the relative weight of each variable across the clusters. Table 2 compares the biochemical variables across groups. The hR-O cluster was characterized by higher serum concentration of high-sensitivity CRP (hsCRP), especially in comparision with the hD-Y and I clusters (p<0.05). In this cluster, we also found the lowest serum concentration of DHEAS (mean, 68.5 μg/mL, SD 65.1 μg/mL, p<0.05 vs. hD-Y cluster). People with the hD-Y pattern had the lowest concentration of PTH (p<0.01 vs. all other patterns) and the highest concentration of free testosterone (p<0.001 vs. all other clusters). Pattern hA was characterized by high levels of PTH (32.9 pg/mL, SD 19.3 pg/mL) and by low levels of β-estradiol (7.8 pg/mL, SD 4.41 pg/mL). Pattern hL showed lower serum concentration of IGF-1 (0.48 pg/mL, SD 0.33 pg/mL) and higher levels of β-estradiol (14.6 pg/mL, SD 39.96, p<0.05 vs. clusters hA and I). Only in clusters hD-Y and hL was the average serum concentration of vitamin D higher than 37.5 nmol/L (15 ng/mL), which is the level that prevents potentially dangerous rise of PTH. 25 Values under threshold were recorded in more than half of subjects in all the clusters except hD-Y, in which nobody had low vitamin D levels.

Cluster composition. Each section represents the relative weight of the corresponding variable within the cluster. hR-O, high resistin, older; hD-Y, high vitamin D, younger; hA, high adiponectin; hL, high leptin; I, intermediate.
SD, standard deviation.
p<0.01 for cluster hD-Y vs. all others.
p<0.001 for cluster hR-O vs. clusters hD-Y and I.
p<0.01 for cluster hR-O vs. cluster hD-Y.
p<0.001 for cluster hD-Y vs. all others, p<0.01 for cluster I vs. clusters hL and hA, p<0.05 for cluster hR-O vs. cluster hA.
p<0.05 for cluster hL vs. clusters hA and I.
SD, standard deviation.
Table 3 shows the differences in anthropometric, lifestyle, and clinical characteristics. The hR-O pattern had the highest prevalence of the frail phenotype (29.9%, p<0.01) and of people with low frequency of trips outside home (56.1%, p<0.01). The hD-Y group had the higher alcohol consumption (23.2 grams/day, p<0.05) and smoking exposure (17.2 pack-years, p<0.05 vs. groups hA, hL, and I), and the lowest prevalence of frail phenotype (0.7%, p<0.01). The group hL showed the highest prevalence of low physical activity level (80% of subjects, p<0.01).
p<0.05 for cluster I vs. clusters hR-O and hA, and for cluster hL vs. all others.
p<0.05 for cluster hR-O vs. cluster hD-Y and for clusters hL and hA vs. all others.
p<0.05 for cluster hD-Y vs. hA, hL, and I.
p<0.05 for cluster hR-O vs. cluster I and for cluster hD-Y vs. all others.
SD, standard deviation.
Data on bone parameters are shown in Table 4. The most favorable profile was associated with pattern hD-Y, which had the higher values of cortical BMD (p<0.001 vs. clusters hR-O, hA, and I), total bone area (p<0.001 vs. all other clusters), and cortical bone area (p<0.001 vs. all other groups) areas. The pattern hR-O, instead, was associated with lower cortical BMD (p<0.001 vs. patterns hD-Y, hL, and I), and increased medullary bone area (p<0.001 vs. cluster hD-Y, hL, and I). Similar results were obtained for pattern hA. To improve comparability across clusters and variables and to remove the confounding effect of age and sex, we repeated this analysis using age- and sex-standardized values of BMD and bone area (see Table 5 and Fig. 2). In this analysis, we found no statistically significant difference across groups.
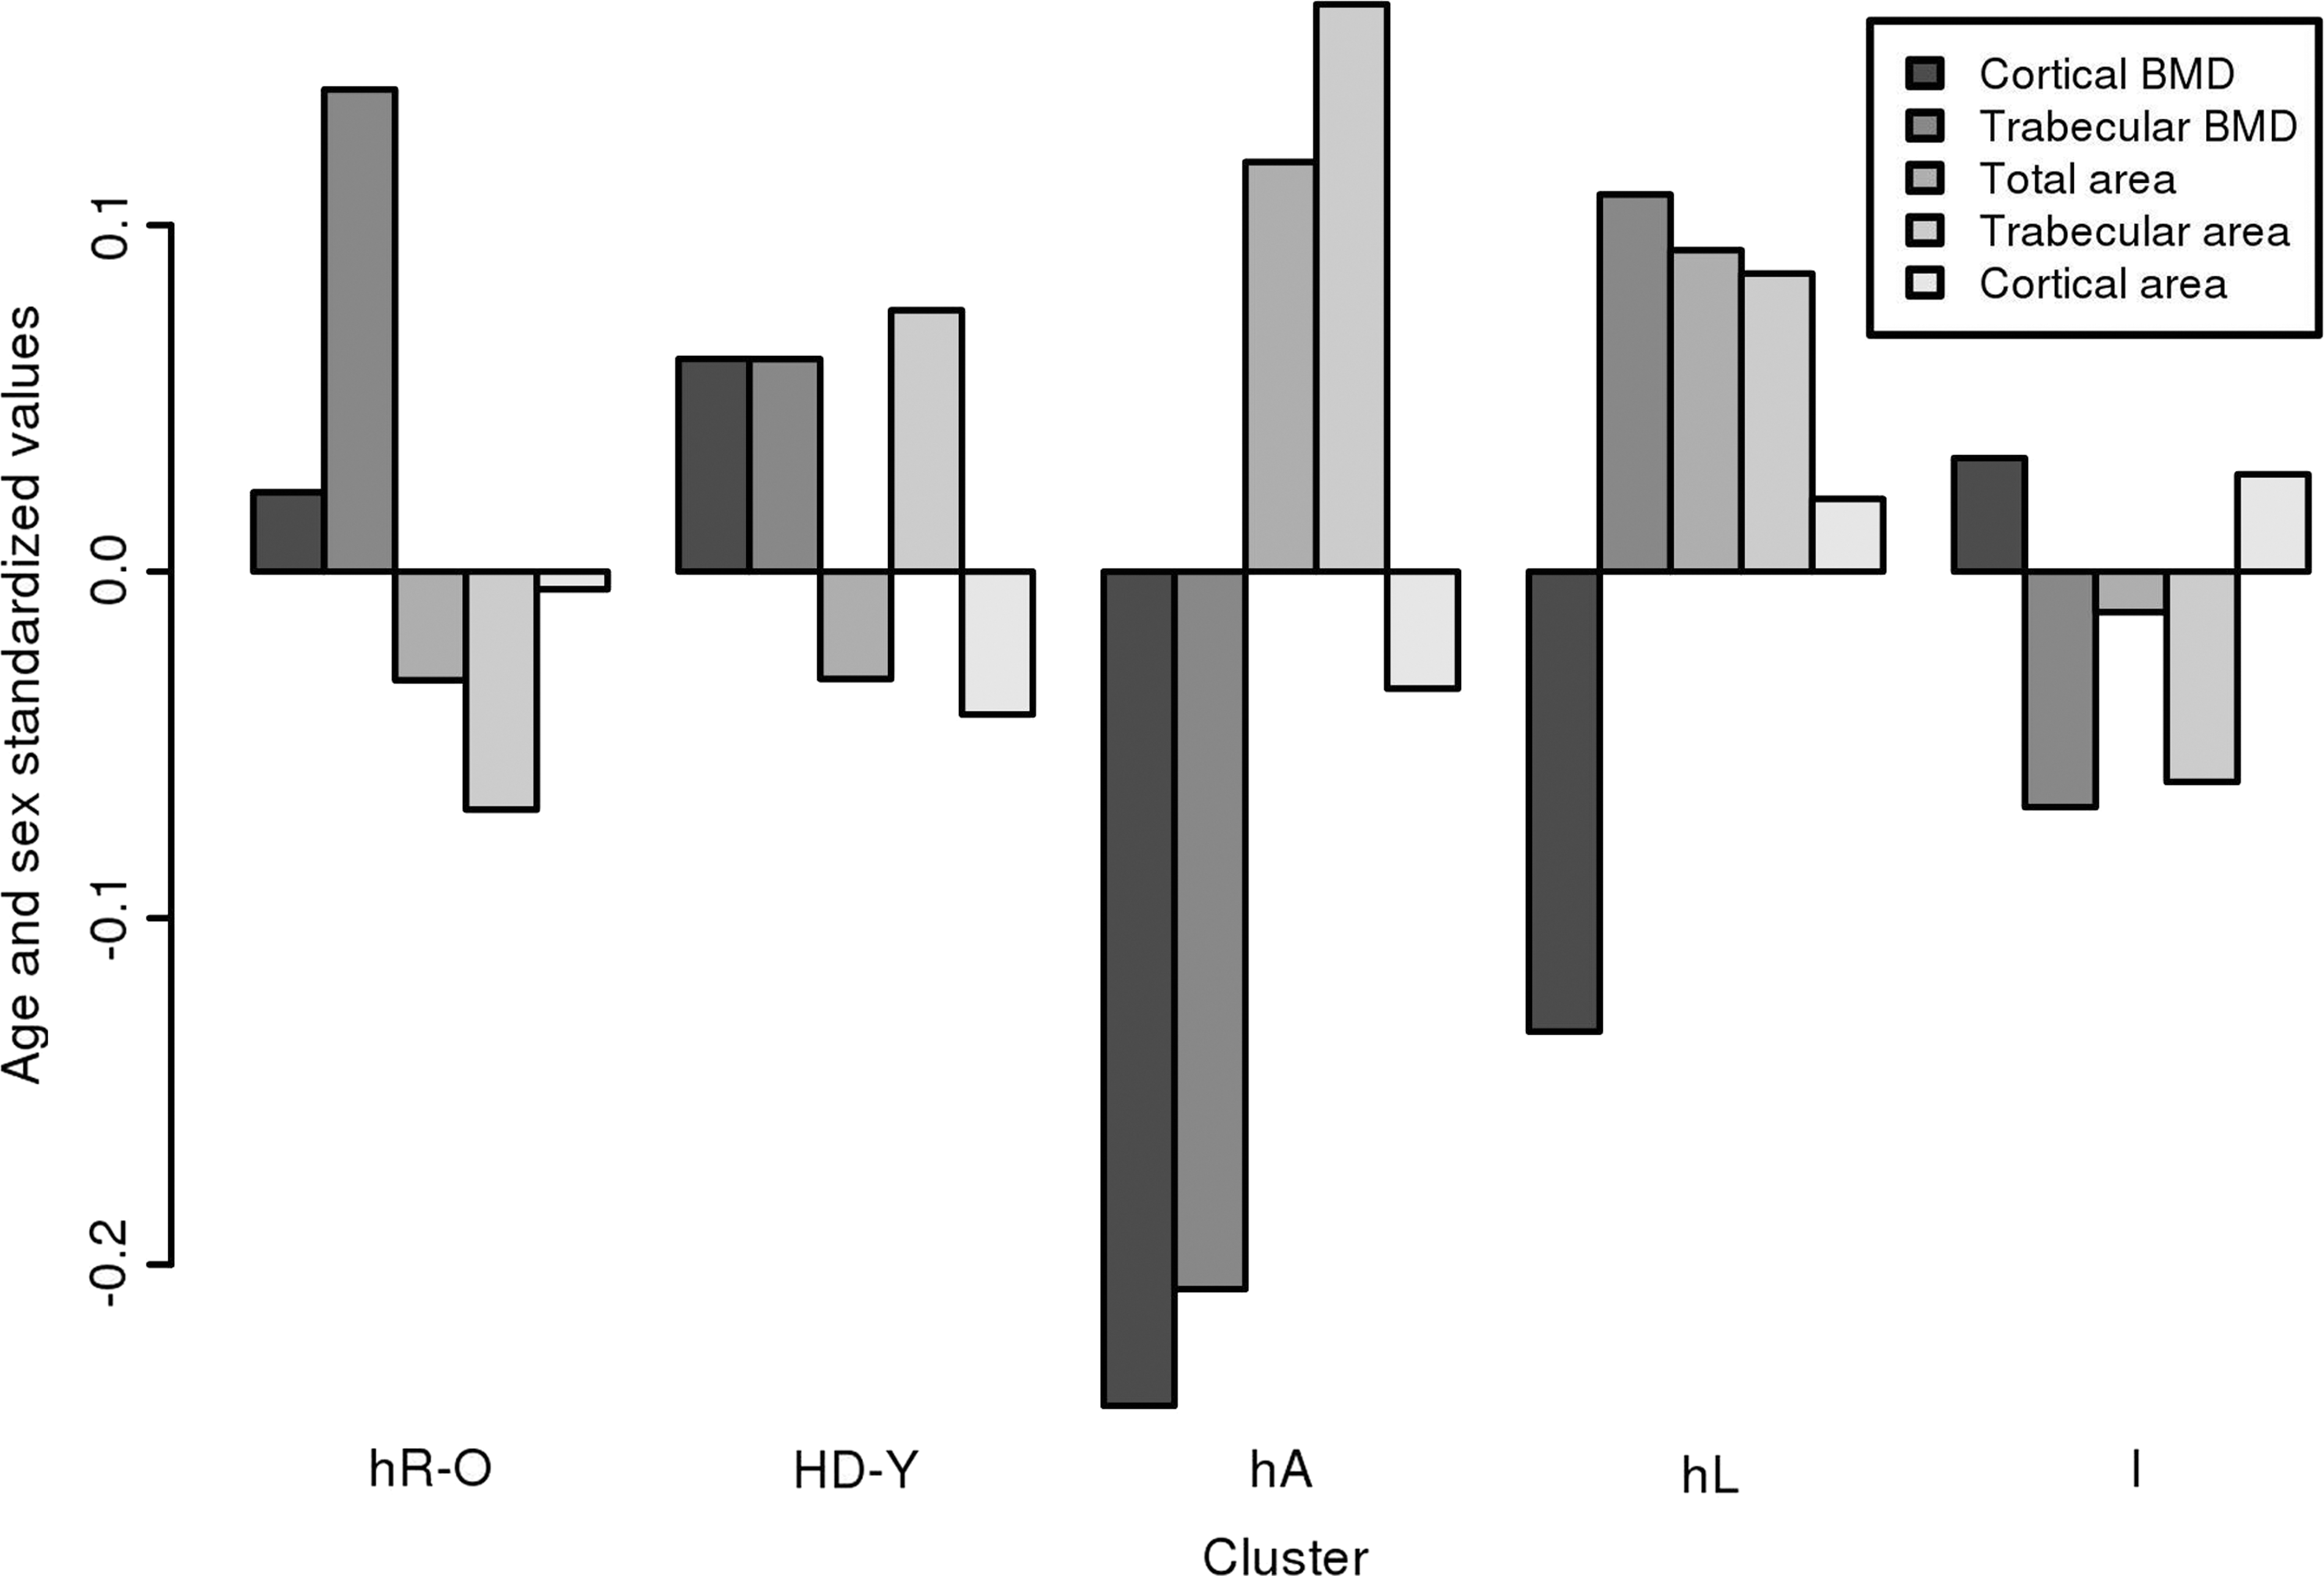
Standardized values of the bone parameters. BMD, bopne mineral density; hR-O, high resistin, older; hD-Y, high vitamin D, younger; hA, high adiponectin; hL, high leptin; I, intermediate.
p<0.001 for cluster hR-O vs. hD-Y, hL, and I; p<0.01 for cluster hD-Y vs. hA, and I; p<0.01 for cluster hA vs. cluster hL.
All p values>0.05.
p<0.001 for cluster hD-Y vs. all others; p<0.01 and for cluster hA vs. clusters hR-O and I.
p<0.001 for cluster hD-Y vs. all others and for cluster hA vs. cluster I.
p<0.001 for cluster hR-O vs. cluster hD-Y, hL and I; p<0.05 and for cluster hA vs. cluster hL.
p<0.001 for cluster hR-O vs. hD-Y, hL, and I and for cluster hD-Y vs. hA; p<0.01 for cluster hA vs. cluster hL and hI, and for cluster hD-Y vs. I.
SD, standard deviation; BMD, bone mineral density.
SD, standard deviation; BMD, bone mineral density.
Finally, when we analyzed the relationship between individual adipokines and bone parameters in linear regression models, we found that age and gender were associated with both BMD and bone area, but among the other variables only leptin was associated with total and cortical bone areas (Table 6).
p<0.05.
Discussion
In our sample, clusters generated on the basis of serum adipokines, vitamin D, age, and gender had different bone density and area, health status, and anabolic/catabolic balance. However, the differences observed between clusters with respect to bone parameters are largely explained by sex and age.
Two clusters (hR-O and hD-Y) had the most “extreme” characteristics with respect to demographic, biochemical, and bone parameters. Participants in the cluster hR-O had the highest mean age and were characterized by the highest level of resistin and the second highest level of adiponectin. This cluster had the lowest cortical BMD, the highest hsCRP levels, and the lowest DHEAS levels; the N-telopeptide concentration was much higher compared to the other clusters, indicating bone catabolism. The hD-Y cluster had the highest prevalence of men and the lowest mean age, the lowest adiponectin and the second lowest resistin concentrations, but the highest cortical BMD as well as the largest total bone areas. Interestingly, in the same InCHIANTI population, a traditional analysis of BMD correlates had disclosed an inverse relationship between serum adiponectin and BMD in females, but not in males. 13 Thus, the present alternative approach allowed identification of a cluster of people, mostly men, having high vitamin D serum concentration in which an inverse relationship between adiponectin and BMD was evident. Analogously, such a relationship has recently been shown in a subset of healthy men aged 60–80 years. 26 Data pertaining to the other clusters further confirm that both adiponectin and resistin are inversely related to BMD. 27 –34 For instance in the I cluster, which was characterized by the lowest resistin and the second lowest adiponectin serum levels, trabecular and cortical BMD values were relatively high.
The cluster with highest leptin levels had the highest BMI and waist circumference, but the clustering analysis could not disclose a well-defined relationship between this cluster and BMD or total bone area relationship, confirming the uncertain results of previous clinical studies. 27,31,35 Leptin, however, was the only adipokine correlated with total bone and cortical area independently of age, gender, and other adipokines concentration. It is of interest that the highest leptin level was in the cluster made up almost completely by women and having the highest BMI and waist circumference values, whereas the lowest leptin level was in the cluster hD-Y that included almost only men. Accordingly, leptin levels might generically reflect visceral fat mass or gender-related secretory potential, whichever is its effect on bone.
Collaterally, it is worth noting that the cluster hA had the lowest BMI and waist circumference. This confirms that fat mass is inversely related to adiponectin and directly to leptin. 36 In the cluster hL, we also found that an average concentration of vitamin D is in the normal range. This is in contrast with the reported decreased bioavailability of this vitamin in people with BMI>30 kg/m2. It should be noted, however, that this observation refers to changes in vitamin D concentration after an oral load or whole body ultraviolet (UV) irradiation, not to basal concentration of vitamin D. 4 The lowest and highest vitamin D levels characterized the biochemical patterns associated with the highest and lowest prevalence of frailty, respectively.
This finding is in line with another report based on the same population that described an age-independent link between vitamin D depletion and frailty. 37 Bone health closely mirrored overall health: Frailty characterized over one out of four subjects in the lowest BMD cluster, but less than 1% of those in the highest BMD cluster. Frailty is an important marker of the risk of impending or worsening disability, hospitalization, and mortality. 38,39 For instance, it has been shown that 56% of frail women compared to 20% of non-frail women develop a disability in activities of daily living over 3 years. 40 Thus, reduced BMD seems to be a proxy for general health status. This finding might be considered obvious: The bone is part of lean mass, and lean mass depletion is a well-recognized marker of poor prognosis. 41 Nevertheless, we built our clusters based on demographic parameters, vitamin D, and adipokines serum concentrations, but not bone parameters. Thus, groups with concordant bone characteristics and health status were identified without any a priori assumption. This suggests that frailty and bone health have, at least in part, common biological bases.
We believe that the major strength of this study is that using an assumption-free analytic approach we could confirm and in part expand the knowledge on the relationship between adipokines and bone health, providing new information on the complex interplay between adipokines in a unselected, community-living elderly population. Furthermore, we could analyze a broad array of carefully collected biological and clinical data. Finally, we analyzed both bone density and bone area, which recognize different determinants or correlates. 42 In this way, we could show that people in the cluster with the lower BMD (hR-O) had a different hormonal and anthropometric profile compared to people in the cluster with the lowest total bone area (hA)
This study has important limitations. Its cross-sectional design cannot establish causality, so it cannot be inferred from our results that clustering variables account for the cluster characteristics. They simply suggest that adipokines and vitamin D levels are ancillary to age and sex to define populations with different bone and health status profiles. Nevertheless, this is potentially important information. Indeed, these clusters might correspond to distinctive metabolic and hormonal patterns ultimately affecting bone health and, more broadly, health status. Furthermore, we could not verify whether an increased risk of fracture explains the relationship between BMD and frailty, or different pathways to disability characterize osteoporotic patients.
In conclusion, we found that clusters of elderly people identified on the basis of age, sex, adipokines, and vitamin D serum levels have distinctive bone, health status, hormonal, and anthropometric profiles. Our findings confirm the complex relationship between bone health and adipokines, and suggest that a more relational and comprehensive approach is needed to improve our understanding of the determinants of bone health. However, the role of non-modifiable risk factors such as age and sex largely outweighs that of modifiable factors.
Footnotes
Author Disclosure statements
No competing financial interests exist.
Author contributions were as follows: Claudio Pedone, manuscript writing, data collection and analysis; Nicola Napoli, data interpretation; Paolo Pozzilli, data interpretation; Fulvio Lauretani, design and conduct study, data collection, and analysis; Stefania Bandinelli, design and conduct study, data collection, and analysis; Luigi Ferrucci, design and conduct study; Francesca Flavia Rossi, manuscript writing; Raffaele Antonelli Incalzi, manuscript writing, data collection, and analysis.