




Abstract
Networks are well suited to display and analyze complex systems that consist of numerous and interlinked elements. This study aimed at: (1) generating a series of drug prescription networks (DPNs) displaying co-prescription in community-dwelling elderly people; (2) analyzing DPN structure and organization; and (3) comparing various DPNs to unveil possible differences in drug co-prescription patterns across time and space. Data were extracted from the administrative prescription database of the Lombardy Region in northern Italy in 2000 and 2010. DPNs were generated, in which each node represents a drug chemical subclass, whereas each edge linking two nodes represents the co-prescription of the corresponding drugs to the same patient. At a global level, the DPN was a very dense and highly clustered network, whereas at the local level it was organized into anatomically homogeneous modules. In addition, the DPN was assortative by class, because similar nodes (representing drugs with the same anatomic, therapeutic, and pharmacologic annotation) connected to each other more frequently than expected, indicating that similar drugs are often co-prescribed. Finally, temporal changes in the co-prescription of specific drug sub-groups (for instance, proton pump inhibitors) translated into topological changes of the DPN and its modules. In conclusion, complementing more traditional pharmaco-epidemiology methods, the DPN-based method allows appreciatiation (and representation) of general trends in the co-prescription of a specific drug (e.g., its emergence as a heavily co-prescribed hub) in comparison with other drugs.
Introduction
N
Among other disciplines, network analysis has been applied to medicine 5,6 and pharmacology. 7,8 Furthermore, a recent study has introduced the notion of the Drug Prescription Network (DPN), in which each edge connects a pair of nodes any time the corresponding drugs are co-prescribed to the same patient. 9 No previous study, however, has reported detailed topological analysis of the DPN or has evaluated how temporal changes in the patterns of drug co-prescriptions affect network organization.
Community-dwelling elderly people are very commonly exposed to poly-pharmacy. A recent report from the Italian Medicines Agency showed that more than 6 million of elderly are prescribed five to nine drugs and more than one million 10 (or more) drugs. 10 It is well-known that poly-pathology leads to co-prescription of several drugs, often by different physicians, according to specific disease-oriented guidelines, without considering the risk of drug interactions, adverse drug reactions, and poor compliance. The existence of patterns of poly-pharmacy showing the non-random associations in drug prescriptions has also been demonstrated. 11 The present work was performed to evaluate whether the DPN is a good approach for studying the complexity of drug prescription in older persons. Specifically, we aimed at generating, analyzing, and comparing a series of DPNs to elucidate the structure of the DPNs and the possible differences due to changes in drug co-prescription across time and space.
Methods
Generation of the DPN
This study evaluated co-prescription of drugs dispensed by the Italian National Health Service (NHS) during two index years (2000 and 2010) in community-dwelling elderly people (aged 65–94) living in specific Local Health Units (LHUs) of the Lombardy Region. The source of data was the Lombardy administrative database, which has been described in detail elsewhere. 12 All of the data were managed and analyzed using an anonymous subject code.
Specifically, after excluding drugs prescribed to less than 10 patients per year, lists were generated of pairs of co-prescribed drugs, based on records from the Drug Administrative Database of the NHS. Drugs belonging to the same chemical subgroup, as defined by the fourth level of the Anatomical, Therapeutic, and Chemical (ATC) Classification, 13 constituted a node, which was named accordingly. Hereafter, drug subclasses are referred to as “drugs” for brevity's sake. Cytoscape 14 version 2.8.2 and Network Analyzer 15 were used to display and analyze the DPN.
Definition of the DPN
In this study, we examined the following DPNs: 1. The MiY00 (Milano/Year/2000) DPN refers to the Milano 309 LHU in 2000. Comparing MiY00 with the other DPNs allows examining possible variations in drug co-prescription across time and space. 2. The RandY00 (Random/Year/2000) DPN refers to a randomly chosen fraction (10%) of patients from all the LHUs in Lombardy (Milano 309 included) in 2000. Comparing RandY00 with MiY00 evaluates the possibility of extrapolating results obtained in a restricted area (e.g., Milano 309) to a wider territory (e.g., Lombardy). 3. The MiY10 (Milano/Year/2010) DPN refers to Milano 309 in 2010. Comparing MiY10 with MiY00 evaluates variations across time in the same area.
Initial analysis indicated that the DPNs are very dense networks populated by numerous edges, most of which represent weak co-prescriptions. Thus, to focus on strong co-prescriptions only, we increased progressively the threshold φ* for the correlation value φ (Fig. S1; Supplementary Data are available at
Topological modules, quantification of modularity, and definition of topological roles
clusterMaker 17 version 1.9 was used to subdivide the DPN into topological modules according to the Markov cluster algorithm, and Random Networks was used to generate randomized versions of the DPN. Modularity was quantified by calculating the Q coefficient. 18 The topological role of each node i was defined by two parameters 19 —the within-module degree (zi ) and the participation coefficient (Pi ). The Q coefficient and the two topological parameters are defined in the Supplementary Materials and Methods.
Assortativity analysis
For a given DPN with N nodes and E edges (at a φ* of 0.07; Giant Connected Component and islands included), all the possible N 2 node pairs were enlisted. To quantify the assortativity by ATC level, we determined the fraction of nodes that share the same ATC code up to the first (anatomical), second (therapeutic), and third (pharmacologic) level, as described in the Supplementary Materials and Methods.
Distribution of node characteristics
We characterized each node by its anatomical designation (i.e., its first level of the ATC classification) of its drug members. Then, the correlation between this characteristic and the structure of the DPN was quantified by calculating, for each anatomical designation, its dyadicity D and its heterophilicity H. Both parameters are defined in the Results, and their calculation is detailed in the Supplementary Materials and Methods. 20
Results
General characteristic of the samples
The total number of elderly individuals in Lombardy in 2000 was 1,710,745 and in 2010 2,100,799. The main characteristics of the samples from different LHUs are shown in Table 1. Subjects living in institutions or who were dead or emigrated during the year were excluded from the analysis.
MiY00, Milan 309 LHU, co-prescription along all year, year 2000; MiY10, Milan 309 LHU, co-prescription along all year, year 2010; RandY00, 10% randomly chosen patients of the whole Lombardy region, co-prescription along all year, year 2000; SD, standard deviation; IQR, inter-quartile range.
Network analysis of the DPN
We performed network analysis on the three DPNs described in the Methods section. The first parameter we assessed was the connectivity ki , i.e., the number of neighbors of each node i, which indicates how many other nodes node i is linked to and thus how many drugs have been co-prescribed to the patients receiving drug i. We found that, within each DPN, the connectivity was distributed in a similar way (not shown), indicating that the three DPNs have a similar global structure.
When we ranked all of the i nodes in each DPN according to the ki percentile, some of the most connected nodes (i.e., the drugs in the top 10th percentile) were common to the three DPNs, such as sulfonamide diuretics (C03CA), organic nitrates (C01DA), and systemic glucocorticoids (H02AB). Others, such as digitalis glycosides (C01AA) and xanthines (R03DA), were in the top 10th percentile in 2000 (i.e., in the MiY00 and RandY00 DPN) but no longer in 2010 (i.e., in the MiY10). Conversely, others, such as proton pump inhibitors (PPIs) (A02BC), platelet aggregation inhibitors (B01AC), and 3-hydroxy-3-methyl-glutaryl-coenzyme A (HMG CoA) reductase inhibitors (C10AA), reached the top 10th percentile in 2010.
Besides connectivity, two additional parameters were comparable among the three DPNs. The former is the average clustering coefficient <C>, which averages (for each node in the network) the ratio of edges between the node neighbors divided by the number of edges that could exist between them. We found that <C> ranged from 0.4 to 0.5 in the three DPNs. Thus, on average, about half of the drugs that are co-prescribed with a given drug tend to be co-prescribed with each other as well. The latter is the average shortest path <l>, which averages the number of edges that one must travel to connect any pair of nodes. We found that <l> ranged from 1.9 to 2.3 in the three DPNs. An <l> value of about 2 indicates that, even for those pairs of drugs that are not prescribed together (and, thus, are not linked directly in the DPN), there is, on average, at least a third drug co-prescribed with both members of the un-connected pair. Together, the high <C> and the short <l> reinforce the idea that the DPNs are very dense networks, in keeping with the notion that co-prescription is a very common practice in medicine.
The DPNs are modular
As expected, increasing the threshold φ* reduced the density of the DPN by eliminating the weaker edges. However, even after such reduction, the DPN retained local areas of high interaction density. Like many other real-world networks, these areas also appeared as modules in the DPN, i.e., communities of densely inter-connected nodes that link preferentially to each other than to the other nodes in the network. Besides appreciating DPN organization in detail, analyzing the subdivision of the DPN into modules allowed us to identify which drugs are co-prescribed more often with each other than with the other drugs. For the analysis of modularity, we focused on the MiY00 DPN. As control, we generated a randomized version of MiY00 (not to be confused with RandY00), i.e., a network with the same number N of nodes, the same number E of edges, and the same ki for each ith node, but with the edges randomly shuffled among the nodes. Finally, to make comparisons across time, we also examined in parallel the MiY00 against the MiY10 DPNs. For all DPNs, the φ* of 0.07 was found to be a suitable threshold, because a smaller φ* resulted in dense networks that could not be easily parsed into modules. Figure S3 shows the subdivision into modules of the Giant Connected Components in the MiY00 (Fig. S3A), randomized MiY00 (Fig. S3B), and MiY10 DPNs (Fig. S3C).
In the three DPNs, the algorithm generated a similar number of modules (18 modules in the MiY00 and MiY10 DPNs, 16 modules in the randomized MiY00 DPN) and caused minimal fragmentation of the most peripheral areas of the networks. Notably, however, the randomized MiY00 DPN was much less modular than the MiY00 DPN, as demonstrated by a lower modularity coefficient Q (0.270 and 0.506 for randomized MiY00 and MiY00 DPNs, respectively) and a higher ratio of inter- to intra-module edges (109/95 and 55/149, respectively). The modularity of MiY10 was instead comparable with MiY00 (Q coefficient of 0.560 and ratio of 70/242).
To facilitate the appreciation of modularity by visual inspection, we report in Fig. 1A a simplified version of the 18 modules in the MiY00 DPN, where nine tiny peripheral modules were either joined to nine larger modules or merged into a novel module, thus leading to a total of 10 clusters (see Fig. 1 legend for details). In addition, to provide an even more simplified view, we merged all of the nodes in each of the 10 clusters from Fig. 1A into 10 corresponding meta-nodes (Fig. 1B), which represent areas of pharmacological relevance (labeled with letters A to J).
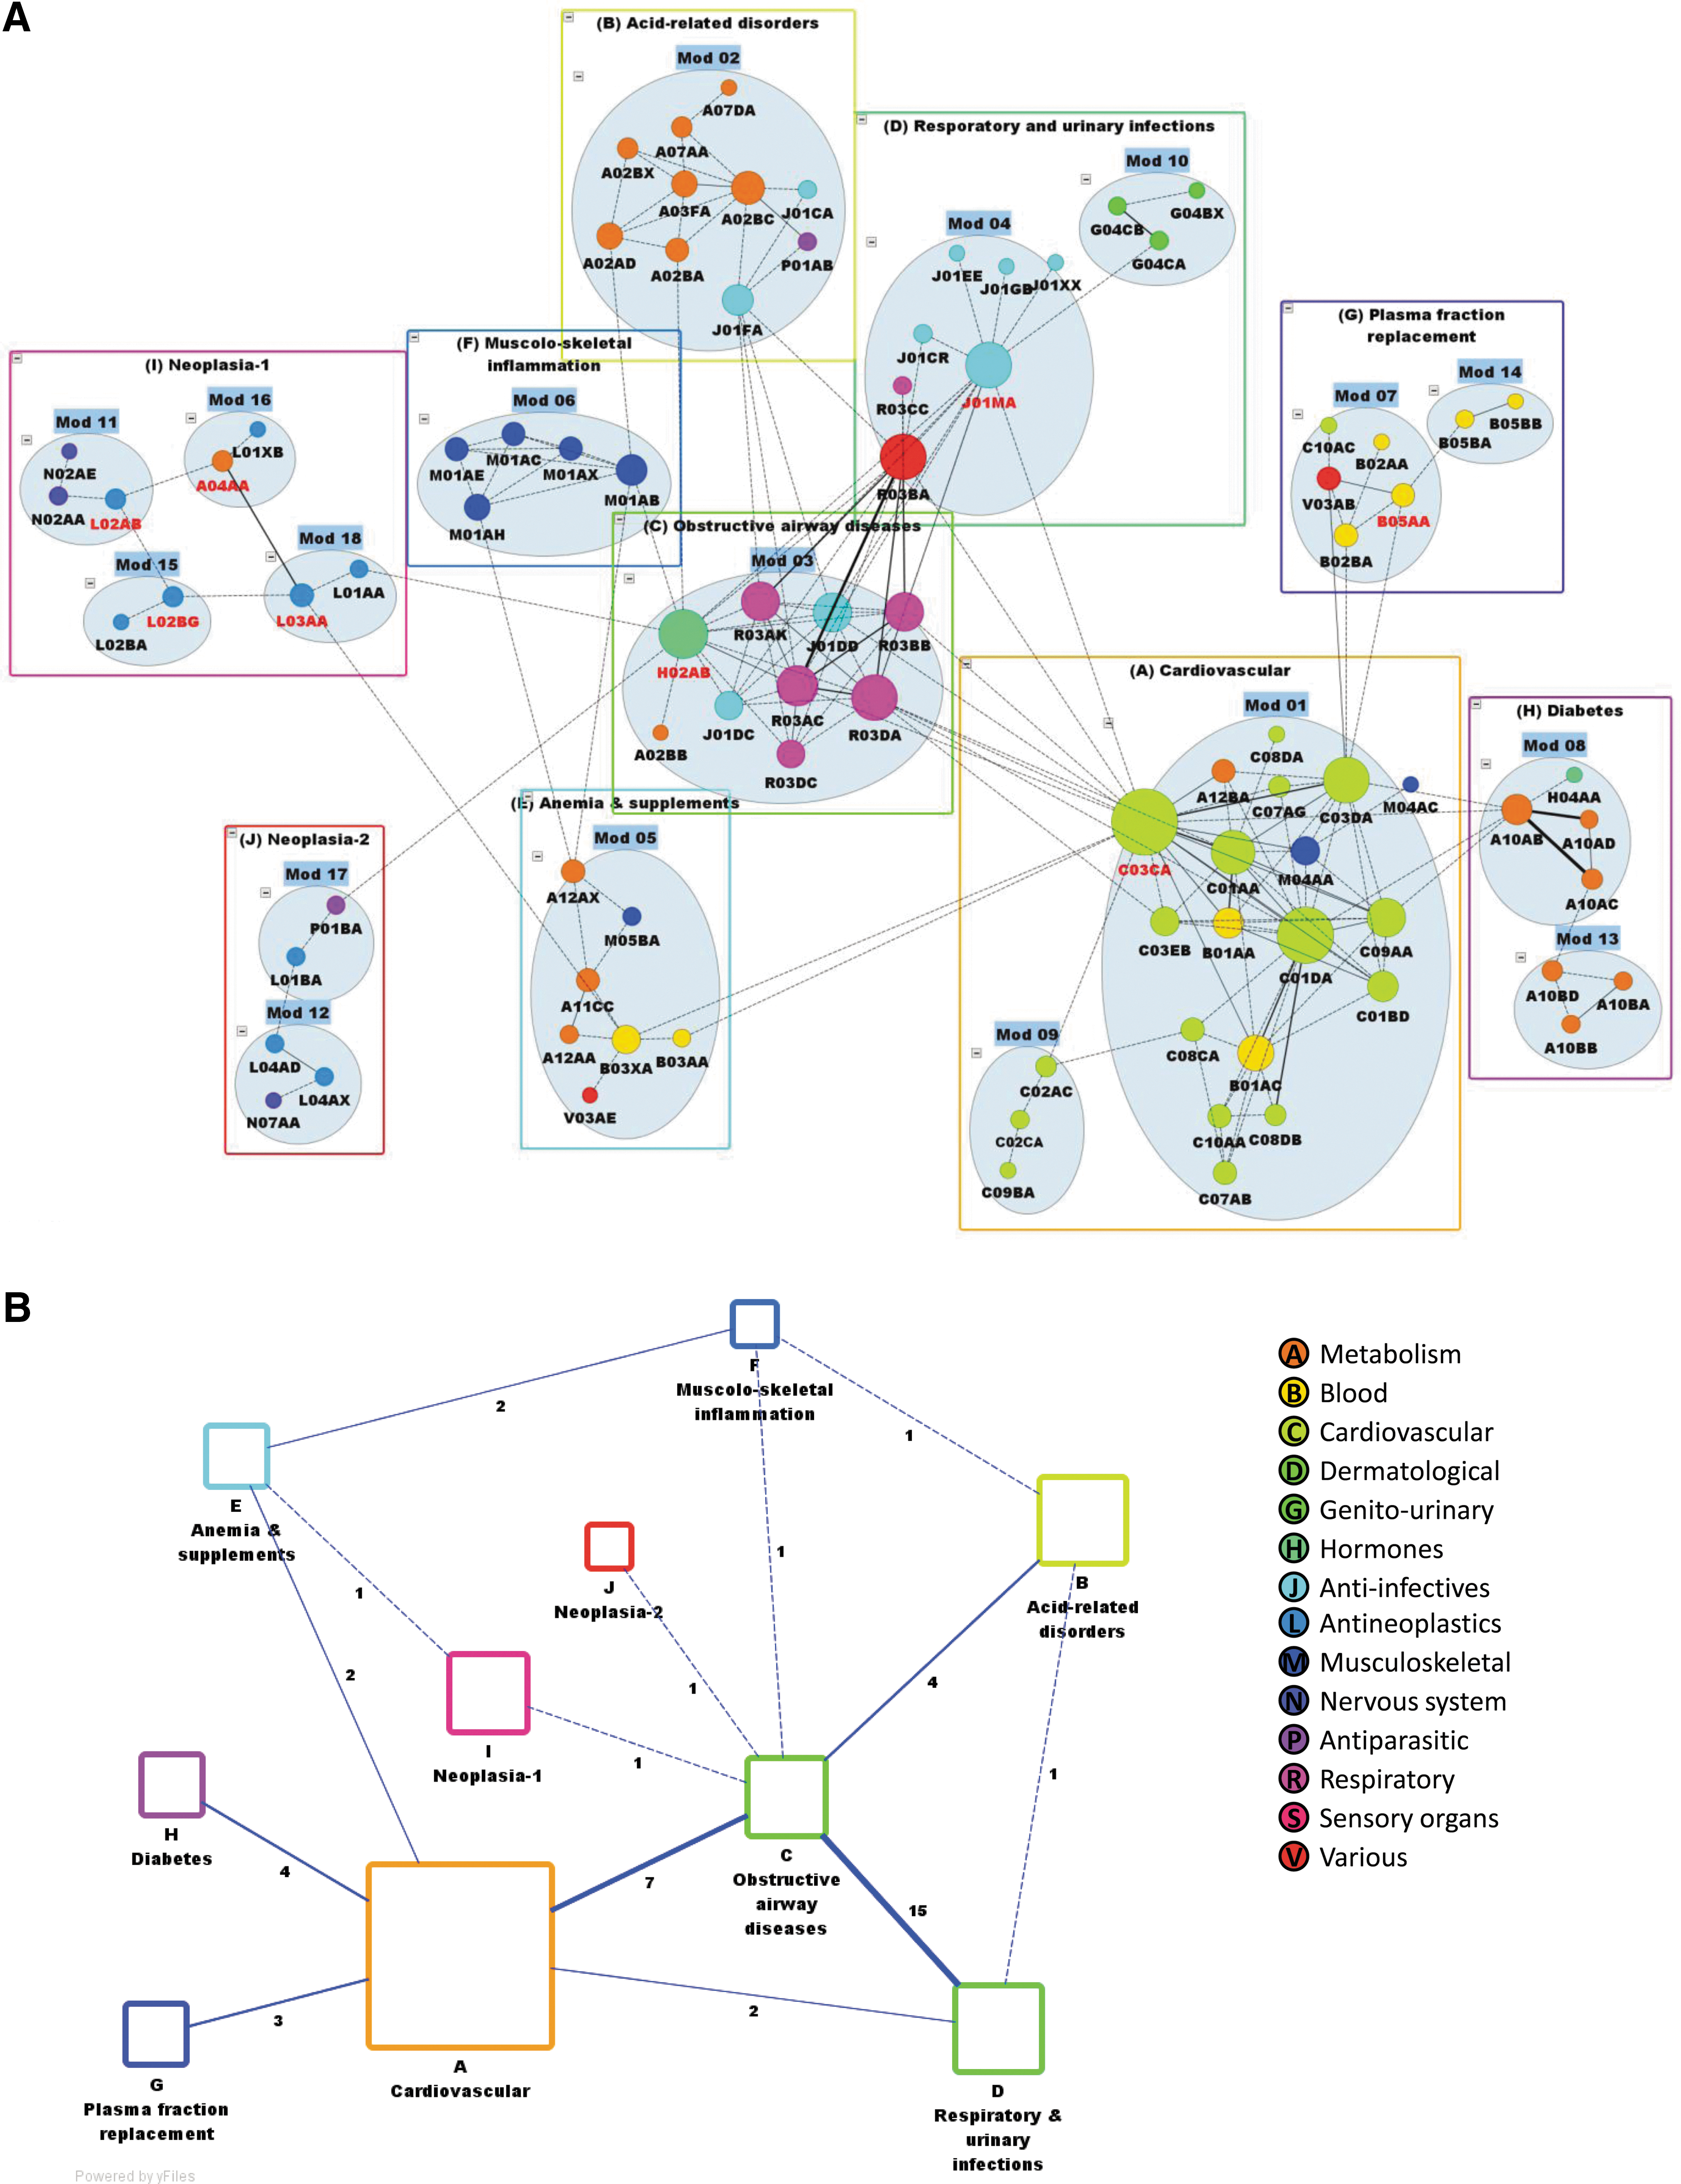
Modules in the MiY00 DPN. In
Topological role of the individual nodes with respect to the modules
Within modular networks, some nodes play an important topological role, either as intra-module hubs or as inter-module connectors, as defined by two parameters. The former, the within-module degree zi , defines how well connected a given node i is to the other nodes in its module and identifies intra-module hubs. Although there were no clear hubs (i.e., nodes with zi ≥2.5) in the MiY00 DPN, the nodes with the highest zi were PPIs (A02BC), organic nitrates (C01DA), and fluoroquinolone antibacterial (J01MA), which were well connected within module 2 (acid-related disorders), module 1 (cardiovascular), and module 4 (respiratory and urinary infections), respectively.
The latter parameter, the participation coefficient P i , defines to which degree node i is connected to all the modules in the network, thereby identifying inter-module connectors. In the MiY00 DPN, there were eight connectors (i.e., nodes with 0.30 <Pi ≤0.75), including sulfonamide diuretics (C03CA), systemic glucocorticoids (H02AB), and fluoroquinolone antibacterial (J01MA). Systemic corticoids exemplify the correspondence between the pharmacologic use in well-established co-prescriptions and the topological ability of connecting their own module (obstructive airway diseases) with other modules (including musculoskeletal inflammation, acid-related disorders, and neoplasia). Notable changes in the topological role occurred across time and emerged from the MiY00 versus MiY10 DPN comparison (Table S1 and Fig. S3), as discussed below.
The DPN is assortative
We next asked whether the DPNs are assortative, i.e., networks in which the nodes that preferentially connect to each other share a similar property (i.e., the same ATC annotation). To quantify the assortativity by ATC level, we determined the fraction of nodes that share the same ATC code up to the first (anatomical), second (therapeutic), and third (pharmacologic) level.
In the MiY00 DPN, the fraction of node pairs with the same code (at each of the three ATC levels) was much higher among the connected pairs compared with the non-connected pairs (Fig. 2A, panel a). In other words, sharing the same ATC code (up to the third level) is more common among the drugs that are significantly co-prescribed than among the drugs that are neither co-prescribed significantly nor co-prescribed altogether. Importantly, we did not observe the ATC-based assortativity in the randomized version of the MiY00 DPN (Fig. 2A, panel b).
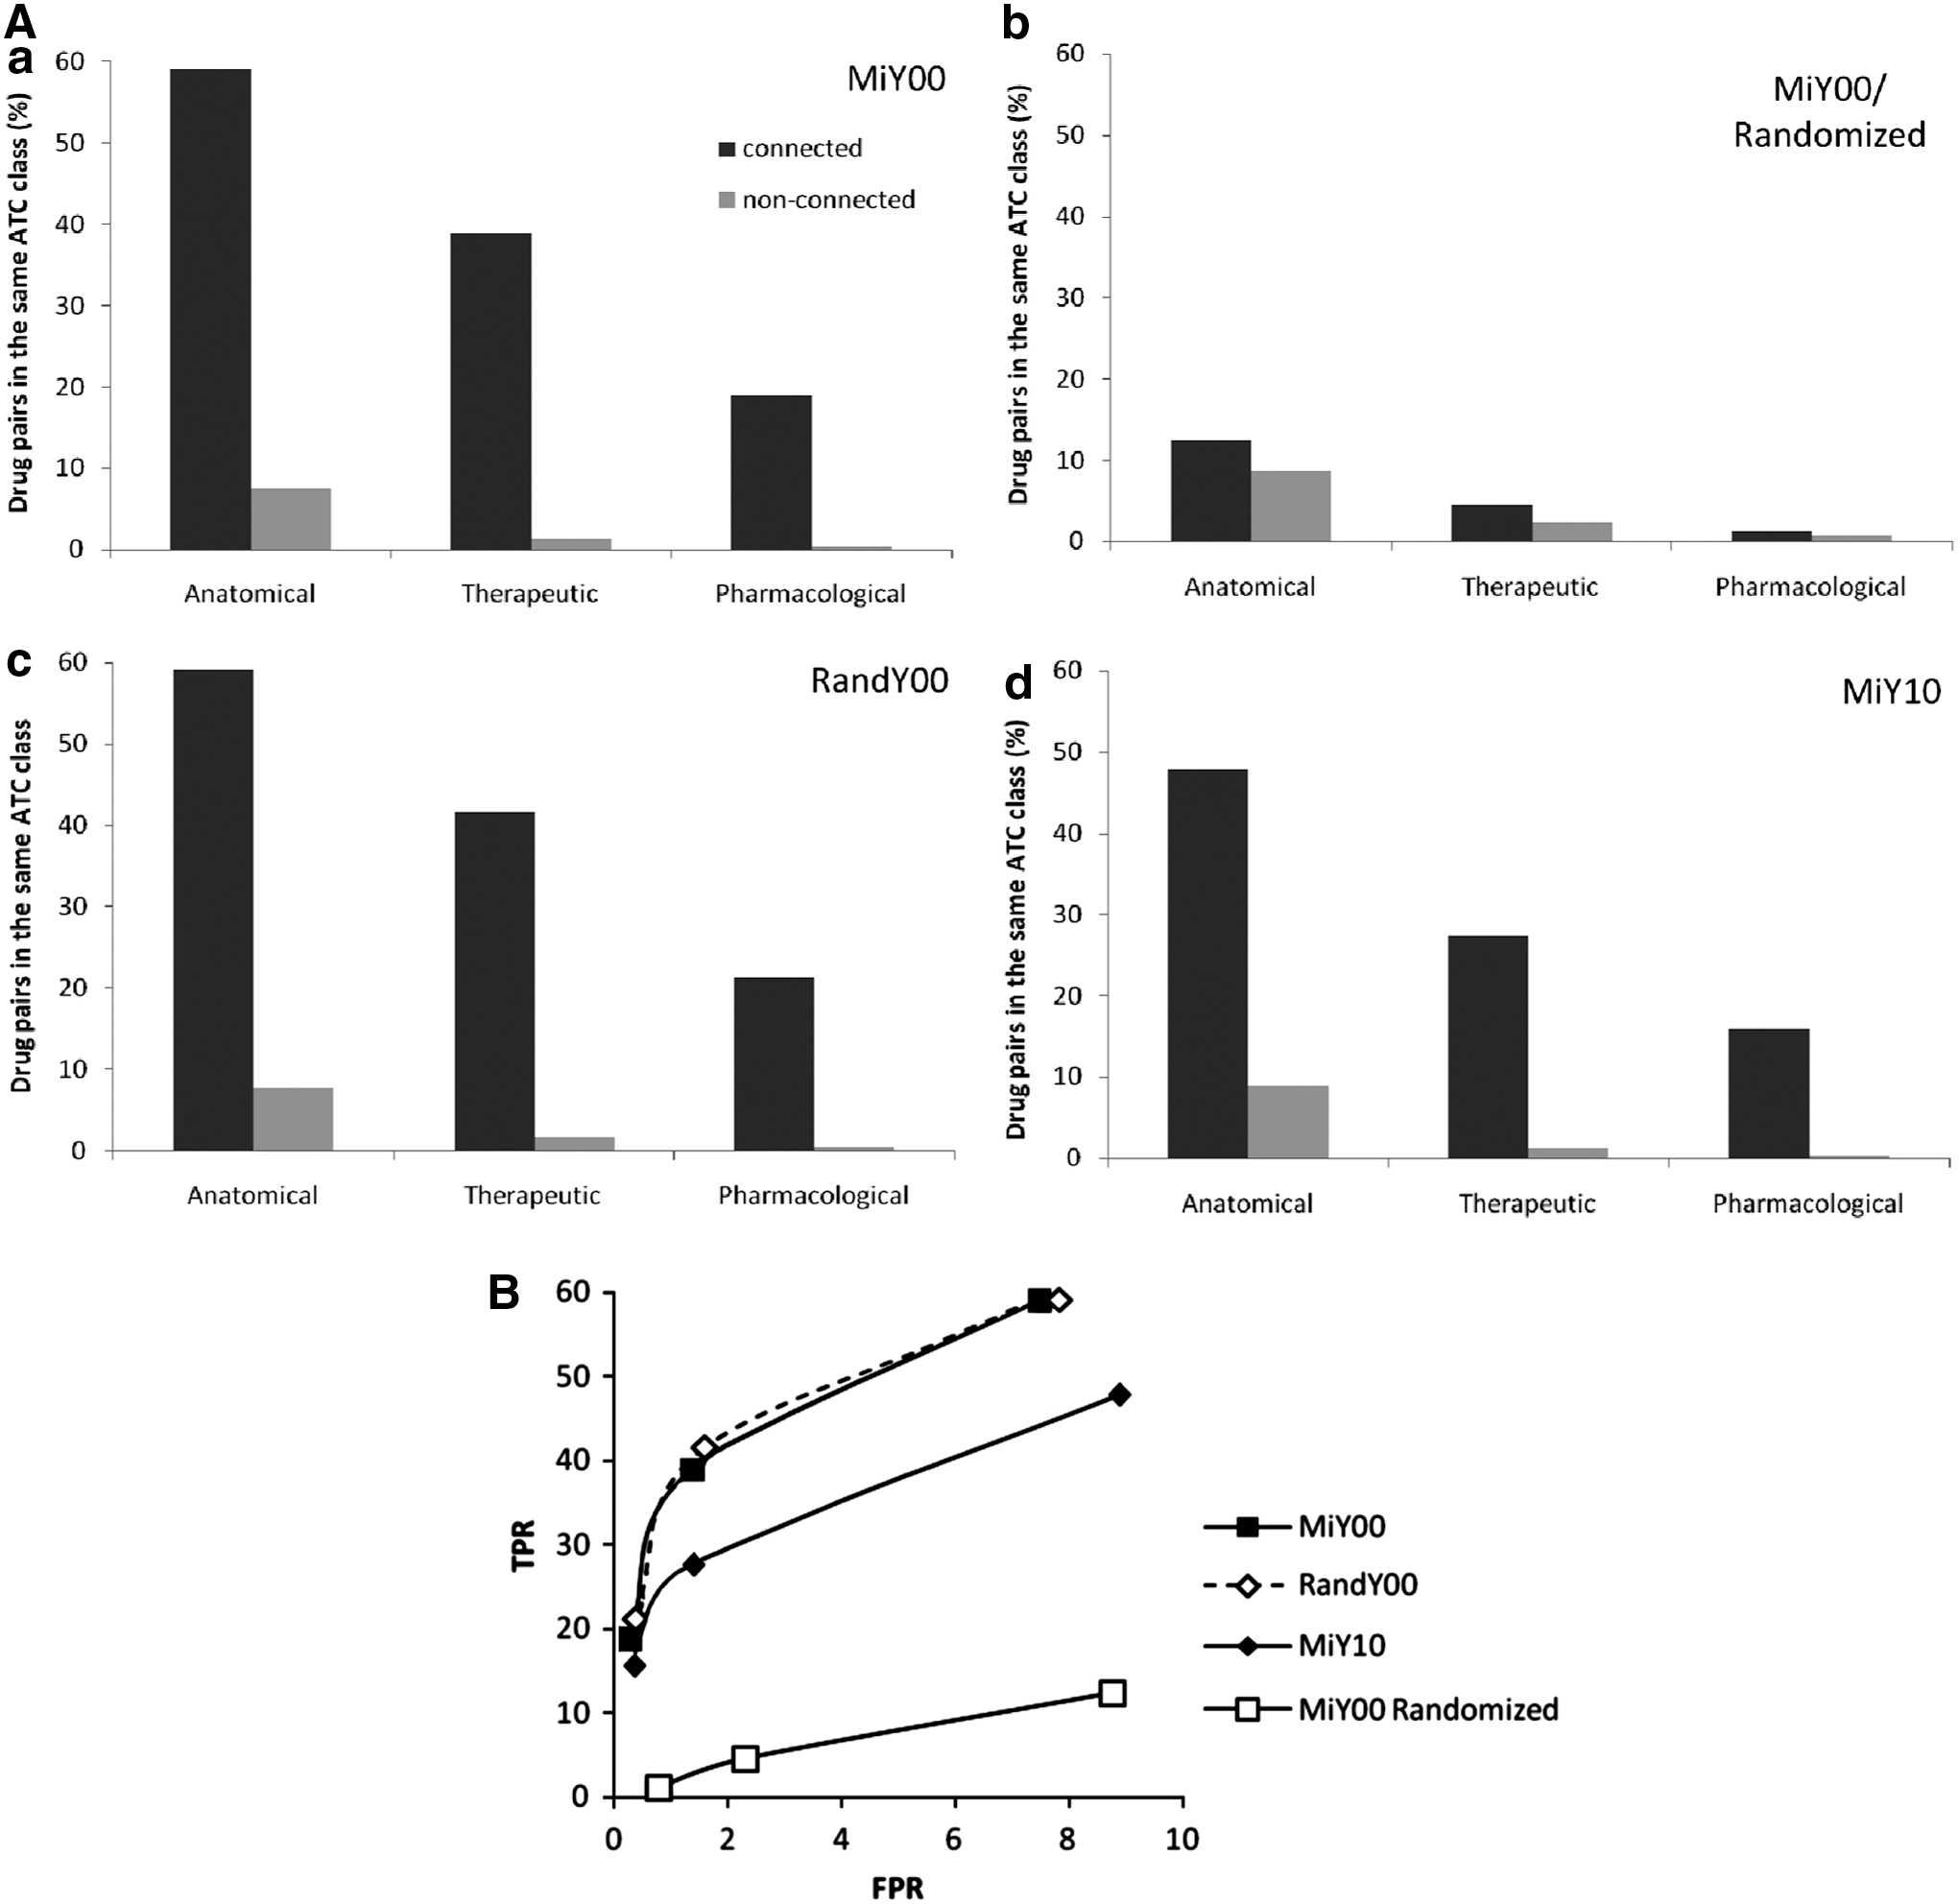
Assortativity by ATC class. (
Furthermore, we found that the ATC-based assortativity of RandY00 (Fig. 2A, panel c) was comparable to the assortativity of MiY00. Thus, on the basis of the MiY00 versus RandY00 comparison (Fig. 2B), we propose that a DPN obtained in a circumscribed territory (e.g., MiY00) can be used reliably to predict which drugs (at different ATC levels) are more likely to be co-prescribed with other similar drugs in a wider territory. Finally, the assortativity observed in 2000 was still present 10 years later, in the MiY10 (Fig. 2A, d), even though, assortativity was reduced in 2010 compared with 2000 at all the three ATC levels (see Fig. 2B). Thus, these observations suggest that predictions can be made more reliably across space (e.g., MiY00 vs. RandY00) than across time (e.g., MiY00 vs. MiY10).
Different anatomical classes contribute differently to DPN assortativity
Then, we evaluated whether different anatomical classes contribute differently to assortativity. To this purpose, we first counted the observed homogeneous dyads (i.e., the pairs of connected nodes, in which both nodes belong to the same anatomical class). Then, we determined the expected homogeneous dyads (i.e., those that one should expect, if the property were distributed randomly). For each of the 14 ATC classes, the observed-to-expected ratios of homogeneous and heterogeneous dyads define the D (dyadicity) and the H (heterophilicity), respectively. If D>1, the property is dyadic, and thus similar nodes connect among themselves more frequently than expected. Furthermore, if H>1, the property is heterophilic, and thus dissimilar nodes connect among themselves more frequently than expected.
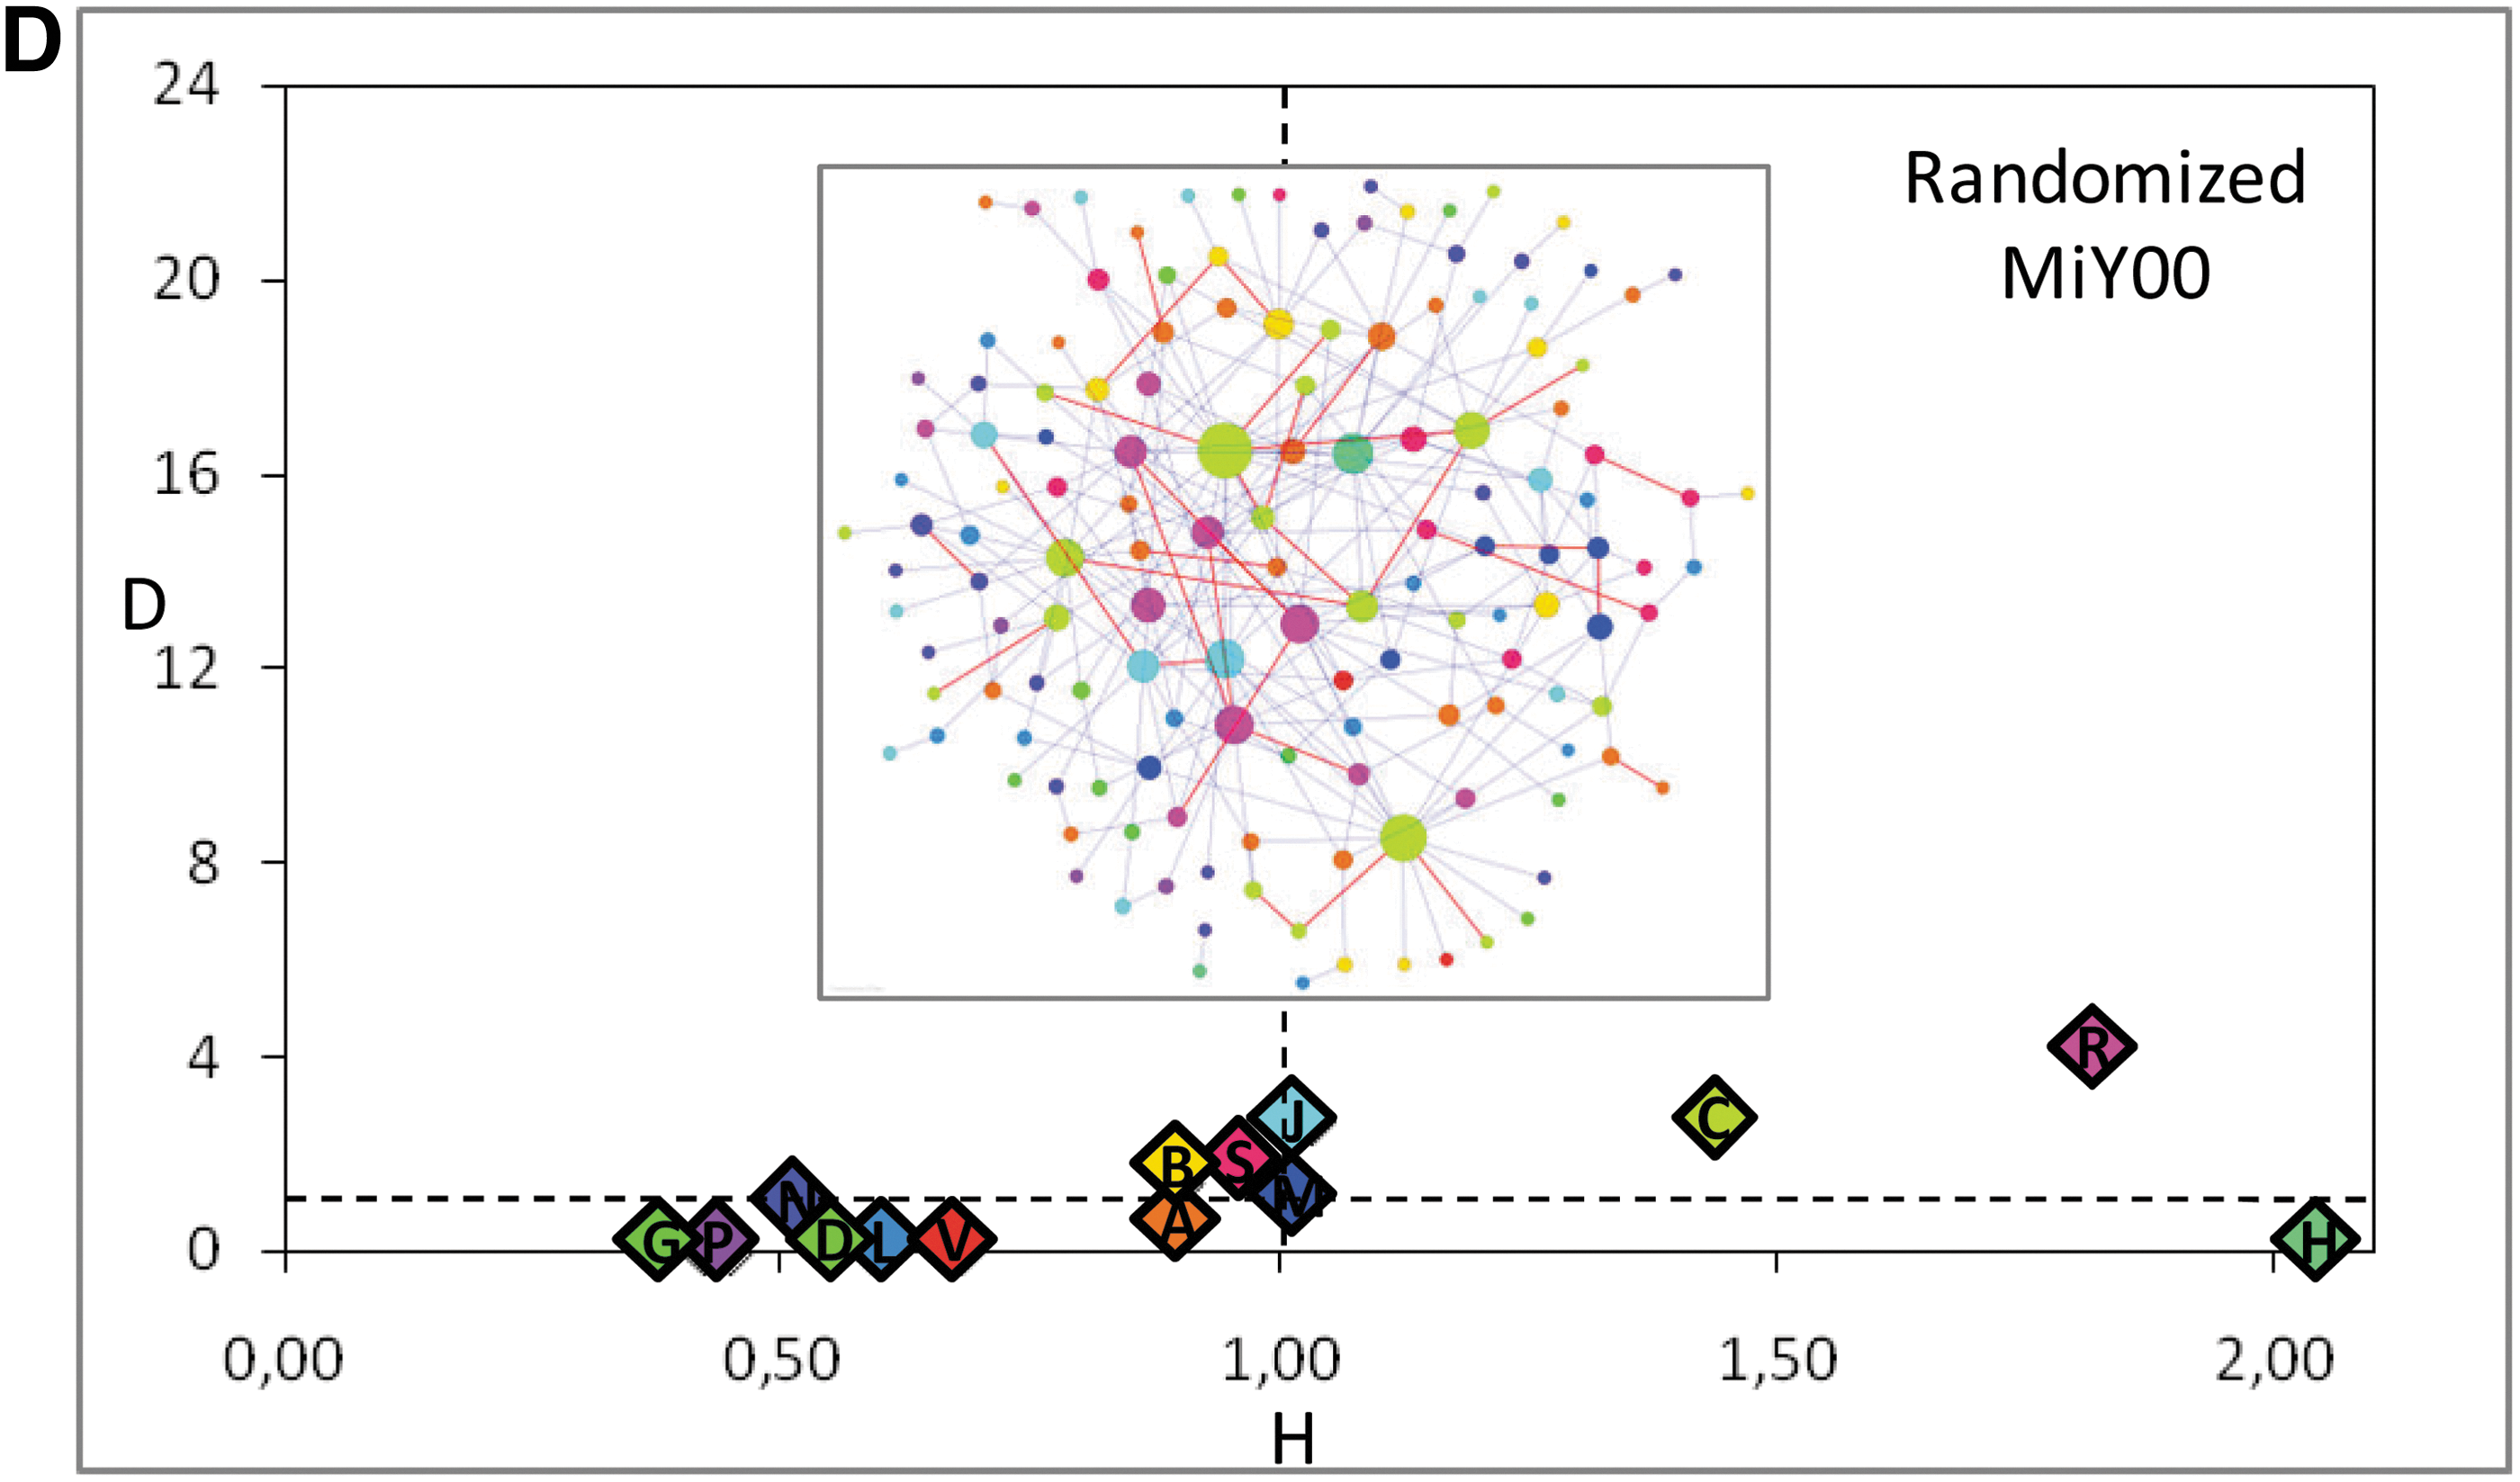
In the MiY00 DPN (Fig. 3A), almost all the anatomical classes are dyadic (D>1) and non-heterophilic (or heterophobic; H<1). Differences in H, however, allow distinguishing at least three different conditions of decreasing heterophobicity. First, the dermatological (D), sensory organs (S), and nervous system (N) classes are highly heterophobic (H < <1), because the corresponding nodes are segregated to either unconnected islands (D and S) or poorly connected peripheries (N) of the DPN. Second, the musculoskeletal (M) class is less heterophobic, because its nodes establish a few more connections with the rest of the DPN, even though they still cluster into a highly assortative module. Third, the cardiovascular (C) and respiratory (R) classes are just slightly heterophobic, because their nodes, while forming homogenous dyads, belong to central clusters that are highly connected with the other clusters in the DPN. Results of dyad analysis in MiY10 (Fig. 3B) and comparison with MiY00 (Fig. 3C) are discussed below. Finally, as control, it is worth noting that, in contrast to MiY00, the randomized version of the MiY00 DPN shows no major differences in dyadicity among the anatomical classes (Fig. 3D).
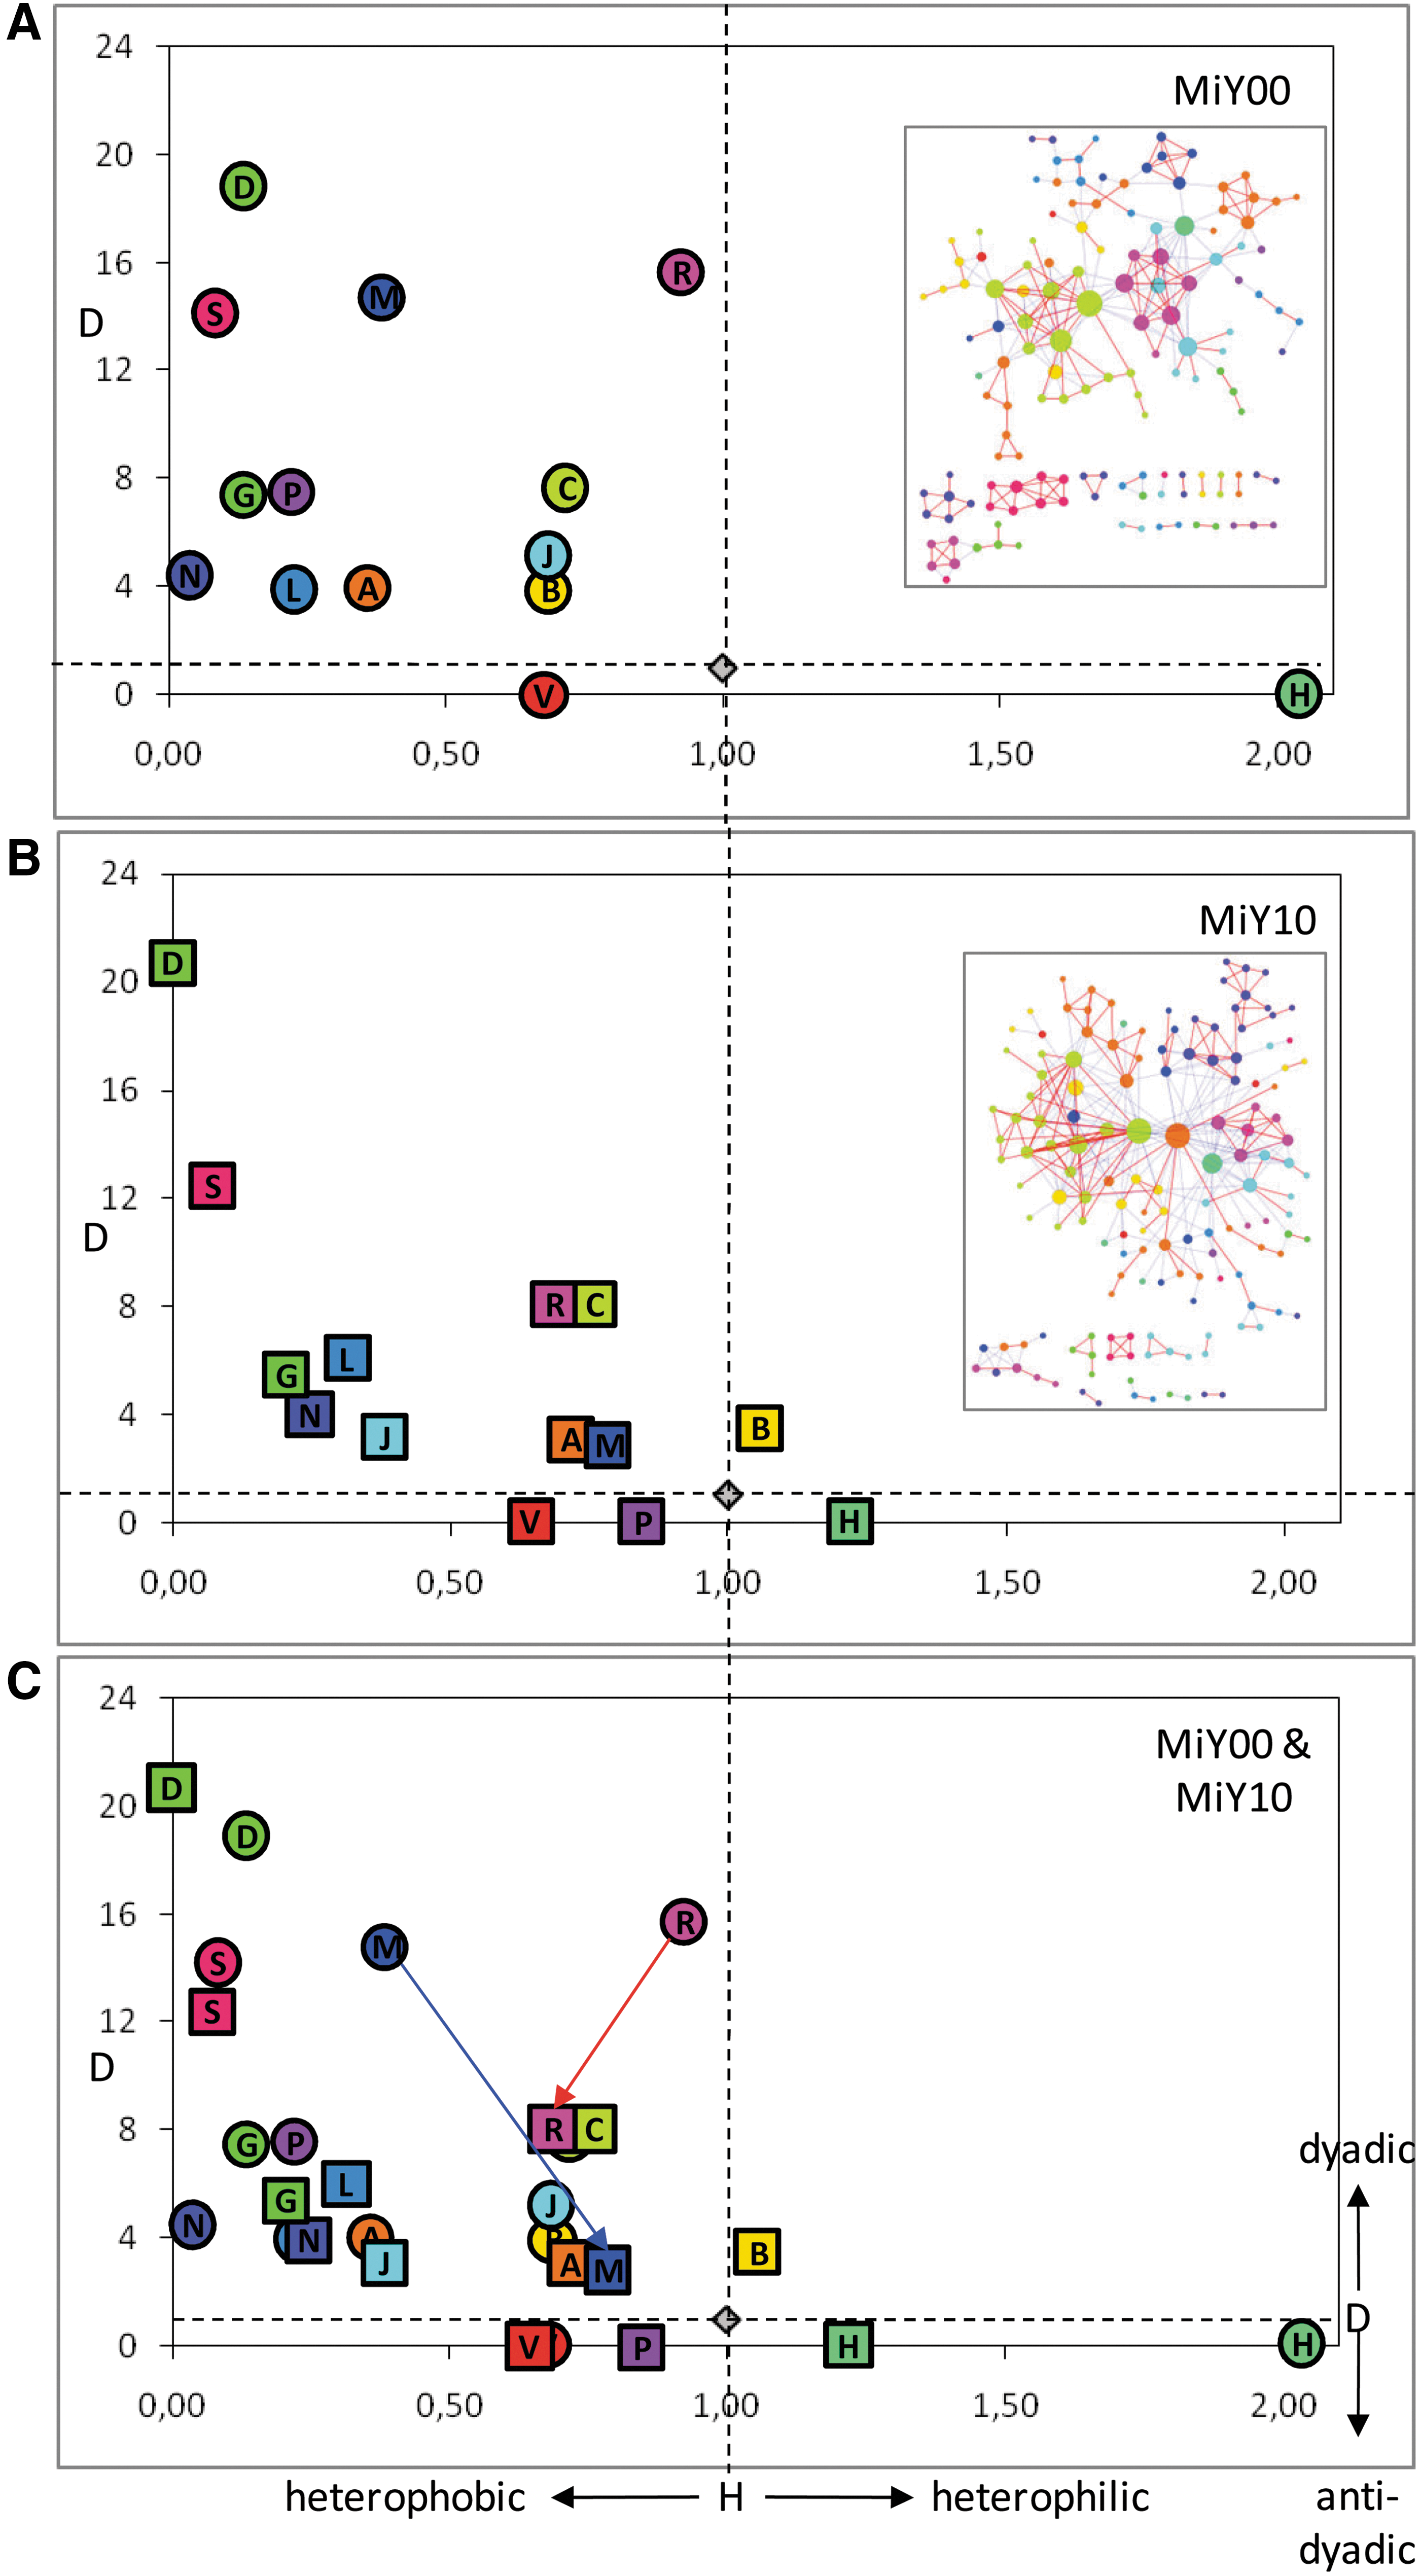
Distribution of node characteristics. The dydacity to heterophilicity (D/H) scatterplots indicate the results of the dyad analysis for each of the 14 ATC anatomical classes present in the MiY00 (
The DPN allows following changes in co-prescription with time
To test whether the DPN can highlight changes with time in the patterns of co-prescription, we compared the MiY00 with the MiY10 DPN. The MiY10 DPN retained 72 nodes of the MiY00 DPN, even though it also contained 43 new nodes and did not contain any more 18 nodes. In addition, few of the 72 retained nodes, including the PPIs (A02BC), had a higher k in the MiY10 DPN.
However, notable changes occurred in network modularity and node assortativity. First, although modularity was comparable between the MiY00 and MiY10 DPNs (see above), qualitative differences emerged (Fig. S3, panels a and c). In particular, two modules that corresponded to the distinct areas of acid-related disorders (module 2) and musculoskeletal inflammation (module 6) in the MiY00 DPN become a single cluster (module 3) in the MiY10 DPN. The change was associated with the notable growth in size of the A02BC node, which reflects its increase in connectivity. A similar merging of modules occurred elsewhere in the DPN. For instance, two modules, which corresponded to the two distinct cardiovascular (modules 1, 9) and diabetes (modules 8, 13) areas in the MiY00 DPN, become a single cluster (module 1) in the MiY10 DPN. Conversely, some other clusters identified in the MiY00 as modular areas (e.g., the neoplasia-related areas) become more dispersed in the MiY10 DPN. Finally, a new area related to drugs for the central nervous system (modules 4 and 15 of the MiY10 DPN) only appears in the MiY10 DPN.
In addition, while examining modularity, we also noticed differences in the topological roles of the nodes (Table S1), including the switch of the PPIs (A02BC) from a marginal (ultra-peripheral) role in 2000 to a more central (connector) role in 2010. Moreover, also vitamin D and analogs (A11CC), as well as the combinations of penicillins including β-lactamase inhibitors (J01CR), switched from the ultra-peripheral to the connector role.
Second, we examined assortativity by ATC class. As detailed above, there was a trend toward a reduction in assortativity in 2010 when compared with 2000 (Fig. 2B), as well a change in the distribution of node characteristics for selected classes, as measured in terms of Euclidean distance on the D/H plot (Fig. 3C). Specifically, although most classes had similar characteristics in the MiY00 and MiY10 DPNs, the musculo-skeletal (M) and respiratory (R) classes displayed major decreases in dyadicity (from 2000 to 2010). Interestingly, however, in contrast to the R class, the M class became in 2010 not only less dyadic but also less heterophobic, which mirrors the tendency toward co-prescription of the musculo-skeletal drugs with dissimilar drugs, primarily the A02BC PPIs and the other anti-acids of the A class.
Discussion
Medication prescription can show a variable range of complexity, from the simple prescription of a single drug to very complex therapies, with a wide range of duration, from a single administration to lifelong therapy. 21 To explore this complexity, we applied the network approach to a large set of drug prescriptions.
The first major finding of this study is that the DPN is a dense, modular, and assortative network. Density reflects the widespread habit of co-prescription. Modularity indicates that it is possible to subdivide the DPN into distinct clusters of massively co-prescribed drugs. Assortativity implies that drugs of the same ATC group are often co-prescribed to the same patient. Interestingly, the assortativity observed in a circumscribed administrative unit (e.g., the MiY00 DPN) is conserved in the wider region that encompasses the unit (i.e., the RandY00 DPN), a feature that can be exploited by health care providers for prediction purposes.
In contrast, the topological roles of specific groups of drugs, while conserved across space, display considerable variation across time, which can be used to highlight dynamic changes in drug utilization. In addition, temporal differences among nodes in connectivity reflect changes in attitude prescription in elderly people (e.g., a decreased use of digitalis glycosides and xanthines due to potentially secondary effects compared to safer drugs), as well as the recent availability of medications that are co-prescribed frequently today (e.g., PPIs and platelet aggregation inhibitors). 22
Actually, one of the major features of the new network-based method is the ability to display trends in the co-prescription of a given drug within the context of the general co-prescription practice. The temporal changes in the co-prescription of the PPIs support this contention. For instance, the tendency to prescribe PPIs together with an increasingly higher number of other drugs translates graphically into the emergence of the A02BC node as a high-connectivity hub and a topologically central inter-module connector. Furthermore, it results in the merging of previously distinct modules (acid-related disorders and musculoskeletal inflammation) into one single cluster of co-prescription.
As shown in another analysis on the same data at regional level, 23 PPIs (A02BC), platelet aggregation inhibitors, excluding heparin (B01AC), and statins (C10AA) were the classes with the biggest increases in 2010, with rises from 2000 of 31.1%, 30.1%, and 23.8%, respectively (p<0,0001). Possible explanations of co-prescription changes might be the increase in the prevalence of diagnoses of chronic diseases and multi-morbidity in these individuals, the implementation of new guidelines for the treatment of many chronic diseases, the recommendation of lowering the thresholds for starting drug treatments, and the approval of new drugs for chronic diseases. In particular, PPIs are gaining increasing attention due to their massive prescription at the population level without a clear clinical indication. Pasina and colleagues 24 showed that, in Italian patients, these drugs are largely prescribed without indication. Our findings demonstrate the change of the role of these drugs, which are also prescribed long term with several adverse events such as pneumonia and intestinal infections. 25
Limitations and future research
Some limitations deserve to be mentioned. First, the Lombardy Region does not collect data on drugs not reimbursed by the NHS and on over-the-counter (OTC) medications. Hence, we could not evaluate the prescription patterns of some drugs that are commonly used by the elderly, such as benzodiazepines, peripheral vasodilators (the so-called cerebro-active agents), vitamins, laxatives, and seasonal drugs. This could have resulted in an under-estimation of drug use. Second, we cannot tell whether the drugs prescribed were really taken. Third, the application of network analysis to pharmacology is a complex and novel approach. Actually, as far as we know, our study is only the second published study using this system approach to untangling the complexity of the drug prescription process. Yet we believe that the network-based approach will offer greater knowledge not only of physiology and pathology but also of prescribing and spending for medicines.
Footnotes
Author Disclosure Statement
No competing financial interests exist. All the data were managed according to the current Italian law on privacy.
References
Supplementary Material
Please find the following supplemental material available below.
For Open Access articles published under a Creative Commons License, all supplemental material carries the same license as the article it is associated with.
For non-Open Access articles published, all supplemental material carries a non-exclusive license, and permission requests for re-use of supplemental material or any part of supplemental material shall be sent directly to the copyright owner as specified in the copyright notice associated with the article.
