




Abstract
Sarcopenia-related falls and fall-related injuries in community-dwelling elderly people garnered more and more interest in recent years. Low-magnitude high-frequency vibration (LMHFV) was proven beneficial to musculoskeletal system and recommended for sarcopenia treatment. This study aimed to evaluate the effects of LMHFV on the sarcopenic animals and explore the mechanism of the stimulatory effects. Senescence-accelerated mouse P8 (SAMP8) mice at month 6 were randomized into control (Ctrl) and vibration (Vib) groups and the mice in the Vib group were given LMHFV (0.3 g, 20 min/day, 5 days/week) treatment. At months 0, 1, 2, 3, and 4 post-treatment, muscle mass, structure, and function were assessed. The potential proliferation capacity of the muscle was also evaluated by investigating satellite cells (SCs) pool and serum myostatin expression. At late stage, the mice in the Vib group showed higher muscle strength (month 4, p = 0.028). Generally, contractibility was significantly improved by LMHFV (contraction time [CT], p = 0.000; half-relaxation time [RT50], p = 0.000). Enlarged cross-sectional area of fiber type IIA was observed in the Vib group when compared with Ctrl group (p = 0.000). No significant difference of muscle mass was observed. The promotive effect of LMHFV on myoregeneration was reflected by suppressed SC pool reduction (month 3, p = 0.000; month 4, p = 0.000) and low myostatin expression (p = 0.052). LMHFV significantly improved the structural and functional outcomes of the skeletal muscle, hence retarding the progress of sarcopenia in SAMP8. It would be a good recommendation for prevention of the diseases related to skeletal muscle atrophy.
Introduction
S
Vibration treatment is a noninvasive biophysical modality providing cyclic loading to whole body transferring mechanical energy to the subjects physically. 9 Low-magnitude high-frequency vibration (LMHFV) is a well-accepted intervention, which has been proven to be beneficial to the musculoskeletal system in the elderly. 10,11 It has been reported that high-frequency vibration treatment increased the skeletal muscle mass and strength. 12,13 Rubin's study demonstrated that LMHFV could inhibit adipogenesis. 14 Moreover, our previous studies revealed that LMHFV enhanced bone fracture healing, 15 –17 angiogenesis, and blood flow of the fracture sites, 18 improved balancing ability, and reduced the fall incidences in community elderly. 11,19 The expression of myostatin, which is closely related to the satellite cell (SC) dysfunction, 20 was also reported to be downregulated by LMHFV. 21,22 LMHFV was used in this study because it meets the safety threshold of ISO-2631 23 that is safer and more suitable for the elderly with sarcopenia than high-magnitude therapies (with up to 50-fold), if applied clinically, while the scientific evidences of high-magnitude ones should be still relevant.
In this study, we hypothesized that LMHFV stimulated the sarcopenic muscle by increasing the skeletal muscle mass, improving muscle function, enlarging muscle SC pool, and reducing the serum myostatin level in senescence-accelerated mouse P8 (SAMP8) animal model. The objective of this research was to evaluate the effects of LMHFV on the sarcopenic animals and explore the related mechanisms.
Materials and Methods
Animal model and study design
Male SAMP8 mice were obtained from the Laboratory Animal Service Center (LASEC), the Chinese University of Hong Kong, where a male was used to avoid high hormonal variation. 24 All animals were kept under conventional conditions, on a 12-hour light—12-hour dark cycle with food and water ad libitum. The research protocol was approved by the Animal Experimentation Ethics Committee of the Chinese University of Hong Kong (Ref: 12/012/MIS).
A total of 54 SAMP8 mice aged 6 months were randomized into control (Ctrl) and vibration (Vib) groups. The mice in the Vib group were treated with LMHFV (35 Hz, 0.3 g, where g = gravitational acceleration) 20 min/day and 5 days/week, 18 while those in the Ctrl group were given the same regimen with the platform power off. The mice were then euthanized to evaluate the functional and structural outcomes at months 0, 1, 2, 3, and 4 post-treatment with six mice in each time point, where Ctrl and Vib groups shared the month 0 time point. Along the progression of aging, skeletal muscle fiber type II was reported to decrease more in sarcopenia. 25 As a fast-twitch muscle, gastrocnemius was therefore selected as the target muscle by considering its important roles in the posture holding and body movement. 24
Body mass of each mouse was measured once a month before euthanasia. At designated time points, the mouse was incised under general anesthesia and gastrocnemius of the right hind limb was freshly isolated carefully together with Achilles tendon and femur condylar for functional assessment. The assessments, however, could not be longitudinally performed, which is a limitation. The contralateral muscle was also isolated for histology and immunofluorescence. After weighing the wet muscle mass, the isolated left gastrocnemius was put into frozen 2-methylbutane under optimal length for 20 seconds and then stored at −80°C for the following histological assessments. In the meantime, blood was drawn from the heart of the mouse before euthanasia and placed at room temperature for 20 minutes and centrifuged at 3,000 rpm for 10 minutes at 4°C. The serum sample was collected and subsequently stored at −80°C for biochemical analysis.
Ex vivo functional test
The isolated left muscle was incubated in the organ bath of the Ringer solution and the muscle function was investigated with the ex vivo muscle functional test system (800A; Aurora Scientific, Inc.) according to the established protocol.
24,26,27
After a 15-minute stabilization period, two tetanic contractions with 5-minute intervals were induced (1A, 300 ms duration, 150 Hz stimulation frequency) to activate all the muscle fibers before the functional test. The optimal length (Lo
) of the muscle was measured by eliciting isometric twitch with increasing muscle length until maximal force was generated. Under the Lo
, the muscle was electronically stimulated two more times by a single stimulus with a 1-minute interval to evaluate the twitch characteristic (twitch force, F0). A continuous stimulus was given thrice for 300 ms at 150 Hz with 5 minutes of rest to evaluate the tetanic contraction ability (tetanic force, Ft). To evaluate the fatigability, pulses of 300 ms tetanic stimuli were provided at 150 Hz. The total time of 30 consecutive pulses at 5-second intervals was 150 seconds. Skeletal muscle fatigue was investigated by associating the peak force at a preset stimulation time with that of the initial muscle contraction force induced by a series of electronic stimuli.
26,28
Fatigue induced with repeated tetanic was evaluated by the fatigue rate (FR) and fatigue extent (percentage loss of muscle force, loss%).
28
The results were recorded with the Dynamic Muscle Control system (DMC v5.4; Aurora Scientific, Inc.) and analyzed by the Dynamic Muscle Analysis system (DMA v3.2; Aurora Scientific, Inc.). The muscle cross-sectional area (MCSA) was calculated by dividing the muscle mass by the muscle optimal length (L0
) and the density of mammalian skeletal muscle (1.06 mg/mm3). Normalized by MCSA, the specific twitch force (SF0) and specific tetanic force (SFt) were obtained as the following equations
27
:
MM = muscle mass (g) ×1000 makes it mg, and
L0 = optimal muscle length (cm) ×10 makes it mm.
Histology
Adenosine triphosphatase staining was performed to identify different kinds of muscle fibers according to the protocol established in our previous study. 30 Muscle transverse sections were cut at 8 μm with a cryostat (Cryocut 1800; Leica) at −20°C. All sections were brought to room temperature and incubated in preincubating solution at pH4.45 for exactly 5 minutes and then incubated in ATP solution at pH9.4 for 25 minutes. Three random fields of each section were taken from each section with a microscope (Leica Microsystems Ltd) at 50× and 200× magnifications. Morphometric analysis was performed with Image-Pro Plus Software (Version 6.0; Media Cybernetics, Inc.). The muscle fiber could be identified as type I (darkest), type IIA (lightest), and type IIB (moderate). The average fiber size was quantified for each fiber type.
Immunofluorescence
Pax7/laminin double staining was performed on the muscle cryosections to identify the SCs. The Pax7 antibodies (primary: rabbit anti-mouse Pax7, 1:10, Abcam; secondary: goat anti-rabbit GaM-Biotin, 1:1000, JIRL; tertiary: Cy3-strep, 1:2500, JIRL) and laminin antibodies (primary: rabbit anti-mouse, 1:800, Abcam; secondary: goat anti-rabbit, IgG H&L, 1:500, Abcam) were used based on the Diao et al. protocol. 31 A fluorescence microscope system (DM 6000B upright microscope; Leica Microsystems, GmbH) and IM50 software (Leica Microsystems, GmbH) were used for spatial detection of the SCs and analysis. Each muscle section was divided into 4 parts and one field was captured randomly in each part. The SC was defined as the Pax7+/DAPI+ cell (pink fluorescent signal) located between the laminin basement membrane (green fluorescent signal) and the muscle fiber. The SC number and the muscle fiber number were counted by Image-Pro Plus software (Media Cybernetics, Inc.) and the number of SCs per 100 muscle fibers was regarded as the parameter for SC pool evaluation. 32
Enzyme-linked immunosorbent assay
The myostatin level in serum was determined by the mouse myostatin enzyme-linked immunosorbent assay (ELISA) kit according to the manufacturer's instructions. The absorbance was read at 450 nm with a microplate spectrophotometer (μQuant; BioTek Instruments, Inc.), and Gen5 software (Gen5 Version1.08, BioTek Instruments, Inc.) was used to calculate the density of myostatin in the serum. However, the myostatin level was not corrected by the change of blood volume as the systemic effect of LMHFV on systemic blood volume was assumed not significant.
Statistical analysis
All the quantitative data are expressed in mean ± standard deviation. Data analysis was performed with two-way analysis of variance (ANOVA) and post hoc Tukey's tests using SPSS (Version 20.0; IBM) for between-group comparison among different time points, where one-way ANOVA and post hoc Tukey's test were used for within-group comparison. Independent-sample t-test was performed to compare the parameters between the two groups at each time point. The linear slope was calculated for FR analysis, and one-way ANOVA, followed by Tukey's post hoc test, was performed for the slope evaluation. The significance level was set at p ≤ 0.05.
Results
Muscle mass and cross-sectional area
The largest muscle mass (MM) appeared at month 1 (Ctrl: 0.137 ± 0.007 g; Vib: 0.132 ± 0.008 g) and decreased from month 1 to 4 (Fig. 1A). In the Vib group, MM at month 4 was lower than those of months 1 and 3 significantly (p = 0.024 and p = 0.043, respectively, one-way ANOVA). There was no significant difference between Ctrl and Vib groups in MM (p = 0.285, two-way ANOVA). The change of MCSA in the Ctrl group was not significant (Fig. 1B). However, in the Vib group, the MCSA at month 4 was much lower than that at months 1 and 2 significantly (p = 0.029 and p = 0.001, respectively, one-way ANOVA). No significant difference was observed between Ctrl and Vib groups (p = 0.218, two-way ANOVA).
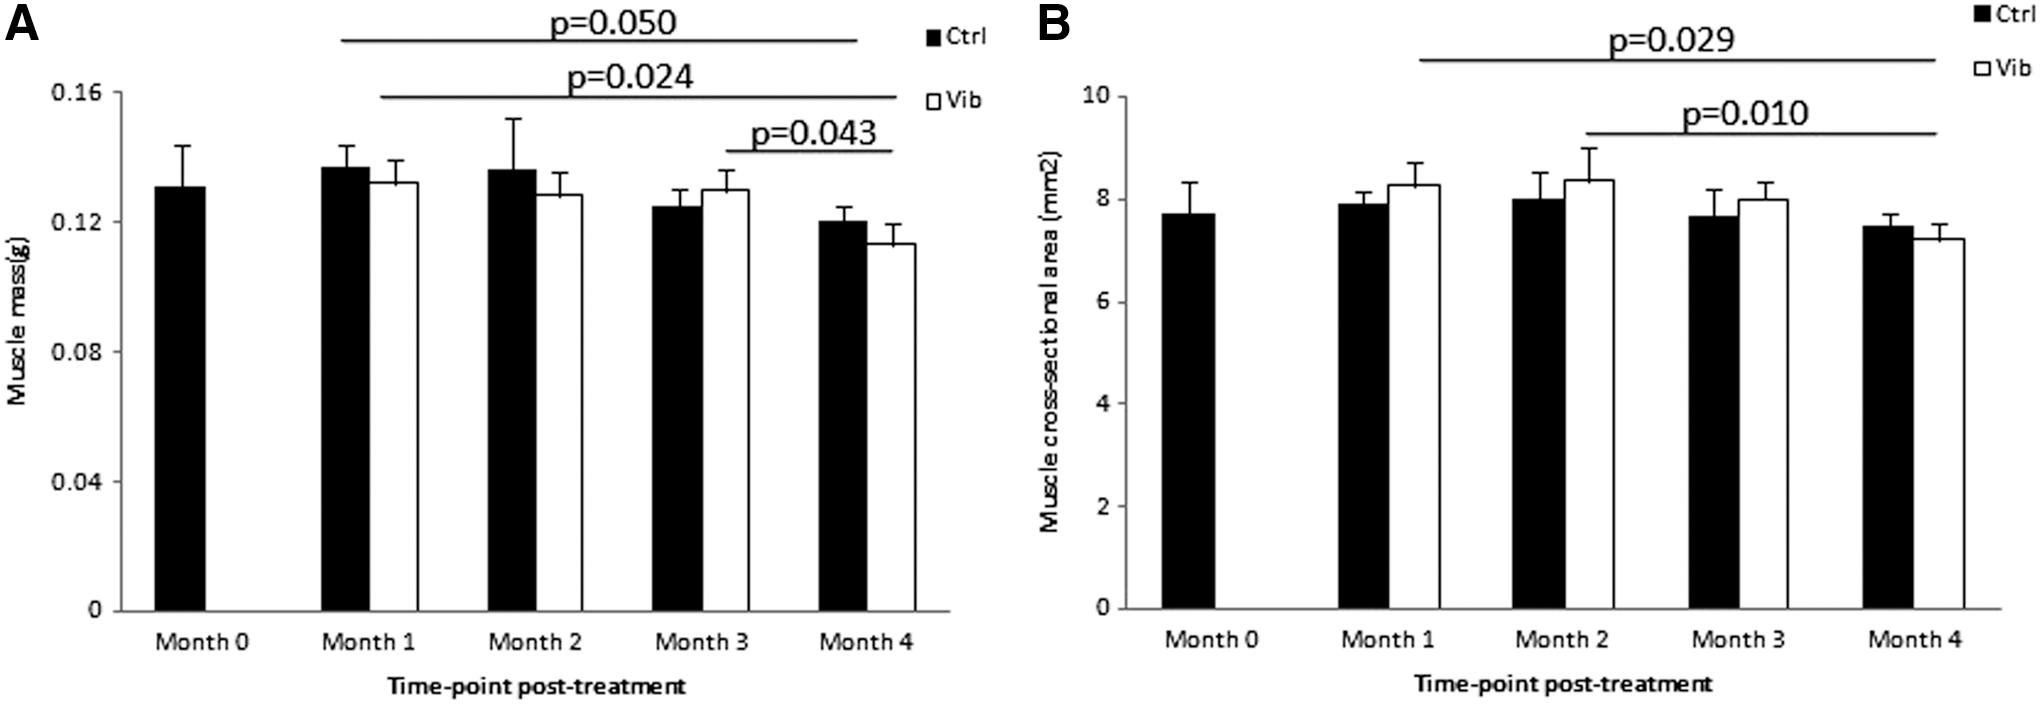
Morphological parameters between control (Ctrl) and vibration (Vib) groups.
Muscle strength
Muscle strength was measured at months 0, 1, 2, 3, and 4 after vibration treatment and normalized by the MCSA to derive the specific twitch force (SF0) and specific tetanic force (SFt). In the Ctrl group, the SF0 increased from month 0 to 3 (p = 0.175, one-way ANOVA), but then decreased slightly from month 3 to 4 (Fig. 2A). In the Vib group, the peak of SF0 appeared at month 4. From month 0 to 4, the SF0 showed an increasing trend (p = 0.166, one-way ANOVA). The SF0 in the Ctrl group was higher than that in the Vib group from month 1 to 3, but became significantly lower at month 4 (Ctrl <Vib, p = 0.028, independent sample t-test). The peak of SFt in the Ctrl group was observed at month 1 (Fig. 2B). From month 1 to 3, there was no significant change, but a decrease at month 4. Compared with month 0, SFt of Ctrl group at months 1, 2, and 3 was significantly higher (p = 0.001, 0.004, and 0.003, respectively, one-way ANOVA). The SFt in the Vib group showed an increasing trend from month 0 to 4 (p = 0.198, one-way ANOVA). From month 1 to 3, the SFt in the Ctrl group was higher than those in the Vib group, with significant difference at month 1 (p = 0.008, independent sample t-test). However, the relative relationship was reversed at month 4. SFt in the Ctrl group was slightly lower than that in Vib group (p = 0.315, independent sample t-test).
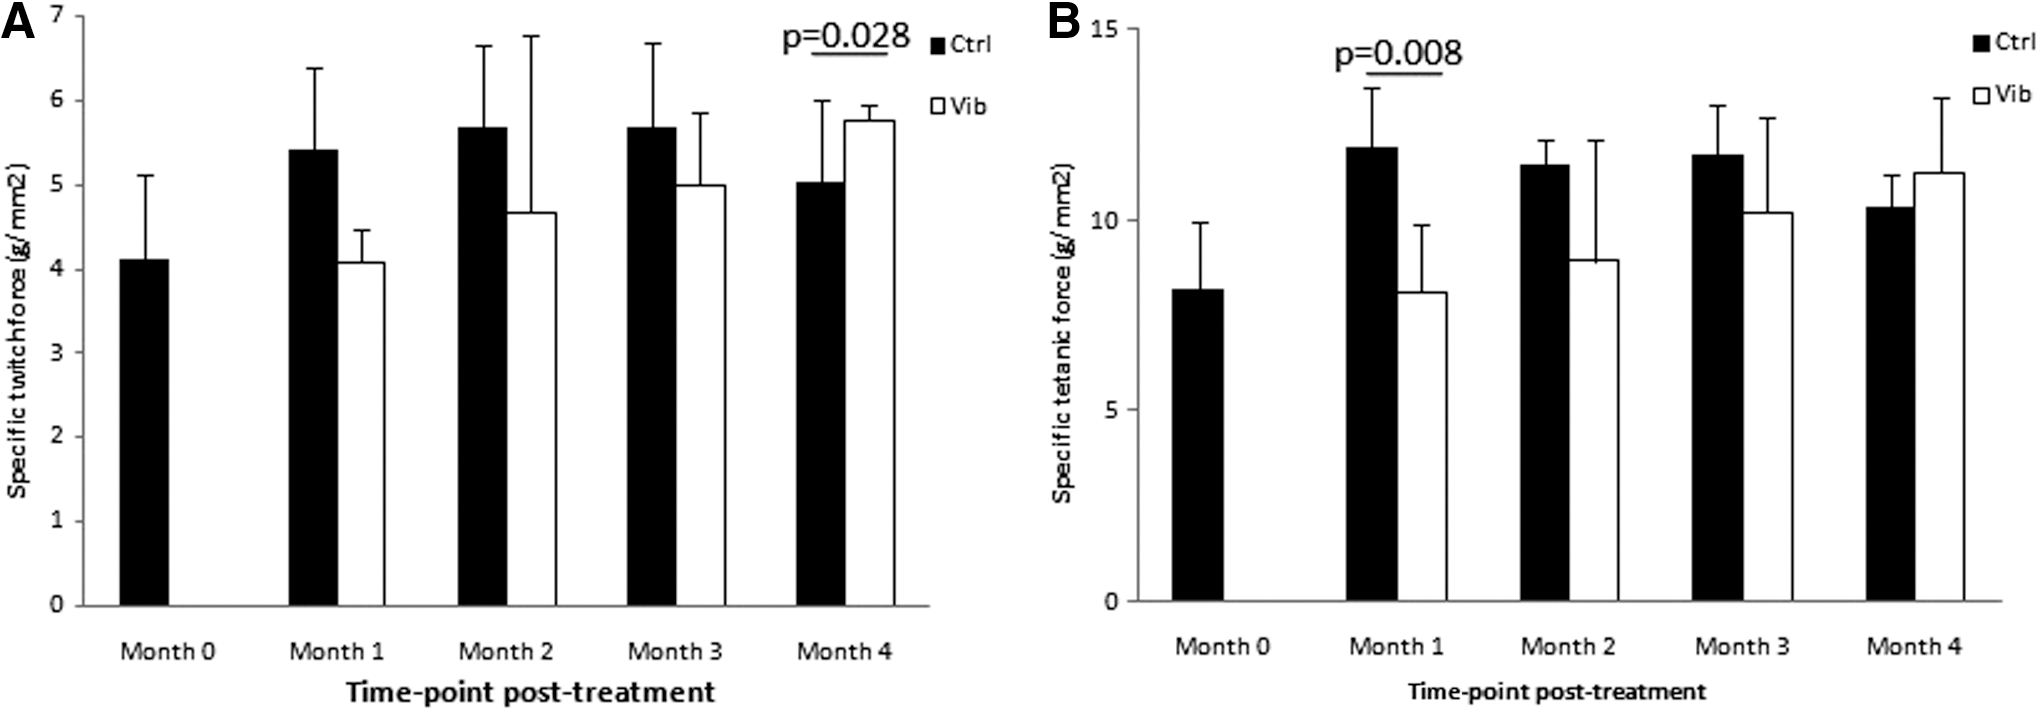
Muscle strength.
Contractibility and fatigability
There was no significant difference among different time points within the group in both Ctrl and Vib groups. In general, the contraction time (CT) in the Ctrl group was longer than that in Vib group (p = 0.000, two-way ANOVA) and significant differences were observed at month 2 (Ctrl > Vib, p = 0.000, independent sample t-test) and month 4 (Ctrl > Vib, p = 0.005, independent sample t-test) (Fig. 3A). The Ctrl group showed longer half-relaxation time (RT50) than Vib group generally (p = 0.000, two-way ANOVA). Moreover, significant differences were observed at month 1 (Ctrl > Vib, p = 0.002, independent sample t-test) and month 2 (Ctrl > Vib, p = 0.000, independent sample t-test) (Fig. 3B).
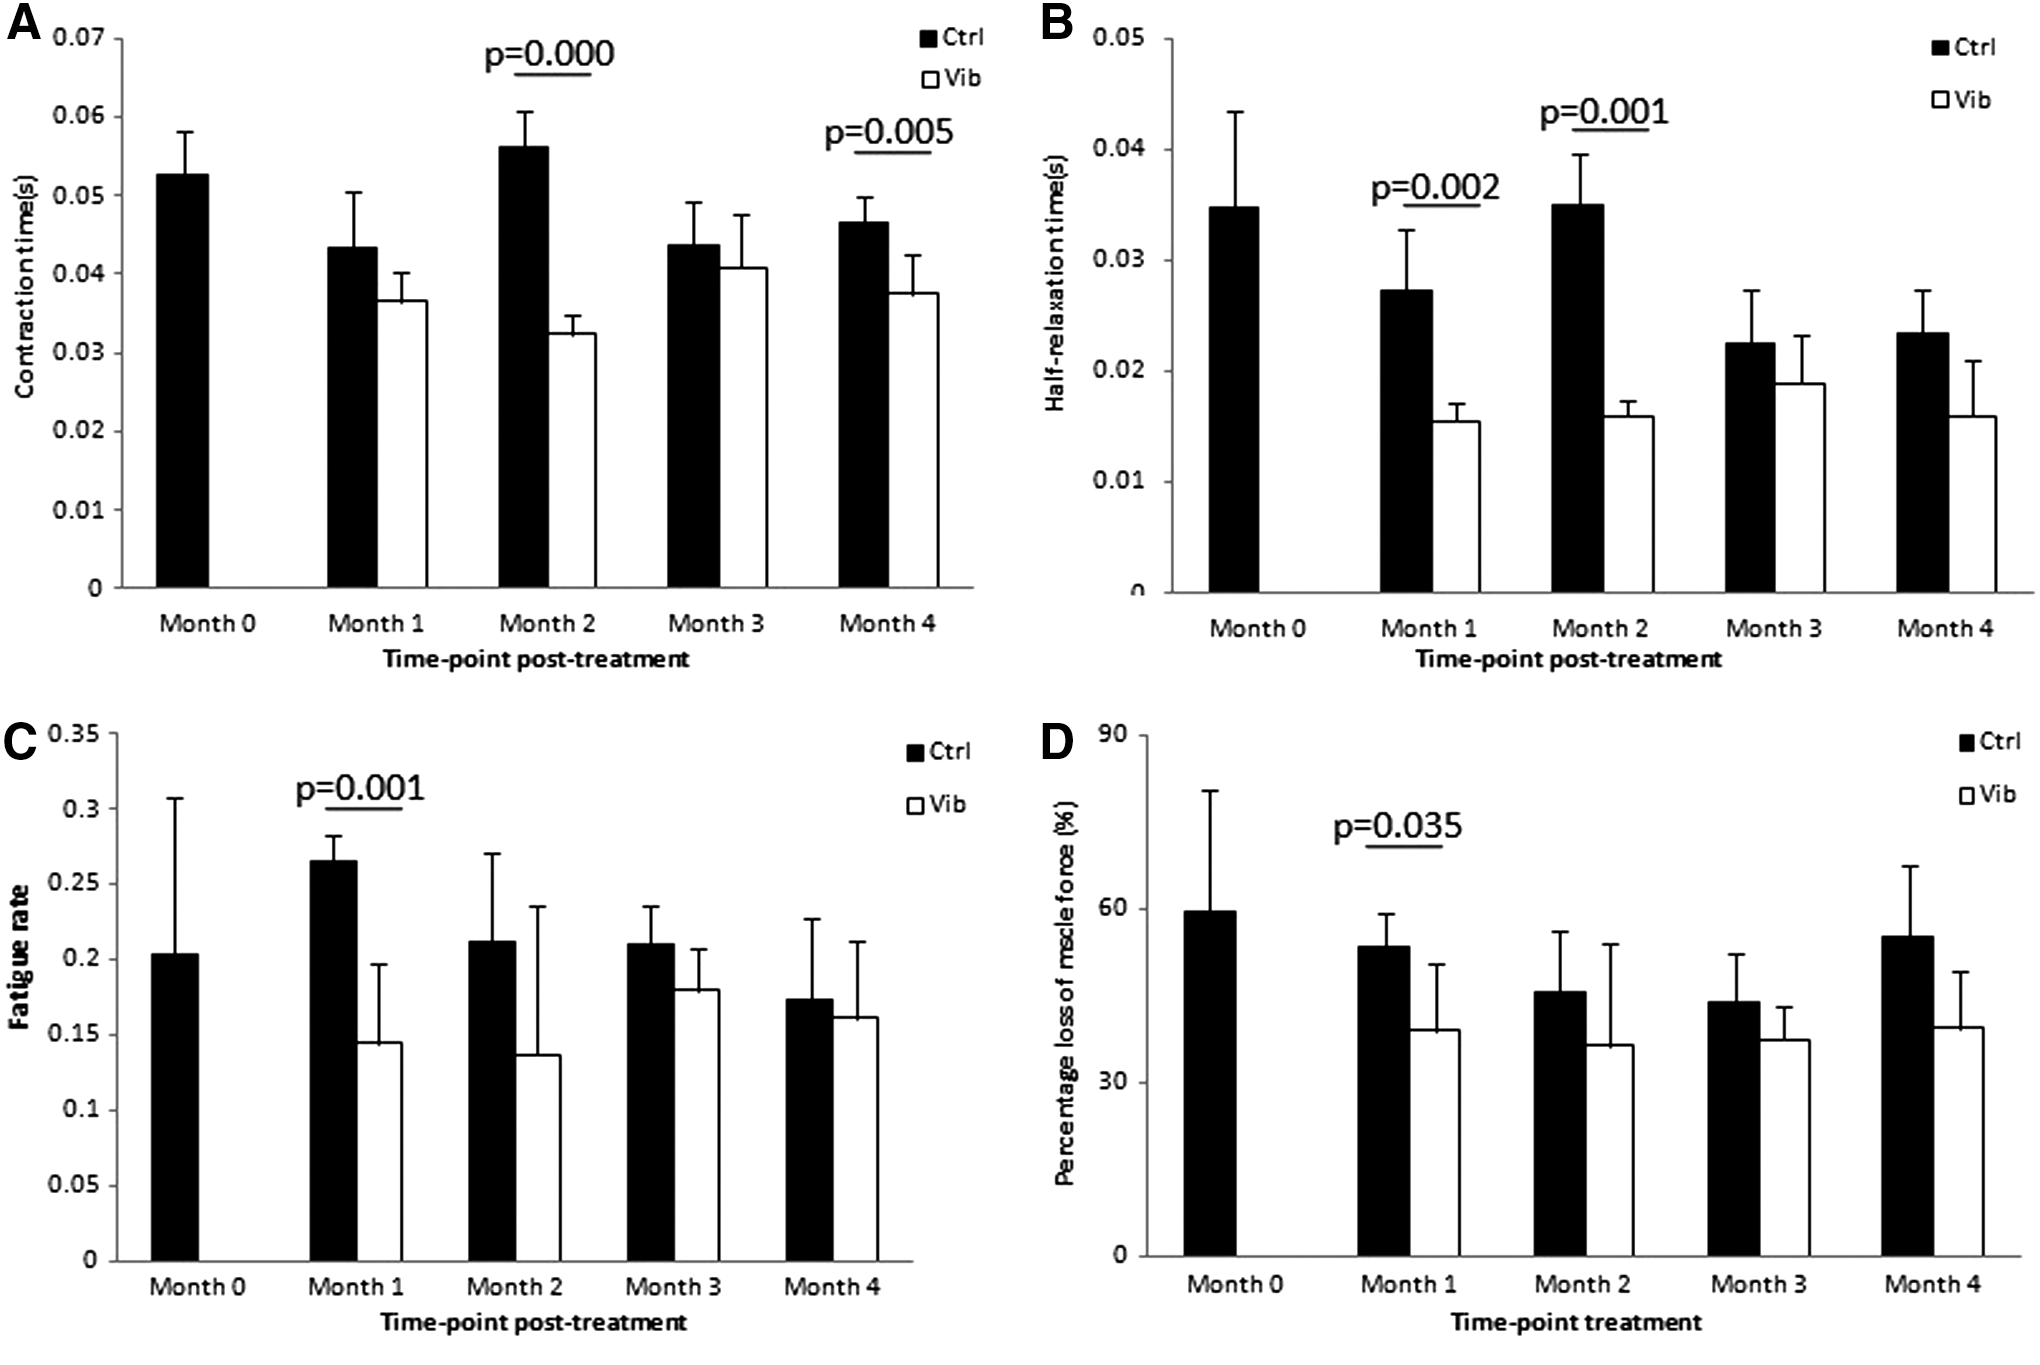
Muscle contractibility and fatigability.
In both Ctrl and Vib groups, no obvious difference of FR or loss% was observed among different time points within the group. Generally, FR in Ctrl groups was higher than that in the Vib group (p = 0.01, two-way ANOVA). At month 1, the difference was significant (p = 0.001, independent sample t-test) (Fig. 3C). In the Vib group, no significant change of loss% among different time points was observed in the Ctrl group. The loss% in the Vib group was lower than that in the Ctrl group (p = 0.01, two-way ANOVA) with significant difference at month 1 (p = 0.035, independent sample t-test) (Fig. 3D).
Fiber typing and fiber cross-sectional area
In the Ctrl group, the largest fiber cross-sectional area (FCSA) of fiber type I appeared at month 2, which was higher than those at months 3 and 4 (p = 0.009 and p = 0.009, respectively, one-way ANOVA) (Fig. 4A). In the Vib group, the FCSA at months 1 and 4 was significantly larger than those at the corresponding time points in the Ctrl group (p = 0.008 and p = 0.042, respectively, independent sample t-test), but a lower FCSA at month 2 when compared with the Ctrl group (p = 0.001, independent sample t-test). The peak of FCSA type IIA in the Ctrl group was at month 3, with no significant difference among the time points within the group (Fig. 4B). In the Vib group, FCSA increased from month 0 to 1 (p = 0.000, one-way ANOVA), then followed with a decrease from month 1 to 4 (month 1 > month 2, p = 0.017; month 1 > month 4, p = 0.000, one-way ANOVA). In general, the Vib group had larger FCSA of type IIA than the Ctrl group (p = 0.000, two-way ANOVA) and the differences were significant at months 1, 2, and 3 (p = 0.000, p = 0.035, and p = 0.003, respectively, independent sample t-test). There was no significant within-group change of FCSA of type IIB among different time points in both Ctrl and Vib groups; no significant difference was observed between Ctrl and Vib groups at each time point (Fig. 4C).
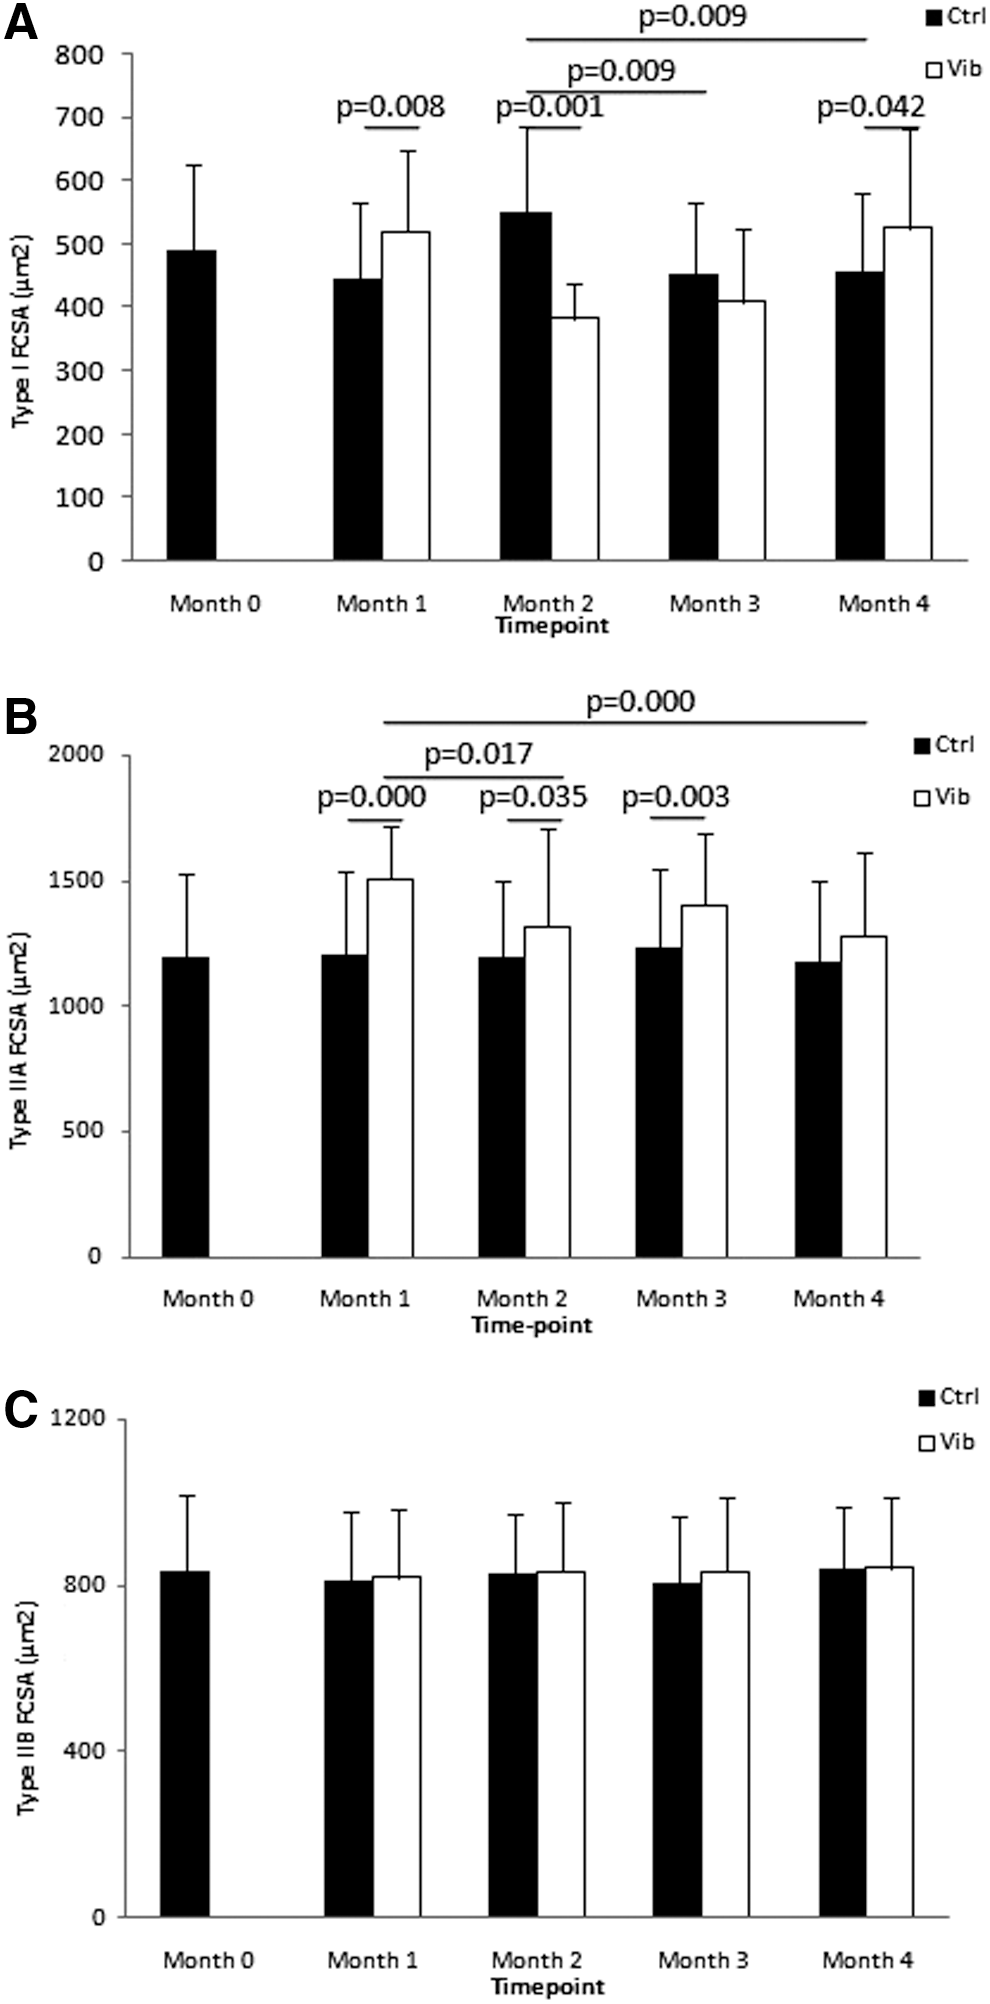
Fiber cross-sectional area of the muscle.
SC counting
From month 2 to 4, the SC amount sharply decreased in the Ctrl group, and the SCs, counting at months 3 and 4, were significantly lower than month 2 (p = 0.000 and 0.000, respectively, one-way ANOVA) (Fig. 5B). The Vib group had a higher SC amount at months 3 and 4 than those at the corresponding time points in the Ctrl group (p = 0.001 and p = 0.001, respectively, independent sample t-test). Generally, the SC amount in Vib groups was higher than the Ctrl group (p = 0.001, two-way ANOVA).

Satellite cell (SC) counting.
Serum myostatin level
Myostatin level decreased from month 0 to 2 and increased from month 2 to 4 in both Ctrl and Vib groups, but the difference was not significant among the time points within the group (Fig. 6). In general, the Vib group had a higher serum myostatin level than Ctrl and the difference was significant at month 2 (p = 0.031, independent sample t-test). However, a significantly lower expression of myostatin in Vib group was observed at month 4 when compared with Ctrl group (p = 0.050, independent sample t-test).

Serum myostatin level in Ctrl and Vib groups at different time points. The myostatin level in the Ctrl group was lower than Vib group at month 2 (p = 0.031, independent sample test), but higher at month 4 (p = 0.052, independent sample t-test).
Discussion
The present study aims to investigate the effects of LMHFV on progression of sarcopenia in SAMP8 mice. The current results showed that muscle fiber type IIA, which accounted for more than 50% of the gastrocnemius, was significantly improved by LMHFV in FCSA. LMHFV could also enhance muscle function, such as contractility and fatigue durability. Compared with Ctrl group, the increased SC pool and lower myostatin level at late time point in the Vib group indicated that LMHFV could suppress the age-related decrease of skeletal muscle regeneration.
The long-term effect of LMHFV on skeletal muscle function was proven positive. It was reported that 10 weeks of high-frequency vibration (20–50 Hz, 2–4 mm) treatment increased the skeletal muscle strength. 12,13 A previous study revealed that 10 minutes of whole body vibration (WBV) (45 Hz, 2.2 mm, 7.7 g) induced lower running capacity after 2 minutes post-treatment. 33 However, some other investigations found that over 5 months of high-frequency (>30 Hz, <2–4 mm) WBV treatment significantly improved muscle strength and power. 34,35 In the present study, LMHFV treatment caused lower SF0 and SFt in the Vib group from month 0 to 3. However, the SF0 in the Vib group was higher than that in the Ctrl group at month 4, and a similar trend of SFt was also observed. Our results also demonstrated that the SF0 and SFt in Vib group showed an increasing trend from month 0 to 4. These proved that the acute effect of vibration treatment on skeletal strength was negative, but the long-term effect was positive.
In this study, LMHFV improved the muscle contractility by shortening CT and RT50 at each time point in the Vib group. It has been demonstrated by previous studies that vibration (35–40 Hz) was beneficial in improving the skeletal muscle contractility with regard to the reduction of response time and improvement of balancing ability. 36 –38 We know that skeletal muscle fiber type IIA plays a crucial role in movement and balance with fast twitch speed and high fatigue durability. 39 One of our previous studies demonstrated that high-frequency vibration treatment (20 Hz, 20 min/day, 5 days/week) significantly improved the gait speed. 19 In addition, the balancing ability was improved and fall incidence was reduced after 18 months of LMHFV treatment (35 Hz, 0.3 g, 20 min/day, 5 days/week) in our randomized controlled trial. 11 These evidences support that LMHFV would be beneficial to skeletal muscle fiber type IIA with a positive long-term effect on the community elderly. The fiber type IIA was more sensitive to the mechanical stimulation, and vertical vibration treatment was reported to improve the contractibility of gastrocnemius by provoking the contractile element. 40 The improved muscle contractility provided a good evidence to support the beneficial effect of LMHFV on enhancing the muscular performance by shortening response time and improving balancing ability. Moreover, it shows a clinical potential in the application of LMHFV on muscle function decline in the community elderly.
Both of the FR and loss% were significantly reduced by LMHFV in this study, which indicated that LMHFV enhanced the fatigue resistance of skeletal muscle. It has been proven that vibration (25 Hz, 4 mm) enhanced the skeletal muscle endurance by improving the endurance-associated parameters such as energy metabolism and turnover, blood flow, and neuromuscular activation. 37 Hilgers et al. also reported that vibration training (30 Hz, 1–2 mm) improved the walking endurance in the sit-to-stand test, timed up and go test, 10-meter walk test, and 6-minute walk test. 41 This is well known that muscle fiber type IIA is fast-twitch and fatigue resistant, hence the improved fatigue durability induced by LMHFV may be due to the increased muscle fiber type IIA as shown in our muscle fiber typing results.
A previous study revealed that consistent mechanical loading induced an increased muscle fiber type IIA MHC expression. 42 Moreover, WBV (50 Hz, 2.5 mm) was also proven to improve the fiber type IIA motor units (fast fatigue-resistant motor units, FR MUs). 43 In the present study, it was revealed that the stimulatory effect of LMHFV on the FCSA of fiber type IIA was present throughout the whole treatment process. However, the improvement of LMHFV on muscle strength occurred mainly at the late phase. The explanation for the asynchronized effects of LMHFV on muscle fiber size and muscle strength might be due to potential loading injury in weakened muscle at initial treatment period that was caused by myofiber disruption due to stretching or increased muscle strain when they are loaded and lengthened. 44 The target muscle in the present study was gastrocnemius, which mainly comprised fiber type IIA as contractile tissue. 24 We found that the FCSA of fiber type IIA was significantly improved by LMHFV. It was also reported that vibration treatment (45 Hz, 0.3 g) could increase muscle fiber type II FCSA by 29%. 45 Although no significant change of muscle mass was observed, LMHFV showed beneficial effect on skeletal muscle in consideration of the improved function and type IIA FCSA. The relationship between muscle mass and muscle quality was not linear and muscle mass might not reflect the real muscle quality well. 46 von Stengel's study indicated that vibration (25–35 Hz, 1.7–2.0 mm) treatment could alter the body composition by downregulating the distribution of fat in trunk and lower limbs. 47 Moreover, Rubin's study demonstrated that LMHFV (90 Hz, 12 μm, 0.2 g) could inhibit adipogenesis. 14 We therefore postulated that LMHFV improved the muscle quality by altering muscle composition in increasing contractile property, but not enlarging the muscle mass directly.
SCs are regarded as stem cell-like cells, which are responsible for skeletal muscle repair and regeneration. 48 Besides, SCs were reported to be responsible for skeletal muscle hypertrophic growth. 48 The maintenance of quiescent SCs was a requisite for structural integrity of muscle fibers. 48 Normally, reduction of SCs was accompanied with skeletal muscle atrophy. 49 It has been documented that mechanical stimulation or resistant exercise could increase the number of SCs 48,50 and newly formed SCs would incorporate and fuse into the muscle fibers. 48 The incorporation of new skeletal myonuclei from SCs proceeded the subsequent muscle fiber growth. 51 Therefore, the presence of SCs was essential to maintain the skeletal muscle mass. Our results showed that the decreasing trend of SCs in the Ctrl group was reduced at late stage. Rubin's study on C57BL/6 mice also confirmed that low-intensity vibration treatment (90 Hz, 0.3 g) could significantly retard ovariectomy-induced SC reduction. 22 Therefore, the delayed expansion of SC pool after vibration treatment might indicate a delayed promotion effect of LMHFV on skeletal muscle self-repair and regeneration. Myostatin was also proven to associate with muscle stem cell dysfunction and a higher myostatin expression indicates an impaired myogenic capacity. 20 As a negative regulator, myostatin was reported to affect skeletal muscle growth and regulate the SC activation. 48,52 Based on our results and the above evidence, 21 LMHFV-induced early higher, but late lower, myostatin level indicated the early reduction, but late promotion, effect of LMHFV on skeletal muscle self-repair capacity.
There were a few limitations in this study. First, Takeda's research reported that the average life span of SAMP8 was 9.7 months 53 and our previous study found that the onset time of sarcopenia in SAMP8 was month 8. 24 Therefore, the last time point of this study was selected at month 4 post-treatment when the animals were 10 months old. However, we found that the muscle strength of SAMP8 in the Vib group showed a consistent increasing trend. Recruiting one more time point at month 5 post-treatment might present a clearer picture. Second, serum myostatin expression could reflect the systemic myostatin level to some extent, but local skeletal muscle myostatin expression would be more accurate to reveal the relationship between skeletal muscle function and myostatin expression. In the future, immunohistochemistry and PCR of local skeletal muscle myostatin investigation would be performed instead of serum myostatin assessment with ELISA.
In conclusion, the effect of LMHFV on skeletal muscle function was positive. The reduction of twitch force and tetanic force at early stage and the increase at late stage indicated that the acute effect of LMHFV on muscle force was negative, but the long-term effect was positive. Furthermore, the vibration treatment improved the skeletal muscle contractibility and endurance and maintained SC pool. The muscle fiber type IIA was more sensitive to LMHFV compared with other types of muscle fibers. Although no visible improvement of muscle mass was observed, the fiber distribution of the gastrocnemius was changed by the vibration treatment, which indicated that LMHFV improved the skeletal muscle function by optimizing the muscle composition, but not increasing the muscle mass directly. Based on the diagnostic criteria proposed by the European Working Group on Sarcopenia in Older People (EWGSOP) in 2010, we are unable to demonstrate that LMHFV reverses sarcopenia progression. Nonetheless, LMHFV could retard the decrease of skeletal muscle function with no adverse effects. Most importantly, LMHFV (0.3 g, 35 Hz) meets the safety threshold of ISO-2631 23 and our results confirm that LMHFV induces comparable responses to that of high-magnitude exercise, which is very suitable for the elderly population. 54,55 This noninvasive physical intervention would be a good recommendation for prevention program in falls and fall-related injuries in the community-dwelling elderly.
Footnotes
Acknowledgments
This work was supported by the General Research Fund (Ref: 14103314 and 469911), Research Grants Council, HKSAR. The author would like to show gratitude to Dr. Wang Lijun for helping in the immunofluorescence with Pax7/laminin on SCs.
Author Disclosure Statement
No competing financial interests exist.