




Abstract
Aging causes the degeneration of organs of the locomotor system, including the cerebellum and bones. Exercise may reverse this deterioration.
Introduction
Aging is an enormously complex and progressive deterioration affecting the structure and function of organ systems and tissues, 1 including the locomotor system. Bones and the cerebellum, which are important organs of that system, are not an exception. In maintaining the strength and homeostasis of minerals, bones undergo remodeling, which involves a balance between bone formation by osteoblasts and bone resorption by osteoclasts. 2
During aging, the balance is impaired 2,3 and consequently results in fragile bones. The bones will gradually degenerate and the risk of falling and bone disorders, such as osteoporosis, increase. 4 Similarly, the cerebellum undergoes degeneration during aging and causes impaired motor coordination in elderly. 5 This deterioration might be partly caused by the decline of the levels of growth factors, such as Insulin-like Growth Factor 1 (IGF-1) and Brain-Derived Neurotrophic Factor (BDNF), 6 which play a role in maintaining neurons, 7 including the cerebellar Purkinje cells' dendritic spine. 8
Physical exercise has been considered to promote neuroprotective mechanisms, 9 and to slow down the process of osteoporosis 10 during aging. Physical exercise exerts its beneficial effects by increasing neurogenesis, synaptic plasticity, spine density, angiogenesis, neurotransmitters, and growth factors, including BDNF, IGF-1, and vascular endothelial growth factor (VEGF). 7 Properly administered physical exercise doses are a key to help maximizing positive effects on bone mass. 11 Physical exercises that provide sufficient mechanical loads, such as treadmill exercises, are preferable to inhibit bone resorption, prevent bone loss, and maintain bone strength. 12
A considerable number of studies suggest that mild- and moderate-intensity exercise helps in promoting physical and cognitive health in the elderly. 13 On the other hand, high-intensity exercise increases the risk of sudden cardiac death, especially in the elderly. 14 High-intensity exercise also increases bone resorption, which in turn causes bone damage. 15 Therefore, moderate intensity is preferable to high intensity exercise regimens for investigating therapeutic effects on cognitive and bone health in animal models of aging.
In rodents,
Haider et al.
26
found that a 1-week intraperitoneal administration of 300 mg/ml/kg bw/day body weight (bw) of
Previous studies have focused on the effects of physical exercise on the BDNF level
16
or expressions
28,29
in hippocampus of
To our knowledge, there was a lack of stereological research on the effects of physical exercise on the number of osteoclasts or osteoblasts, particularly of the femoral head, of
Materials and Methods
Animals and treatments
Twenty-four male Wistar rats 12 weeks of age (weighing 200–310 g) were used in the present study. The rats were obtained from the animal houses of Universitas Islam Indonesia, the Faculty of Pharmacy, and the Department of Pharmacology and Therapy, Faculty of Medicine, Universitas Gadjah Mada. They were maintained under natural 12-h light–12-h dark cycle and had ad libitum access to water and food. The experimental procedure and animal handling were approved by The Ethics Committee of the Faculty of Medicine, Universitas Gadjah Mada (approval No. KE/38/01/2017; for experiments on cerebellum and behavior), and Integrated Research and Testing Laboratory (approval No. 00007/04/LPPT/lll/2017; for experiments on femoral bones).
At the outset of the experiment, the rats were randomly divided into four groups, each of which consisted of six rats. The normal control (C) group was injected with normal saline (0.9% NaCl) intraperitoneally. Other rats were treated with intraperitoneal injections of 300 mg/(mL·kg) bw of
Exercise training protocol
Following 4 weeks of
where the inclination was a slope of 0° and it is equal to “1” in the equation. The
Subsequently, for the next 4 weeks, the GAL-LE group had to run at an intensity of exercise of 45% of
Open field test
Twenty-four hours after the last day of exercise, the rats were examined in the open field test. This test assesses the locomotor activity and cerebellar function of rats. The protocol of this test was based on that of other studies 19,27 with slight modifications. The open field apparatus consisted of a 100 × 100 cm plywood arena, which was surrounded by 50-cm-high wooden and glass walls. The floor of the open field was divided into 16 identical squares. A video camera connected to a laptop computer was mounted 200 cm above the open field to record the movements of the animals. One hour before the test, the rats were brought into the test room. Any randomly selected rat was gently placed on the northeast corner of the field and the movements of the rat were recorded for 5 minutes. The number of horizontal (crossings) and vertical (rearings) activities were counted to measure the general locomotor and exploratory behavior of the rat. After each trial, the open field was cleaned with 70% ethanol to remove any odor clues of the test rats.
Rotarod test
The rotarod test was performed to assess the balance, motor coordination, and motor control of rats. The test was conducted once the rats finished the open field test. The protocol and apparatus (model 7700; Ugo Basile) of this test were referred to that described in previous studies. 39
Any given rat was placed on the stationary running surface of the rotarod for 1 minute for habituation. The rat was then removed from the rotarod. The rotarod was set to rotate at a speed of 16 rpm and the rat was replaced back on the running surface with its head facing the direction opposite to the direction of rotation of the surface. Therefore, the rat had to walk forward to maintain its position. A stopwatch was turned on at the start of the placement of the rat on the running surface. Each trial lasted for 180 seconds. When the rat fell, it was immediately placed back onto the running surface. The number of falls during these 3 consecutive minutes was recorded. The stopwatch was paused when the rat fell and was started again when it was returned to the running surface.
Tissue preparation
Approximately 24 hours after the rotarod test, the rats were euthanized under deep anesthesia with 40 mg/kg bw of ketamine HCl (PT Guardian Pharmatama, Jakarta, Indonesia). One and a half milliliters of blood was obtained from the orbital sinus of the rats. The blood was incubated for 1 hour at room temperature before centrifugation at 2000 g for 15 minutes at 4°C. The blood serum was collected and stored at −80°C in a freezer. The cerebellum of the rats were removed from their skulls and stored at −80°C in a freezer before homogenization.
Right femoral bones of the rats were also taken and cleaned from the surrounding muscles. The bones were washed using Aqua Dest and 0.9% NaCl solution, weighed, and immersed in 10% formaldehyde in phosphate-buffered solution for 24 hours. The bone specimens were coded and thus the observer was not aware of which group any given specimens originated from.
Cerebellar and serum tissue examination
Twenty milligrams of each cerebellar tissue sample was homogenized in a glass tube containing 600 μL of PRO PREP™ (Intron Biotechnology) surrounded by ice. The homogenates were incubated for 30 minutes and centrifuged at 12,000 rpm for 15 minutes. The supernatant of these homogenates was used for the determination of the cerebellar IGF-1 and BNDF concentration. The levels of IGF-1 and BDNF of both serum and cerebellum were determined using rat IGF-1 and BDNF Enzyme-Linked Immunosorbent Assay (ELISA) Kits (Elabscience) according to the manufacturer's instruction in a Bio-Rad microplate reader (Benchmark) operated at a wavelength of 450 nm.
Histological procedure
The femoral bones were decalcified using EDTA solution (pH 7) and stored in a 37°C storage for approximately 3–4 weeks. Once the bones became soft, the femoral heads of the bones were isolated from the rest of the femur. The head tissues were subsequently dehydrated in ethanol of graded concentrations, cleared in toluene solution, infiltrated, and eventually embedded in paraffin blocks.
Paraffin blocks containing the tissues were cut using a rotary microtome (Leica RM 2235; Biosystems Nussloch, GmbH) at a nominal thickness of 4 μm. A number between 1 and 50 was randomly selected to determine the first number of a pair of sections being sampled, and thereafter a section together with its adjacent section was taken for every 50 sections. The pairs of sections used for counting the number of osteoblasts were different from those used for osteoclasts, and therefore there were two sets of pairs of sections from each animal. This strategy yielded approximately between 6 and 10 pairs of sections per set, per animal. The sections were mounted on glass slides, dried on a hot plate for the next 24 hours, and deparaffinized using xylol and ethanol. The sections prepared for the counting of osteoblasts were stained using Hematoxylin and Eosin, whereas those for osteoclasts were stained using TRAP (Tartrate-Resistant Acid Phosphatase).
Stereological analyses
Unbiased stereological methods were applied in the estimation of the volume of the femoral head and the total number of osteoblasts and osteoclasts. The volume of the femoral head was calculated using Cavalieri method.
40
The sections were viewed under an Olympus CX21FSI light microscope (Olympus Singapore PTE, Ltd.) at 40 × magnification. Pictures of parts of the femoral head sections (one section from each pair of sections of an animal) were taken and collated into montages of complete images of femoral head using Adobe Photoshop CS6 software. A virtual grid consisting of points spaced regularly at a distance of 63,000 μm (120 × magnification) between points was made using ImageJ software and superimposed on the montages (Fig. 1). The number of points (P) falling on each montage was counted, and the total number of points (ΣP) for each rat was calculated by summing up all points of all montages of each rat. The range of the total number of points of all subjects was between 100 and 189 points. The volume of the femoral head of each rat was estimated using the following formula
40
:

An example of point counting method on a section of femoral head bone. Any points falling on the bone were counted (“P”) and incorporated into the calculation of the volume of the femoral head using Cavalieri's principle. The complete explanation on the procedure is described in the Stereological analyses. Color images are available online.
where Vref is the volume estimate of femoral head (μm 3 ), T is the distance between disector pairs (μm), and a/p is the area width represented by each point (μm 2 ).
Upon staining with Hematoxylin and Eosin, the cytoplasm and nucleus of osteoblasts showed red and blue color, respectively. TRAP staining showed red color of osteoclasts within a green bone matrix. The counting of osteoblasts and osteoclasts was conducted using the microscope at 400 ×magnification. A systematic random sampling of fields of view was performed in a raster fashion. One out of every 10 fields of view was sampled for osteoblast counting, whereas 1 out of every 5 fields was sampled for osteoclast counting. This sampling method yielded ranges of 74–130 fields of view for osteoclast counting and 102–218 fields of view for osteoclast counting. These fields of view together with their corresponding area in the serial neighboring sections were photographed and printed on normal paper. A rectangular counting frame of 9900 × 143,000 μm (640 × magnification) was superimposed on the printed micrograph. The same frame was also superimposed on the corresponding area of the adjacent section micrograph. The frame consists of two solid lines serving as exclusion lines (left and bottom sides) and two dashed lines serving as inclusion lines (right and top sides) (Fig. 2). The counting of the cells followed the “forbidden line rule.”
41
The counting unit of osteoblasts was the nucleus, whereas the counting unit of osteoclasts was the cell body, since osteoclasts have multiple nuclei. Any osteoblast nuclear or osteoclast cell body profile that appeared in one section (“sampling section”), but not in the neighboring serial section (“look-up section”), was counted as long as it did not touch the exclusion lines or their extensions. To increase the efficiency of the counting, the pairs of section were used in turn. The previous sampling sections were now used as look-up sections, and vice versa. There were between 102–200 osteoblast and 101–131 osteoclast profiles, which were counted from each rat. The numerical densities (Nv) of the cells were estimated using the formula
42
:
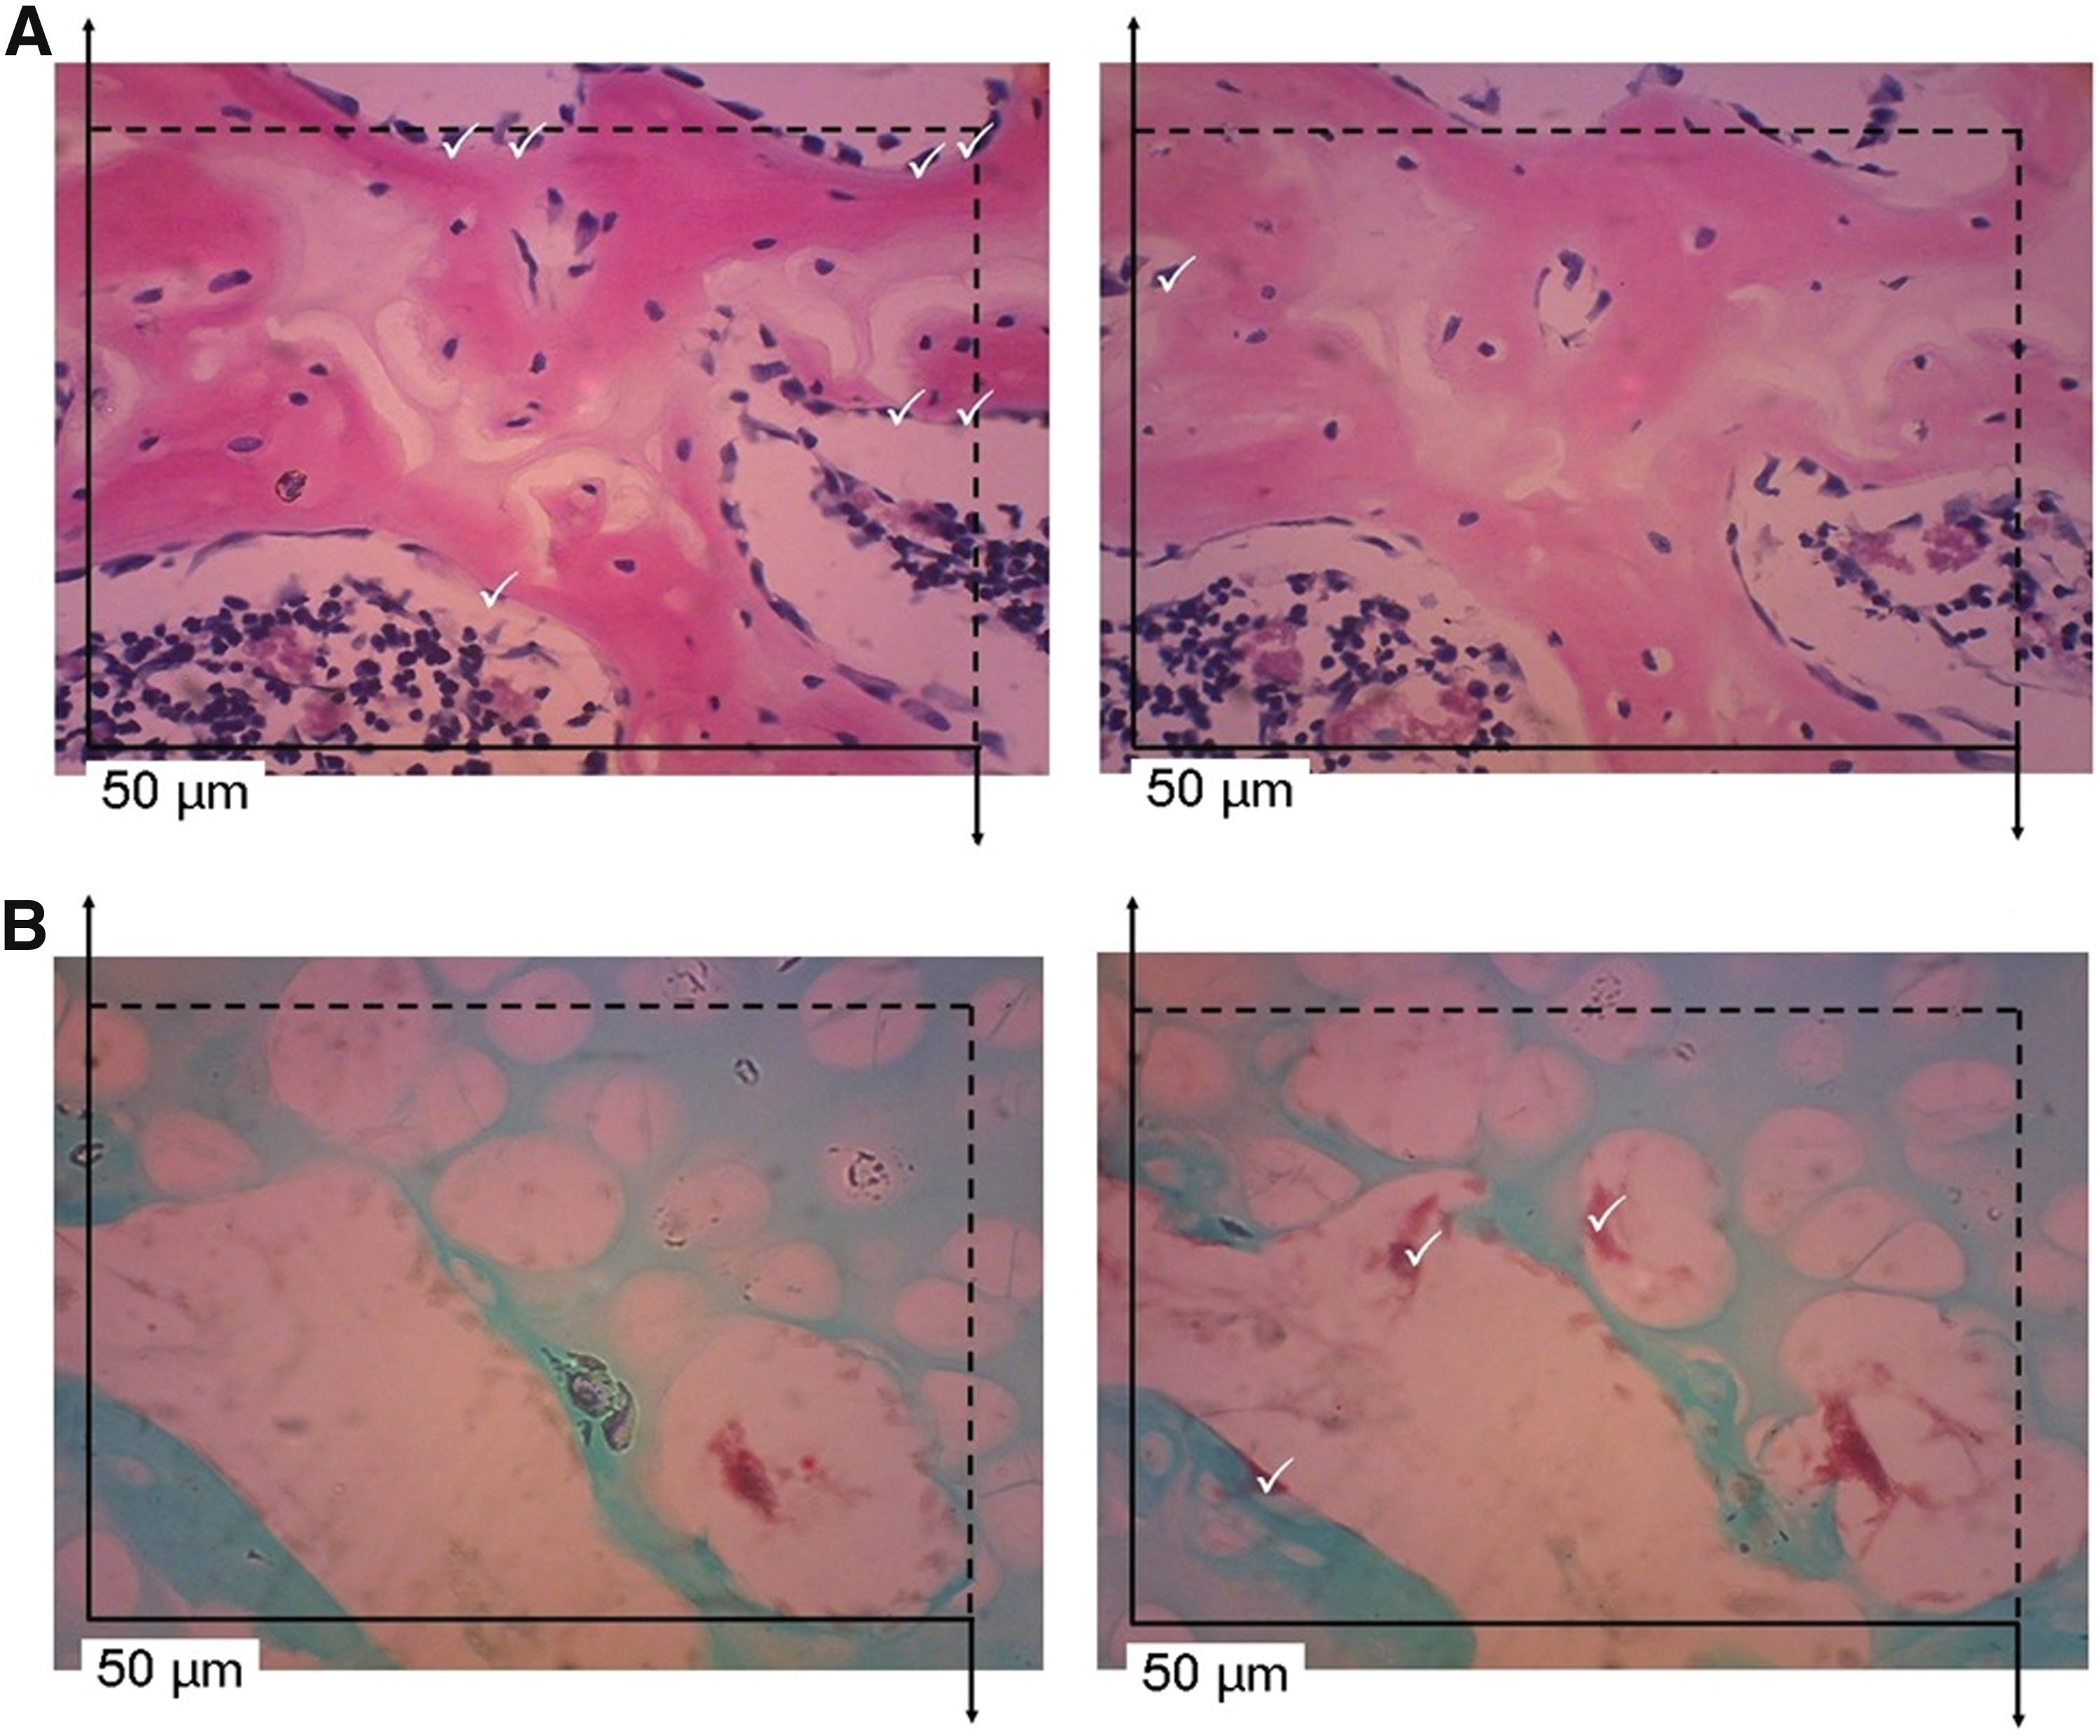
An example of the counting of osteoblasts
where ΣQ− is the total of cell profiles of each animal; “h” is the disector height, which was equal to section thickness (4 μm); and “a” is the total area of the counting frames of any given rat (μm 2 ).
The total number of osteoblasts and osteoclasts was finally estimated using the formula Nv × Vref. 42
Statistical analyses
Due to the multiple endpoints measured in this study, a resource equation was used for determining the sample size. A number of n = 5–10 animals per group was estimated to be adequate. Data of body weights and body weight gains during treatment of the rats were analyzed using one-way analysis of variance (ANOVA) procedure. The raw data of the number of falls in the rotarod test and the number of crossings in the open field test were not normally distributed and had some zero values. To fulfill the requirement for a parametric test and to avoid mathematical complications due to some values being zero, the data were transformed using the formula
39
:
where “x” is the number of falls in each trial of the rotarod test or number of crossings in the open field test; and X(t) is the transformed value of “x.” One-way ANOVA procedure was used to analyze the transformed data of the number of falls and the number of crossings, as well as cerebellar and serum IGF-1 and BDNF levels.
Data of the number of rearings in the open field test were also not normally distributed despite their transformation into square root data. Hence data were analyzed using the nonparametric Kruskal–Wallis procedure.
Data of volume, Nv of osteoblasts, as well as the estimated total number of osteoblasts and osteoclasts, were analyzed using one-way ANOVA procedure. Data of Nv of osteoclasts did not pass the normality test despite being transformed, and therefore the data were analyzed using Kruskal–Wallis procedure. The coefficient of error (CE) and coefficient of variance (CV) of the data of the volume of femoral head as well as the number of osteoblasts and osteoclasts were calculated. The stereological procedure was considered efficient if the value of CEtotal 2 /CVtotal 2 is between 0.2 and 0.5 42
Pearson correlation test was used to examine the correlation between the bone and cerebellar parameters, except the correlation between the number of osteoblasts or osteoclasts and number of rearings. The correlations between these latter parameters were assessed using Spearman correlation test due to the failure of the number of rearing data in the normality test. All statistical analyses were performed using SPSS version 23.0 software. The significance levels were set at p < 0.05. Post hoc least significant difference (LSD) or Mann–Whitney tests were performed wherever necessary.
Results
Table 1 presents the data of the body weights of the rats of all groups. One-way ANOVA of the body weight data before treatment revealed no significant main effect of groups. On the other hand, one-way ANOVA of the body weight data after treatment revealed a significant main effect of group. Post hoc LSD analysis of the body weight data after treatment showed that the body weight of the
Mean ± Standard Error of Mean of Body Weight of All Rats Before and After Treatment
p = 0.001; b p = 0.003.
ANOVA, analysis of variance; bw, body weight; C, 0.9% NaCl intraperitoneal (ip); df, degree of freedom; GAL, 300 mg/(mL·kg) bw
Data of the results of behavioral tests are presented in Table 2. At a glance, the number of crossings and rearings appeared lower in the galactose-treated group than the other groups. However, one-way ANOVA of the number of falls in the rotarod and number of crossings in the open field revealed no significant main effect of groups. The Kruskal–Wallis test of the number of rearings in the open field also showed no significant difference between groups (Table 2).
Mean ± Standard Error of Mean of Number of Falls in the Rotarod; As Well As Number of Crossings and Number of Rearing in the Open Field of Rats
n, number of animals.
See footnote of Table 1 for detailed description of the groups.
Table 3 shows the data of cerebellar and serum BDNF and IGF-1 levels. One-way ANOVA of these data revealed no significant main effect of groups in the cerebellar and serum BDNF and IGF-1 levels.
Mean ± Standard Error of Mean of the Levels of Insulin-like Growth Factor 1 and Brain-Derived Neurotrophic Factor in the Cerebellum and Serum of Rats (pg/mL)
BDNF, brain-derived neurotrophic factor; IGF-1, insulin-like growth factor 1; n, number of animals.
See footnote of Table 1 for detailed description of the groups.
Data of the volume of femoral head as well as the Nvs of osteoblasts and osteoclasts are presented in Table 4. The Kruskal–Wallis test of the volume data demonstrated no significant difference between groups. The CEtotal 2 /CVtotal 2 of the data was <0.2, which indicates that the sampling scheme of the stereological procedure is sufficient, but requires a more efficient way in future studies. One-way ANOVA of the data of Nv of osteoblasts also showed no significant main effect of groups. On the other hand, the Kruskal–Wallis test of the Nv of osteoclasts revealed a significant main effect of groups. Post hoc Mann–Whitney of these data showed that the numerical density of osteoclasts of GAL-ME group was significantly lower than that of the GAL and GAL-LE groups (p = 0.006).
Mean ± Standard Deviation of the Volume of Femoral Head and Numerical Density of Osteoblasts and Osteoclasts ( × 10−5 )
p = 0.006; b p = 0.006.
CE, coefficient of error; CV, coefficient of variance; CVbiol, biological coefficient of variation; CVtotal, total coefficient of variation; n, number of animals;.
See footnote of Table 1 for detailed description of the groups.
Figures 3 and 4 present the dot plot diagram of the number of osteoblasts and osteoclasts, respectively. One-way ANOVA of the data of the number of osteoblasts showed no significant main effect of groups. On the other hand, one-way ANOVA of the data of the number of osteoclasts showed a significant main effect of groups. Post hoc LSD test of these data revealed that the estimated total number of osteoclasts was significantly higher in the GAL group than that of the C (p = 0.037) and GAL-ME (p = 0.017) groups. The sampling procedure of both sets of data was sufficient (CEtotal 2 /CVtotal 2 <0.2) (Table 5). 43,44 The correlation analyses showed no significant correlation between any bone and cerebellar or behavioral parameters (Table 6).
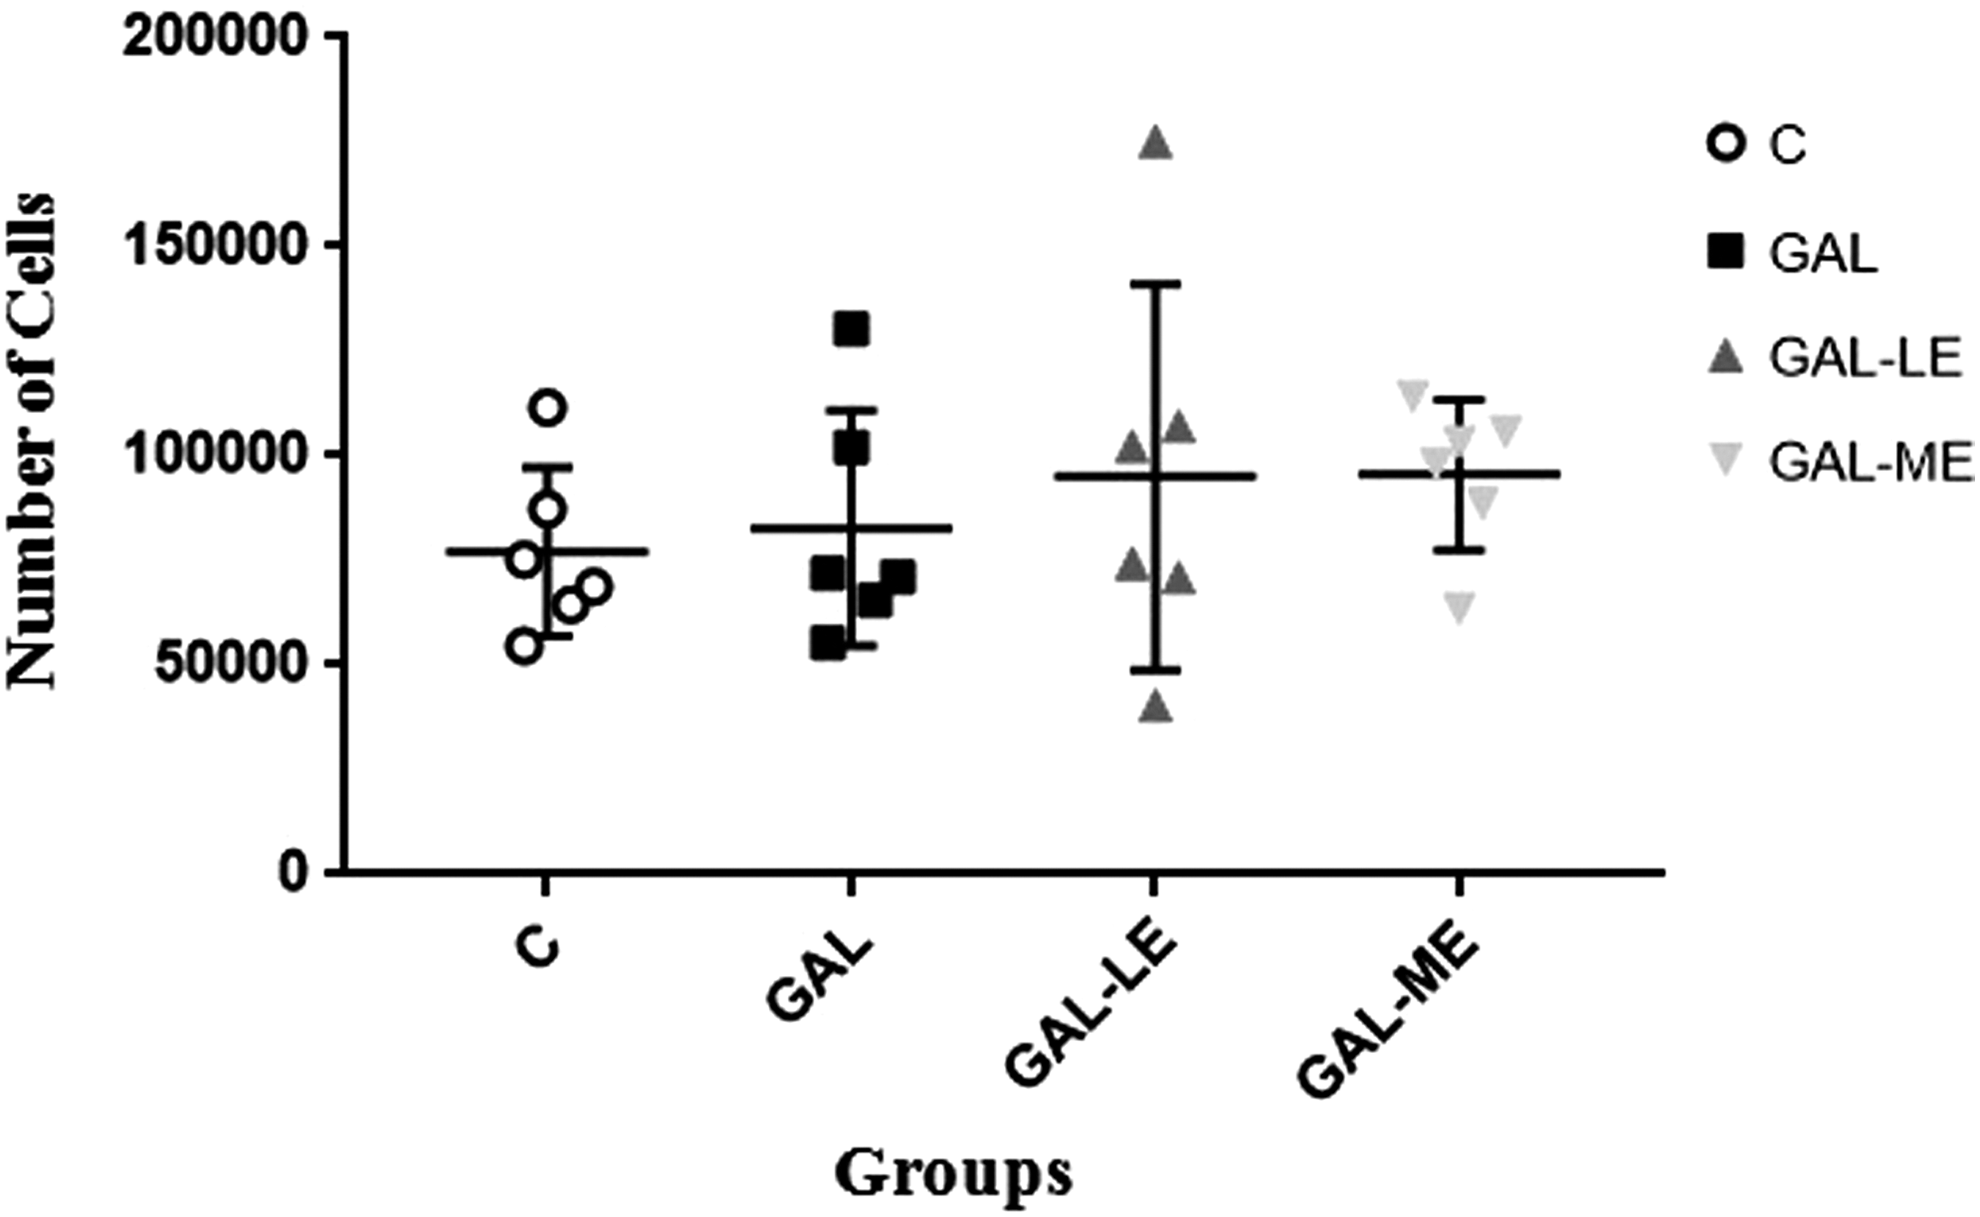
The mean ± standard deviation of the number of osteoblasts of all groups of rats. The data were analyzed using one-way ANOVA procedure (df = 3, 20; F = 0.249; p = 0.861). See footnote of Table 1 for detailed description of the groups. ANOVA, analysis of variance.
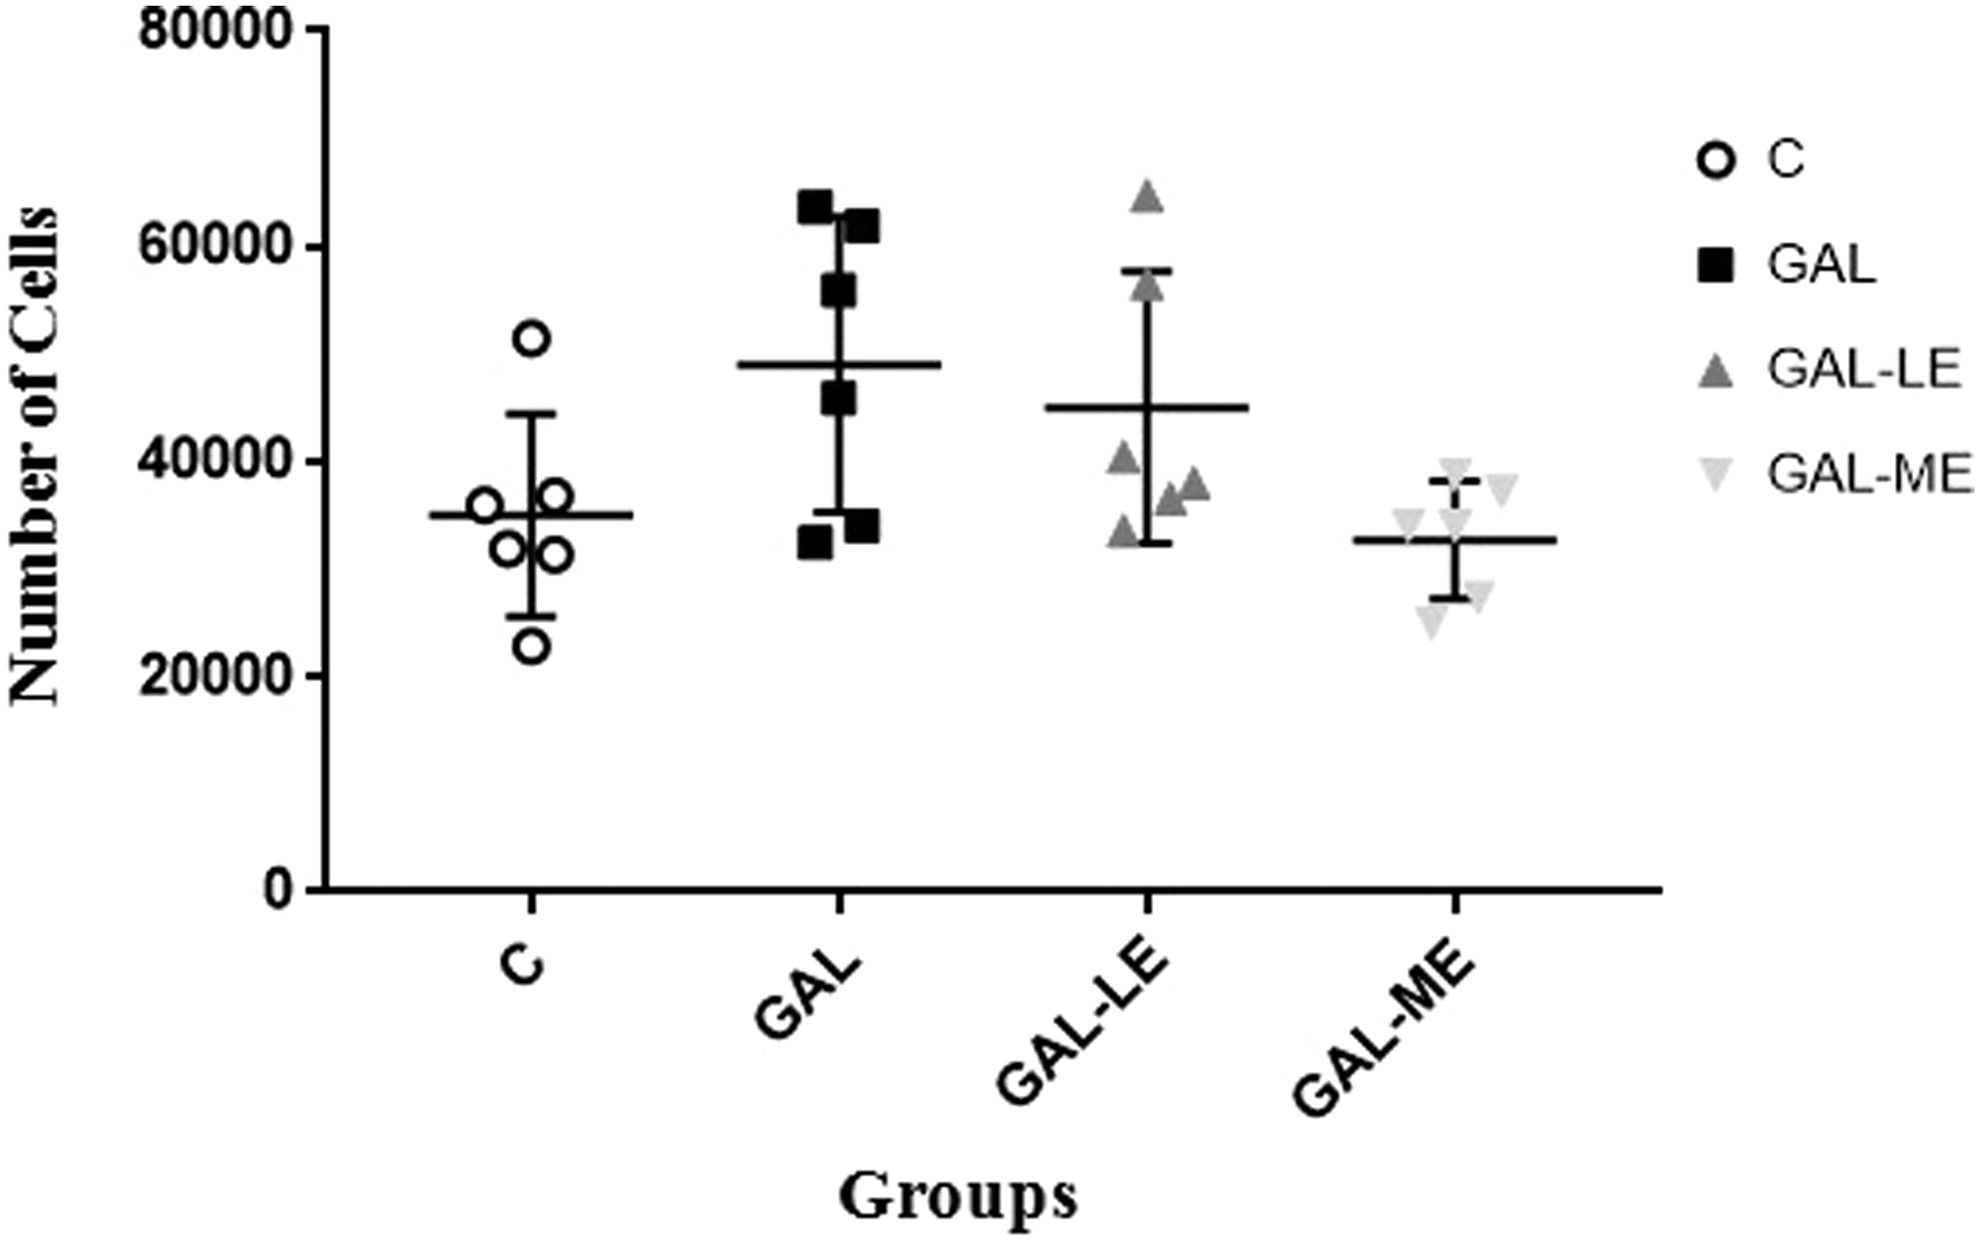
The mean ± standard deviation of the number of osteoclasts of all groups of rats. The data were analyzed using one-way ANOVA procedure (df = 3, 20: F = 3.146: p = 0.048). See footnote of Table 1 for detailed description of the groups.
Coefficient of Variation and Coefficient of Error of the Total Number of Osteoclasts and Osteoblasts of Rats
n, number of animals.
See footnote of Table 1 for detailed description of the groups.
The Correlations Between the Number of Osteoclasts or Osteoblasts and the Brain-Derived Neurotrophic Factor, Insulin-like Growth Factor 1, or Behavioral Parameters of Rats
Pearson correlation coefficient.
Spearman's rank correlation coefficient.
(+), positive correlation; (−), negative correlation.
Discussion
The main finding of the present study was that
The finding in the present study that the body weight of
To the best of our knowledge, there is a lack of stereological studies on the effects of exercise on the estimated total number of osteoclasts and osteoblasts in
The present study demonstrates that there was no change of the total number of osteoblasts following
Two studies on mice models of osteoporosis reported that an intermittent 4 week of treadmill exercise combined with ethanolic extract of Spilanthes acmella 61 or an intermittent 6-week program of swimming 62 increased the average number of osteoblasts following dexamethasone exposure 61 or during the perimenopause period. 62 However, caution should be exercised in interpreting the results of these studies, since they estimated the average number of osteoblasts in five fields of view per animal. Such density estimates are not an appropriate surrogate measure of the total number of osteoblasts, since it is subject to changes of the volume of reference space (bone). 24,25
The absence of the increase of the number of osteoblasts following exercise in the present study might be due to the relatively short duration and small direct mechanical load of muscles on the femoral head. Of note, the effects of physical exercise on bone are determined by the intensity, duration, and type of the exercise. 63 It has been found that a 12-week routine treadmill exercise enhanced bone mass of ovariectomized rats. 64 Other studies also reported that long-term moderate exercise preserves bone mass by increasing bone formation. 31 Such an increase may indicate an enhancement of the number of osteoblasts. However, an unbiased stereological study is required to confirm or refute this finding.
The negative findings in the effects of
In addition, a possible time-, dose-, or sex-dependent manner of paradoxical behavioral responses of rodents toward
The dose and route of administration of
To summarize, moderate-intensity, but not low-intensity, exercise may return the
Footnotes
Acknowledgments
This research was funded by a Research Grant of Public Funding of Universitas Gadjah Mada (No. UPPM/221/M/05/04/05.17). The results reported in the present study were parts of Nisa Karima and Kurnia Putri Utami's thesis. The authors would like to thank Suparno and Dwi Kurniawati (Department of Physiology, Faculty of Medicine, Universitas Gadjah Mada), Rina Susilowati and Sumaryati (Department of Histology, Faculty of Medicine, Universitas Gadjah Mada) for the consultation and technical assistances, as well as Erik C. Hookom (English Clinic) for language editing.
Author Disclosure Statement
No competing financial interests exist.