




Abstract
Introduction
Aging is a natural and inevitable physiological alterations characterized by a gradual decline in both cellular functions leading to oxidative stress and senescence and pathophysiological declines of most organs and metabolic homeostasis. 1,2 Particularly, there is a decline of the gastrointestinal system, 3 which definitely causes other diseases, consequently greatly influencing life quality.
Animal models have been normally and widely used to simulate pathological states related to human diseases under well-controlled experimental conditions.
4
Since the damage of
Metabolomics studies the metabolic responses of living systems to genetic and environmental stimuli, in particular small molecular weight metabolites and their changes in biological systems. 9 As the physiological product of the gastrointestinal tract, a fecal sample is one of the best biomaterials providing information of physiological changes of intestine. 10,11 Fecal metabolomics-based analysis indisputably constitutes a very useful approach to reveal the complicated and potential metabolic interactions of digestion and their absorption of the gastrointestinal system. Metabolite profiling obtained can bring in a series of information on gut diseases. 12 The obtained metabolite map can provide a series of information about intestinal diseases
The aim of this study was to assess the influences of
Materials and Methods
Materials and reagents
Animals and sample collection
Twelve 8-week-old male Sprague-Dawley rats (230 ± 10 g) were bought from the Experimental Animal Center of the Chinese Military Medical Sciences Academy (License number SCXK 2014-0013). The rats were housed in transparent rearing cages under standard conditions with room temperature (23°C ± 2°C), relative humidity (50% ± 10%), and a 12/12 hours light–dark cycle. The experimental rats were allowed free access to food and water. Then they were randomly placed into two groups, namely, the negative control (n = 6) and the aging model group (n = 6). Rats in the aging model group were daily subcutaneously injected with
The gastrointestinal transit trial
The gastrointestinal transit trial was conducted to test the defecation ability of the experimental rats. 13 Specifically, all rats were fasted overnight at the 0th, 9th, and 11th week, and in the next morning, all rats were gavaged with 1 mL of self-configured ink (containing 5% activated carbon powder and 10% Arabic gum) as the indicator. Each rat was separately placed in a metabolic cage with compartments, as well as water and foods were freely available. The time from the beginning of providing rats with self-configured ink to the first defecation of black feces of each rat was recorded.
Gastric and small intestinal movement trials
Semisolid nutritional paste was given to rats so that gastric emptying rates and gastrointestinal ink push rates could be measured at the same time. Rats were given a semisolid nutrient paste containing activated carbon (1 mL/100 g). After 30 minutes, all the animals were humanely sacrificed. The gastric cardia and gastric pylorus were immediately ligated. The whole stomach was removed and the total gastric weight (X) was obtained. After gastric contents were washed and the filter paper dries the water on the stomach surface, the net gastric weight (Y) was measured. The residue amount of semisolid nutritional paste in the stomach was calculated according to Formula A. The intestinal transport distance was determined by measuring the migration distance of black charcoal in the small intestine (from the pylorus to the cecum). The gastrointestinal ink push rates were calculated using Formula B.
13,14
where X and Y are the total gastric weight and the net weight of stomach, respectively, and Z is the weight of the semisolid nutrient paste.
Biochemistry assays
The levels of SOD, MDA, and CAT in serum samples were measured according to instructions of manufacturers through commercial kits.
Fecal metabolomics analysis
Fecal sample collection and preparation
Fecal metabolites were extracted as described with minor modifications. 15 In brief, fecal extraction was performed on ice, individually, by adding 1000 μL PBS buffer into 100 mg thawed fecal samples. After vortex for 30 seconds, the mixed slurry was dealt with ultrasonication cycles for 10 minutes. The ultrasound treatment was performed in an ice bath with an interval of 10 seconds for every 10 seconds of ultrasound. Afterward, vortex mixing was carried out again. The vortex samples were centrifuged for 15 minutes (4°C, 13,000 g). In total, 100 μL of D2O containing 0.01% (w/v) TSP, which provides a field lock for the NMR and as chemical shift reference, was added into 500 μL supernatant. The sample solutions were transferred to NMR tubes with a 5 mm outer diameter for further analysis.
1 H NMR acquisition
1 H NMR spectra of the feces were measured by a Bruker Avance 600 MHz NMR spectrometer (Bruker, Germany) at a 1 H frequency of 600.13 MHz and a temperature of 25°C. Carr–Purcell–Meiboom–Gill spin-echo pulse sequence was used to inhibit signals from proteins and lipids, thereby increasing the signal of small metabolites. 16 The acquisition parameters were as follows: acquisition time, 5 minutes; number of scans, 64; spectral size, 65,536 points; spectral width, 12019.2 Hz; pulse width, 14; and relaxation delay, 1.0 seconds.
1 H NMR data preprocessing and MVD analysis
The 1 H NMR spectra were phased and baseline corrected by the MestReNova software 8.1.0 (Santiago de Compostella, Spain). TSP (0.00 ppm) was calibrated. The region of 5.17–4.68 ppm was obliterated to eliminate the influences of water suppression. The spectra were integrated into 0.01 ppm bins for the whole region of 0.61–9.11 ppm. Subsequently, the total integrated area of the spectra was used to scale the remaining regions to compensate the concentration differences.
To identify variations in the fecal metabolic phenotypes induced by
Identification of potential biomarkers and construction of metabolic pathways
Resonance assignments were performed through referring to previous studies 17 –19 as well as with online databases including the Human Metabolome Data Base and the Biological Magnetic Resonance Data Bank, as well as our in-house databases. Metabolites were further screened by the variable importance for projection (VIP) values and the S-plot. In the S-plot, the further the distance away from the center, the stronger the contribution to separation is. Fecal metabolites that were exceeded the threshold of VIP values at 1.0 were regarded as potential biomarkers. As for the naming of metabolites, we provide not only the generic name of the metabolite, but also the InChi Key ID.
On the basis of MetaboAnalyst 4.0 platform, metabolomic pathway analysis (MetPA) was used to construct and analyze the metabolic pathways to visualize the global networks of fecal metabolism and to confirm the targeted pathways involved. The impact values >1.0 were filtered out as the most important metabolic pathways.
Correlation analysis
Furthermore, Pearson's correlation analysis was performed to classify two kinds of relationships. One was the correlations among different metabolites, biochemical results, and behavioral parameters. The other was the correlation analysis among the 25 differential metabolites. These correlation coefficient values are a statistical indicator of the degree of linear correlation between variables.
Statistical analysis
All data of behavioral and biochemical results are given as mean ± standard error. Two-tailed unpaired t-tests were applied to analyze significance of behavioral data and relative metabolites' concentrations between the control and the aging groups. The statistical analysis was performed by SPSS 25.0 software (IBM, NY). The broken line graphs, column bar graphs, and scatter plot were drawn using GraphPad Prism 7.0 (San Diego, CA). The value of p < 0.05 was considered statistically significant.
Results
No effects of d -gal on the body weight gains and food intakes of rats
Although treatment with
d -gal disturbed gastrointestinal motility and small intestinal motility of rats
The gastrointestinal transit trial and gastric and small intestinal movement trial were further performed to detect the defecation status of rats. There was no significant difference in the initial defecating time of the first black feces between the control group and aging group. After 9-week treatment of
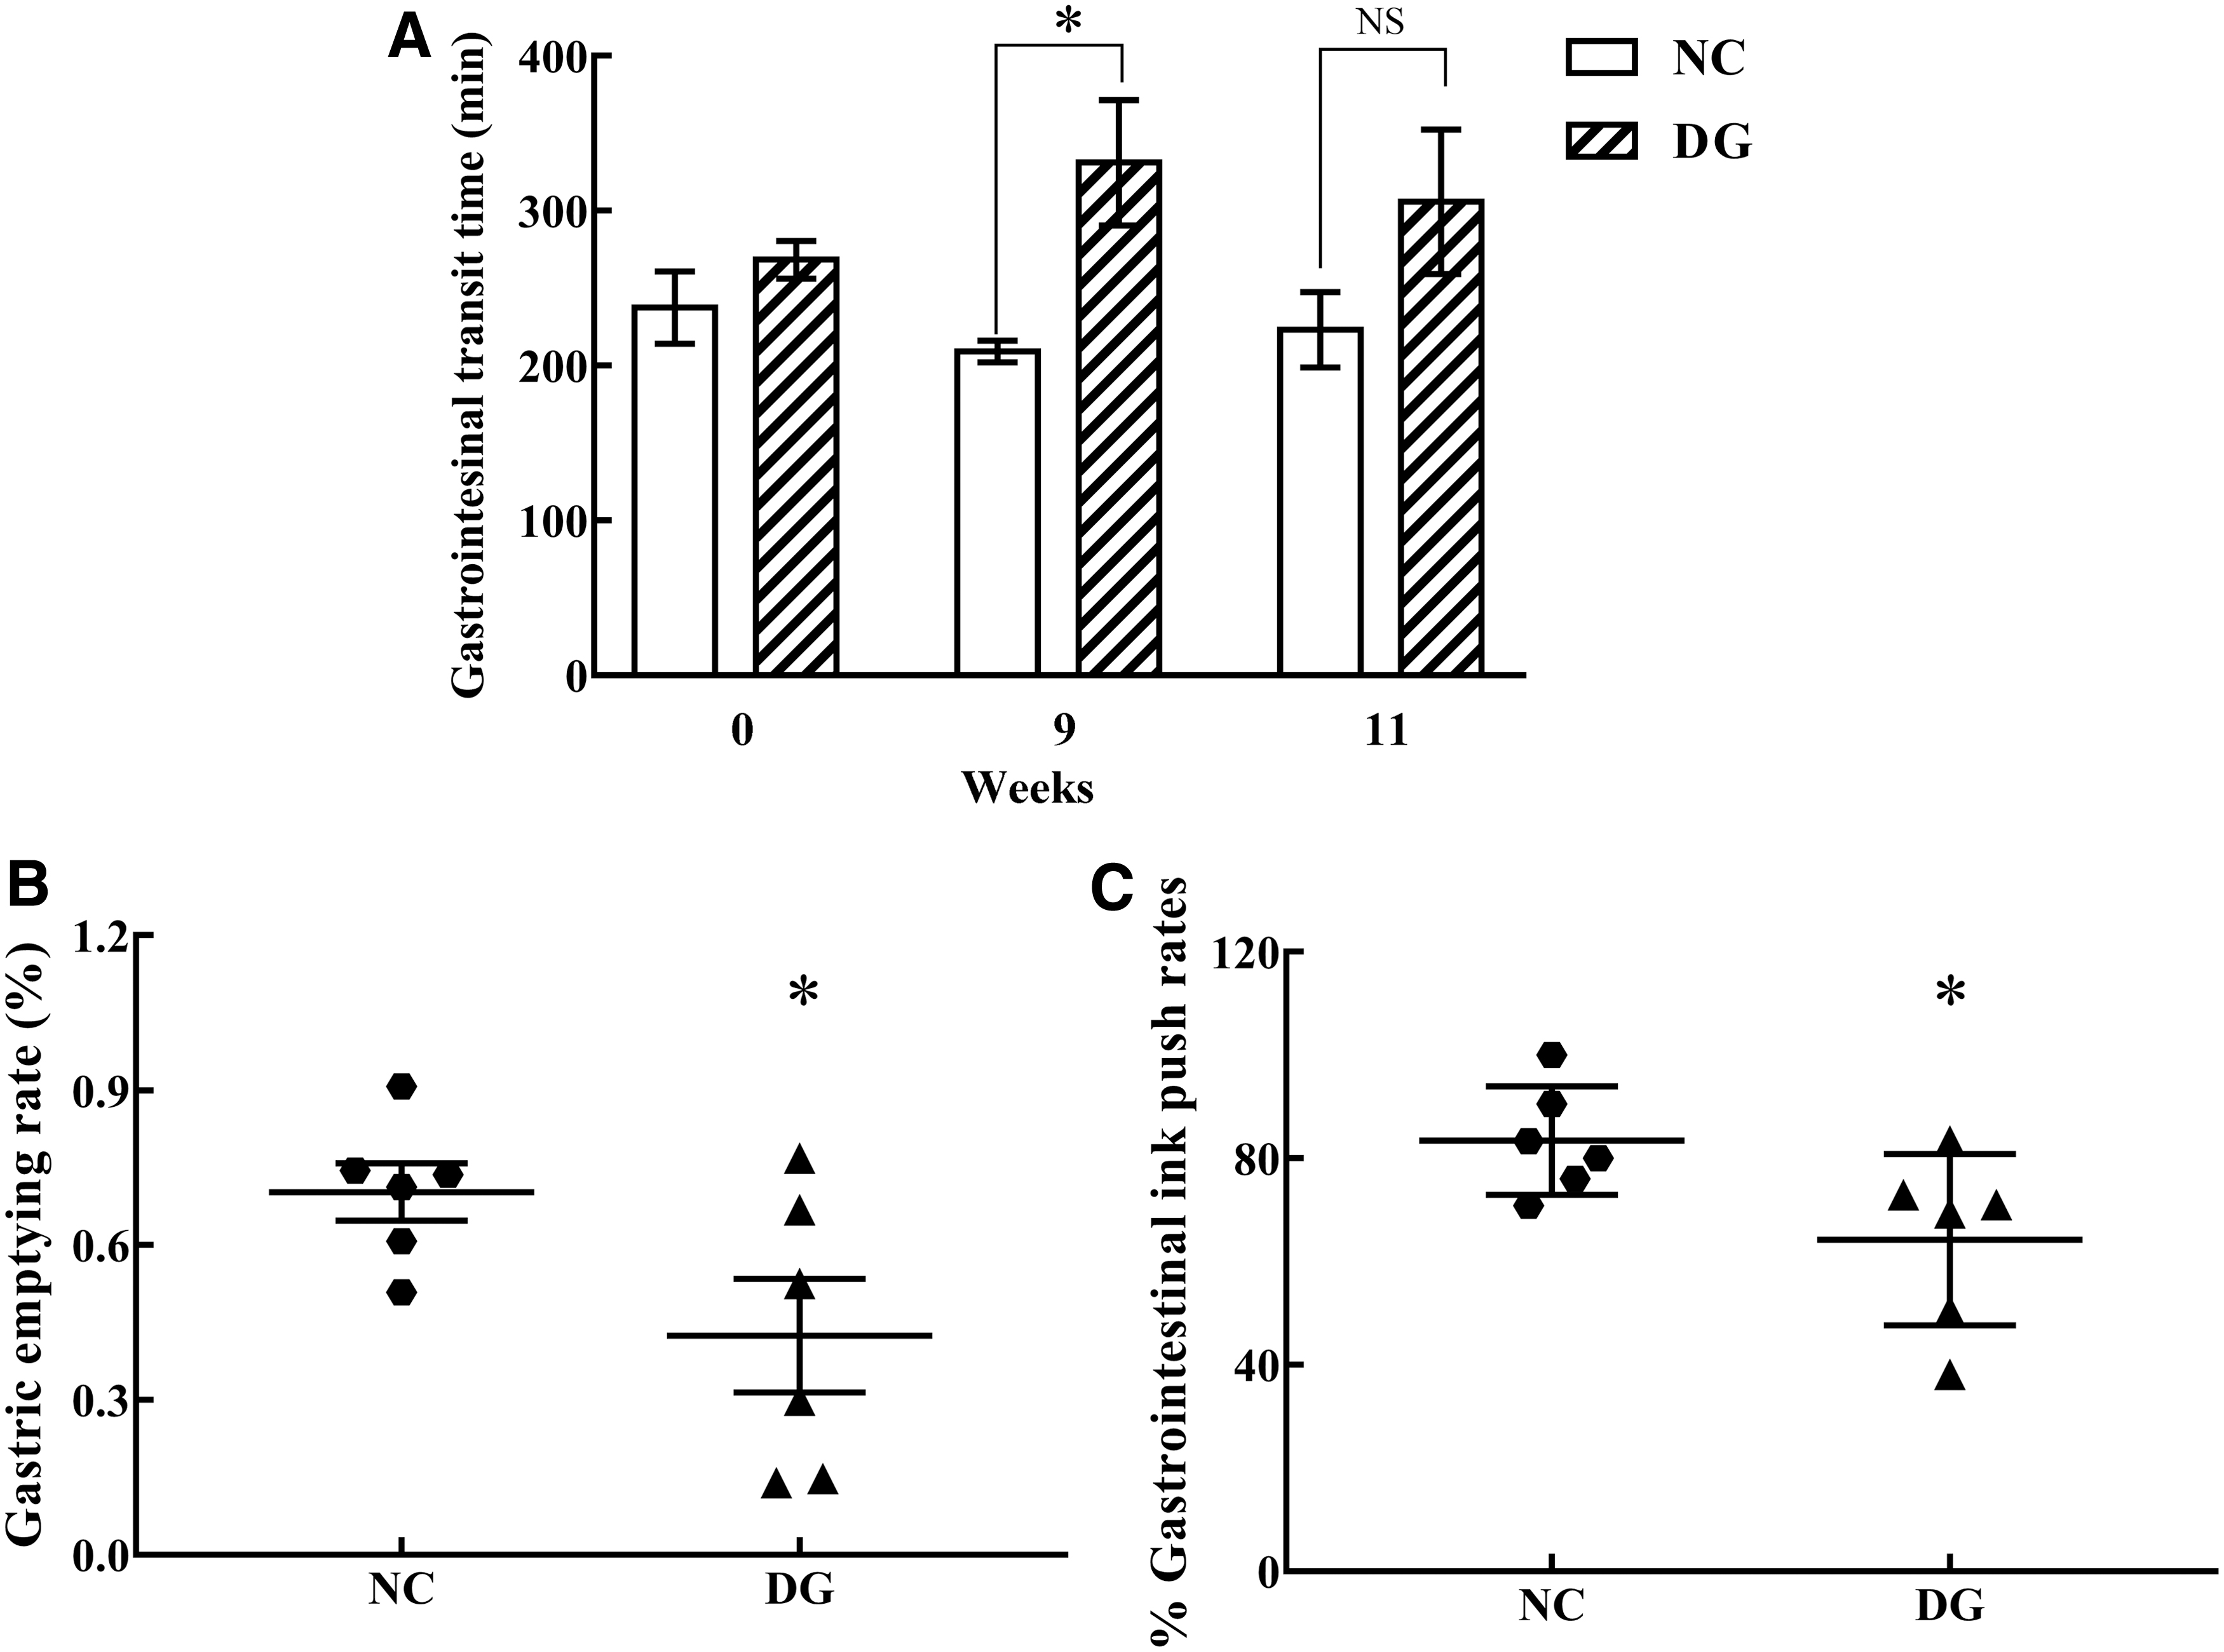
Defecation parameters were obtained from the control (NC) and aging groups (AG).
The gastric emptying rates of the aging group (42.5% ± 11.0%) were significantly smaller than that of the control group (70.3% ± 5.5%; p < 0.05) (Fig. 1B). The gastrointestinal ink push rates were distinctly shorter in the aging group (64.3 ± 6.8 minutes) than those of the control group (83.5% ± 4.3%; p < 0.05) (Fig. 1C). Taken together, the present results suggested that gastrointestinal motility and small intestinal motility of aging rats were significantly disturbed by
Biochemical index
To verify the level of oxidative stress injury in rats, we determined the contents of antioxidant enzymes (SOD, MDA, and CAT) in the serum samples. The activities of SOD and CAT were decreased in the serum of aging rats in comparison with those in control rats, whereas the opposite was true for the MDA level (Table 1). The underlying mechanisms of aging induced by
Biochemical Parameters in the Serum of the Control and Aging Groups (n = 6, Mean ± Standard Error)
p < 0.05, ** p < 0.01, compared with NC.
AG, aging group; CAT, catalase; MDA, malonyldialdehyde; NC, the control group; SOD, superoxide dismutase.
Metabolite assignments
A typical 1 H NMR spectra of feces labeled are shown in Figure 2. Overall, 40 metabolites were identified as shown in Table 1, which could be classified into organic acids, amino acids, intermediates of tricarboxylic acid (TCA) cycle, and some other metabolites.
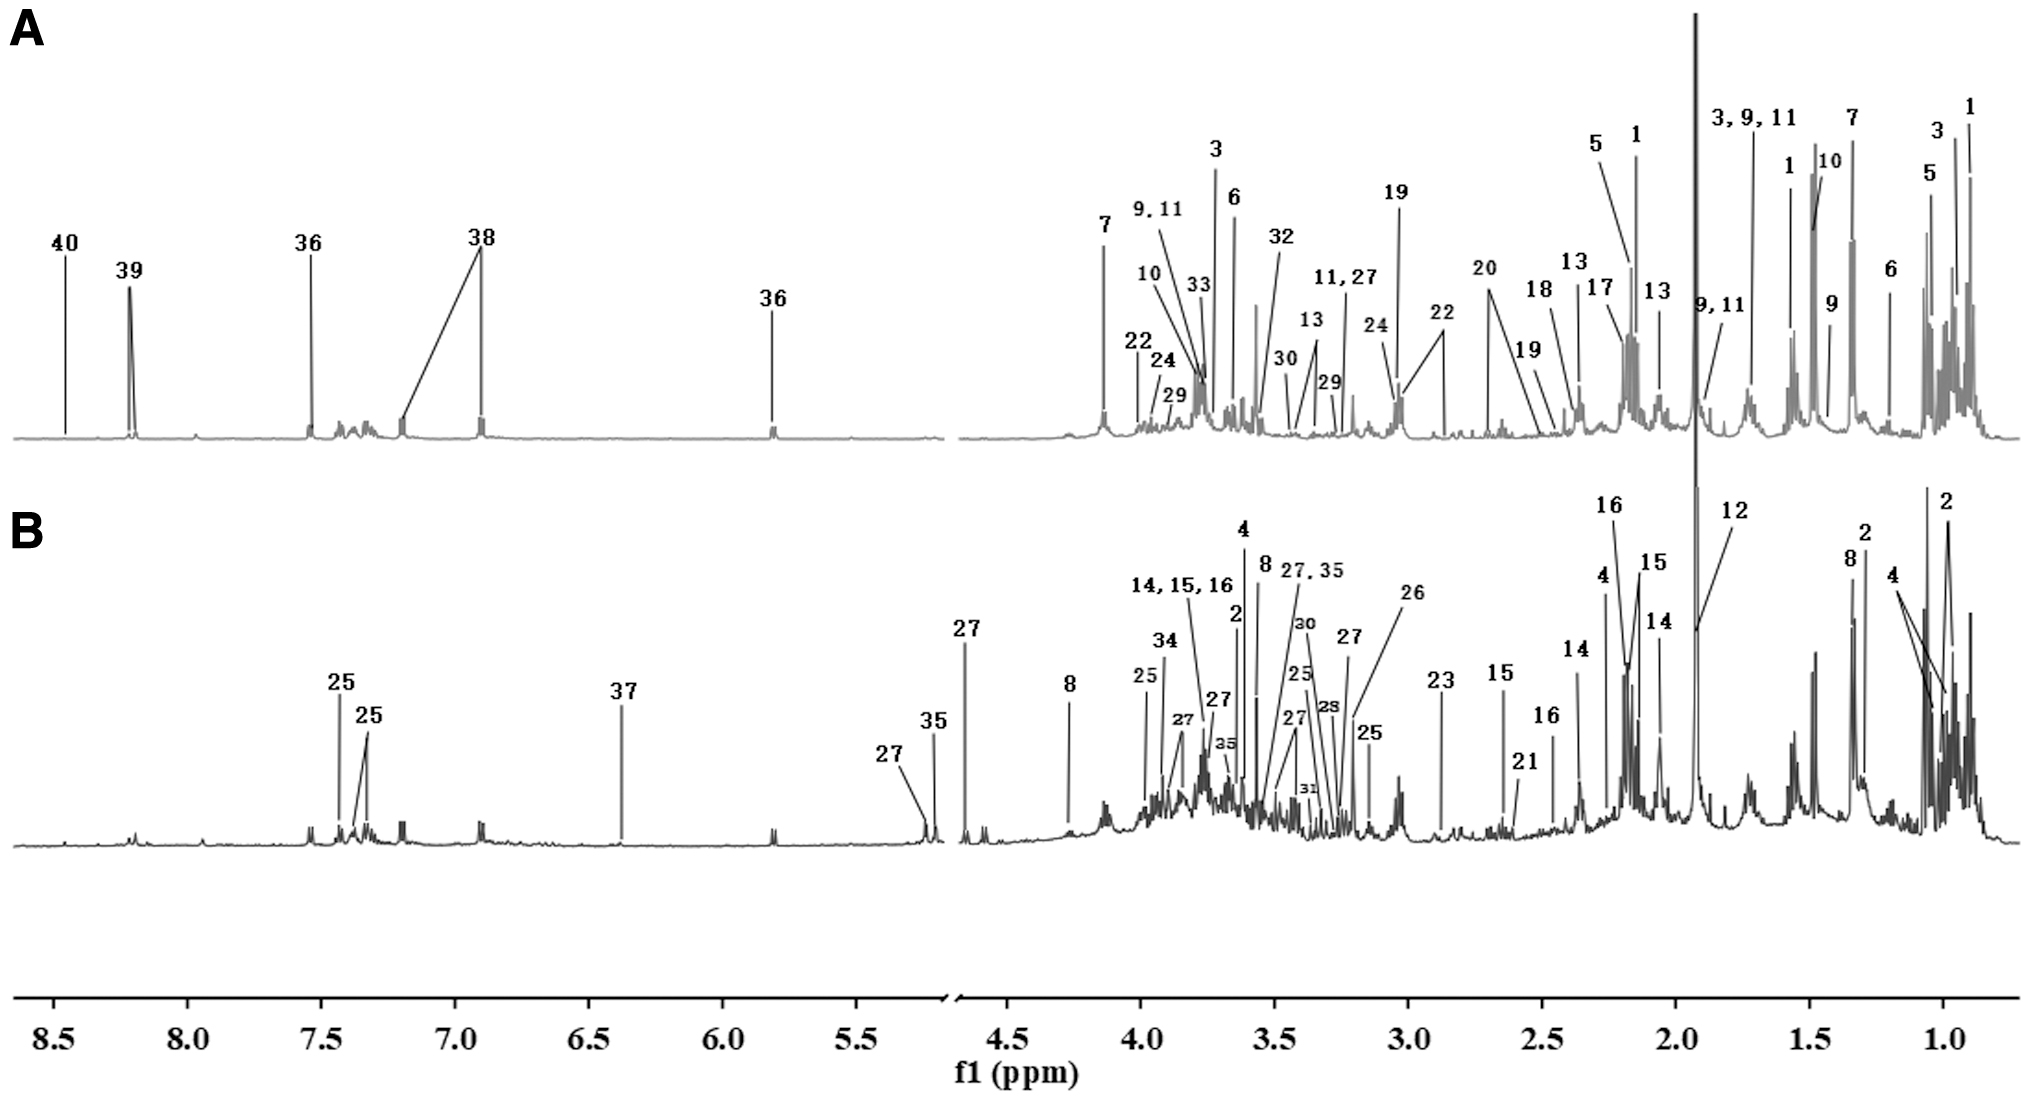
1 H NMR Assignments of Major Metabolites in Fecal Sample of Rats
s, singlet; t, triple; q, quartet; m, multiple b: trimethylamine-N-oxide.
TMAO, trimethylamine oxide.
MVD analysis
In the PCA score plot, the control group and the aging group were separated (Fig. 3A), indicating that
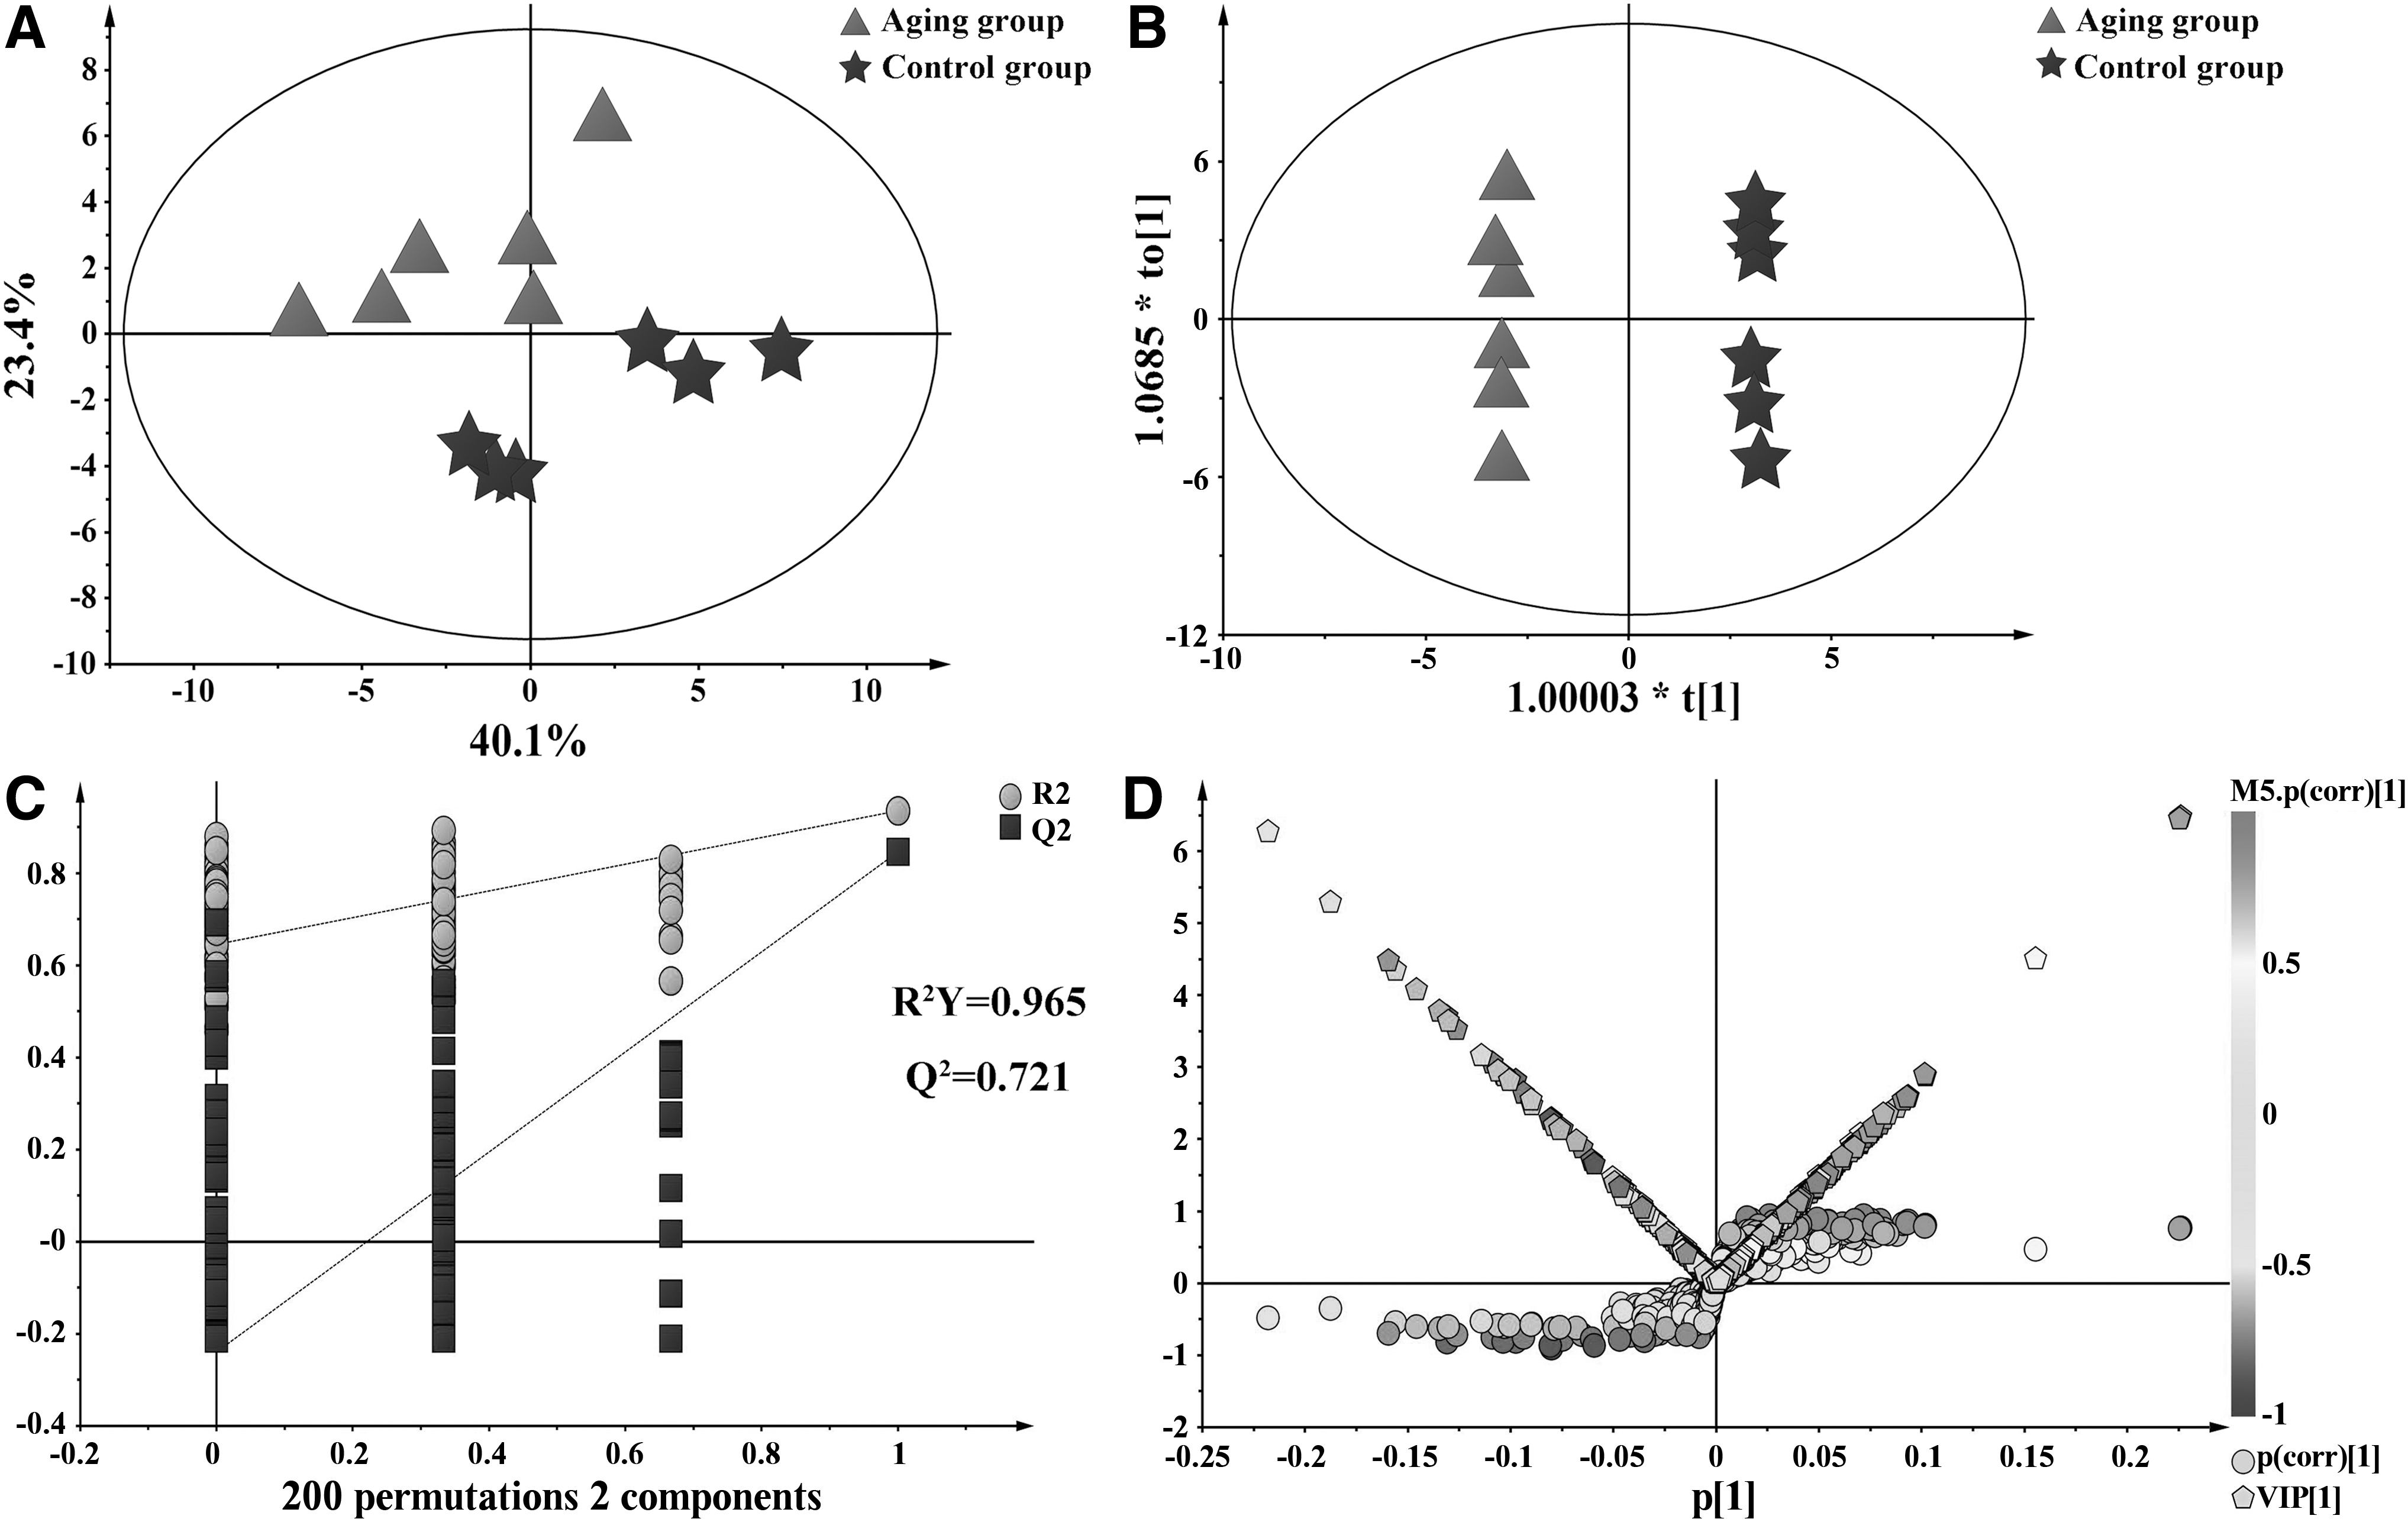
Multivariate data analysis of fecal
1
H NMR data.
A total of 25 differential biomarkers were screened by the values of the S-plot and the VIP, involving in 9 metabolic pathways (Fig. 4). Changes in the concentrations of differential biomarkers are detailed in Supplementary Figure S3.
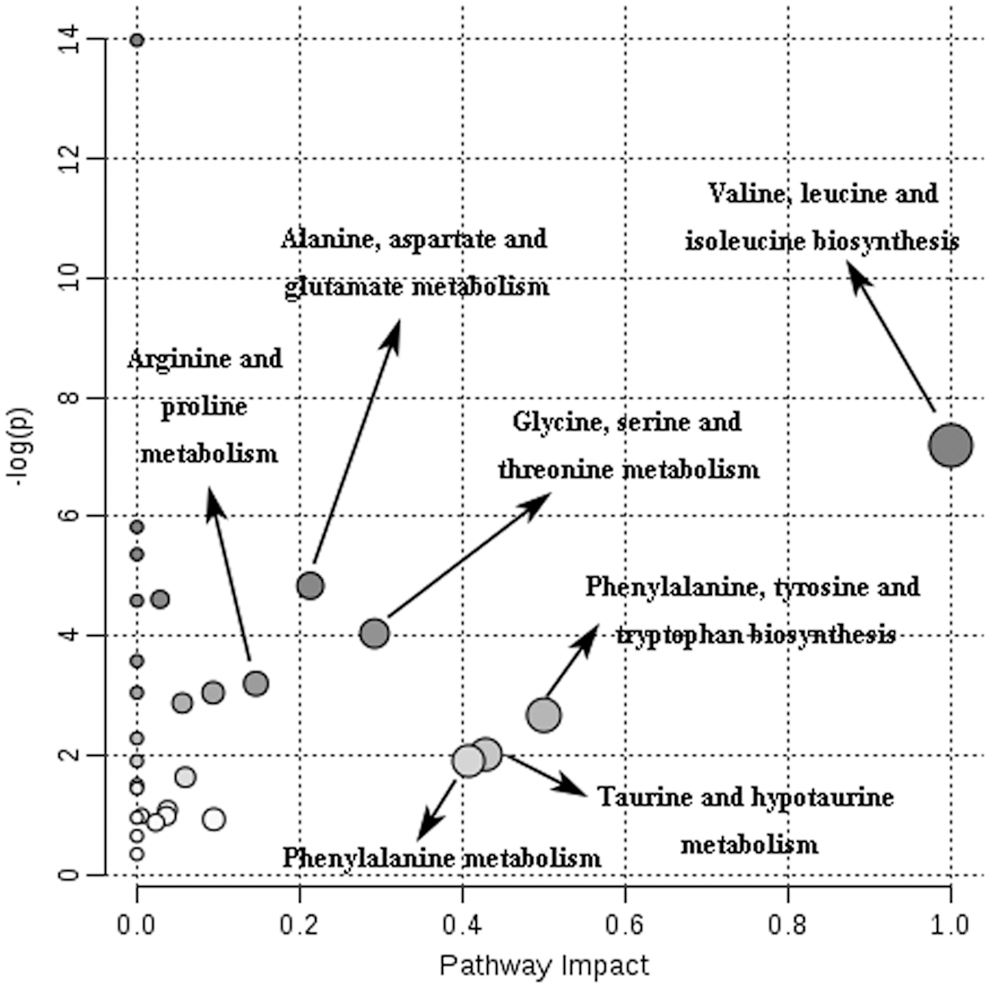
Schematic diagram of the pathway analysis of differential metabolites with MetPA. The sizes and colors of circles built on p-values and pathway impact values, respectively. The impact values >1.0 were filtered out as the most important metabolic pathways. MetPA, metabolomic pathway analysis.
Correlation analysis
To interpret the metabolic profiles based on the NMR, a correlation matrix based on Pearson's correlation analysis among biochemical and behavioral parameters was generated. Concerning the relationships among the metabolites, biochemical and behavioral parameters, the plot reveals a range of correlation coefficients ranging from 0.88 (maximum positive correlation) to −0.88 (maximum negative correlation), with 0 indicating no correlation. Besides sugars, phenylalanine, and butyrate, the remaining differential metabolites were significantly correlated with at least one oxidative stress biomarker (SOD, MDA, and CAT) (Fig. 5). There was no significant correlation among body weight gain and gastric emptying rate and 25 differential metabolites. The gastrointestinal ink push rates and gastrointestinal transit time, reflecting the ability of gastrointestinal motility, significantly correlated with the contents of six differential metabolites. Results showed that the main metabolic abnormalities caused by

Heatmap generated by Pearson's correlation analysis among differential metabolites, biochemical parameters (SOD, MDA, and CAT), and behavioral parameters (body weight gain, gastrointestinal transit time, gastrointestinal ink push rate, gastric emptying rate, crossing time, incubation period). * Means p < 0.05. CAT, catalase; MDA, malonyldialdehyde; SOD, superoxide dismutase.
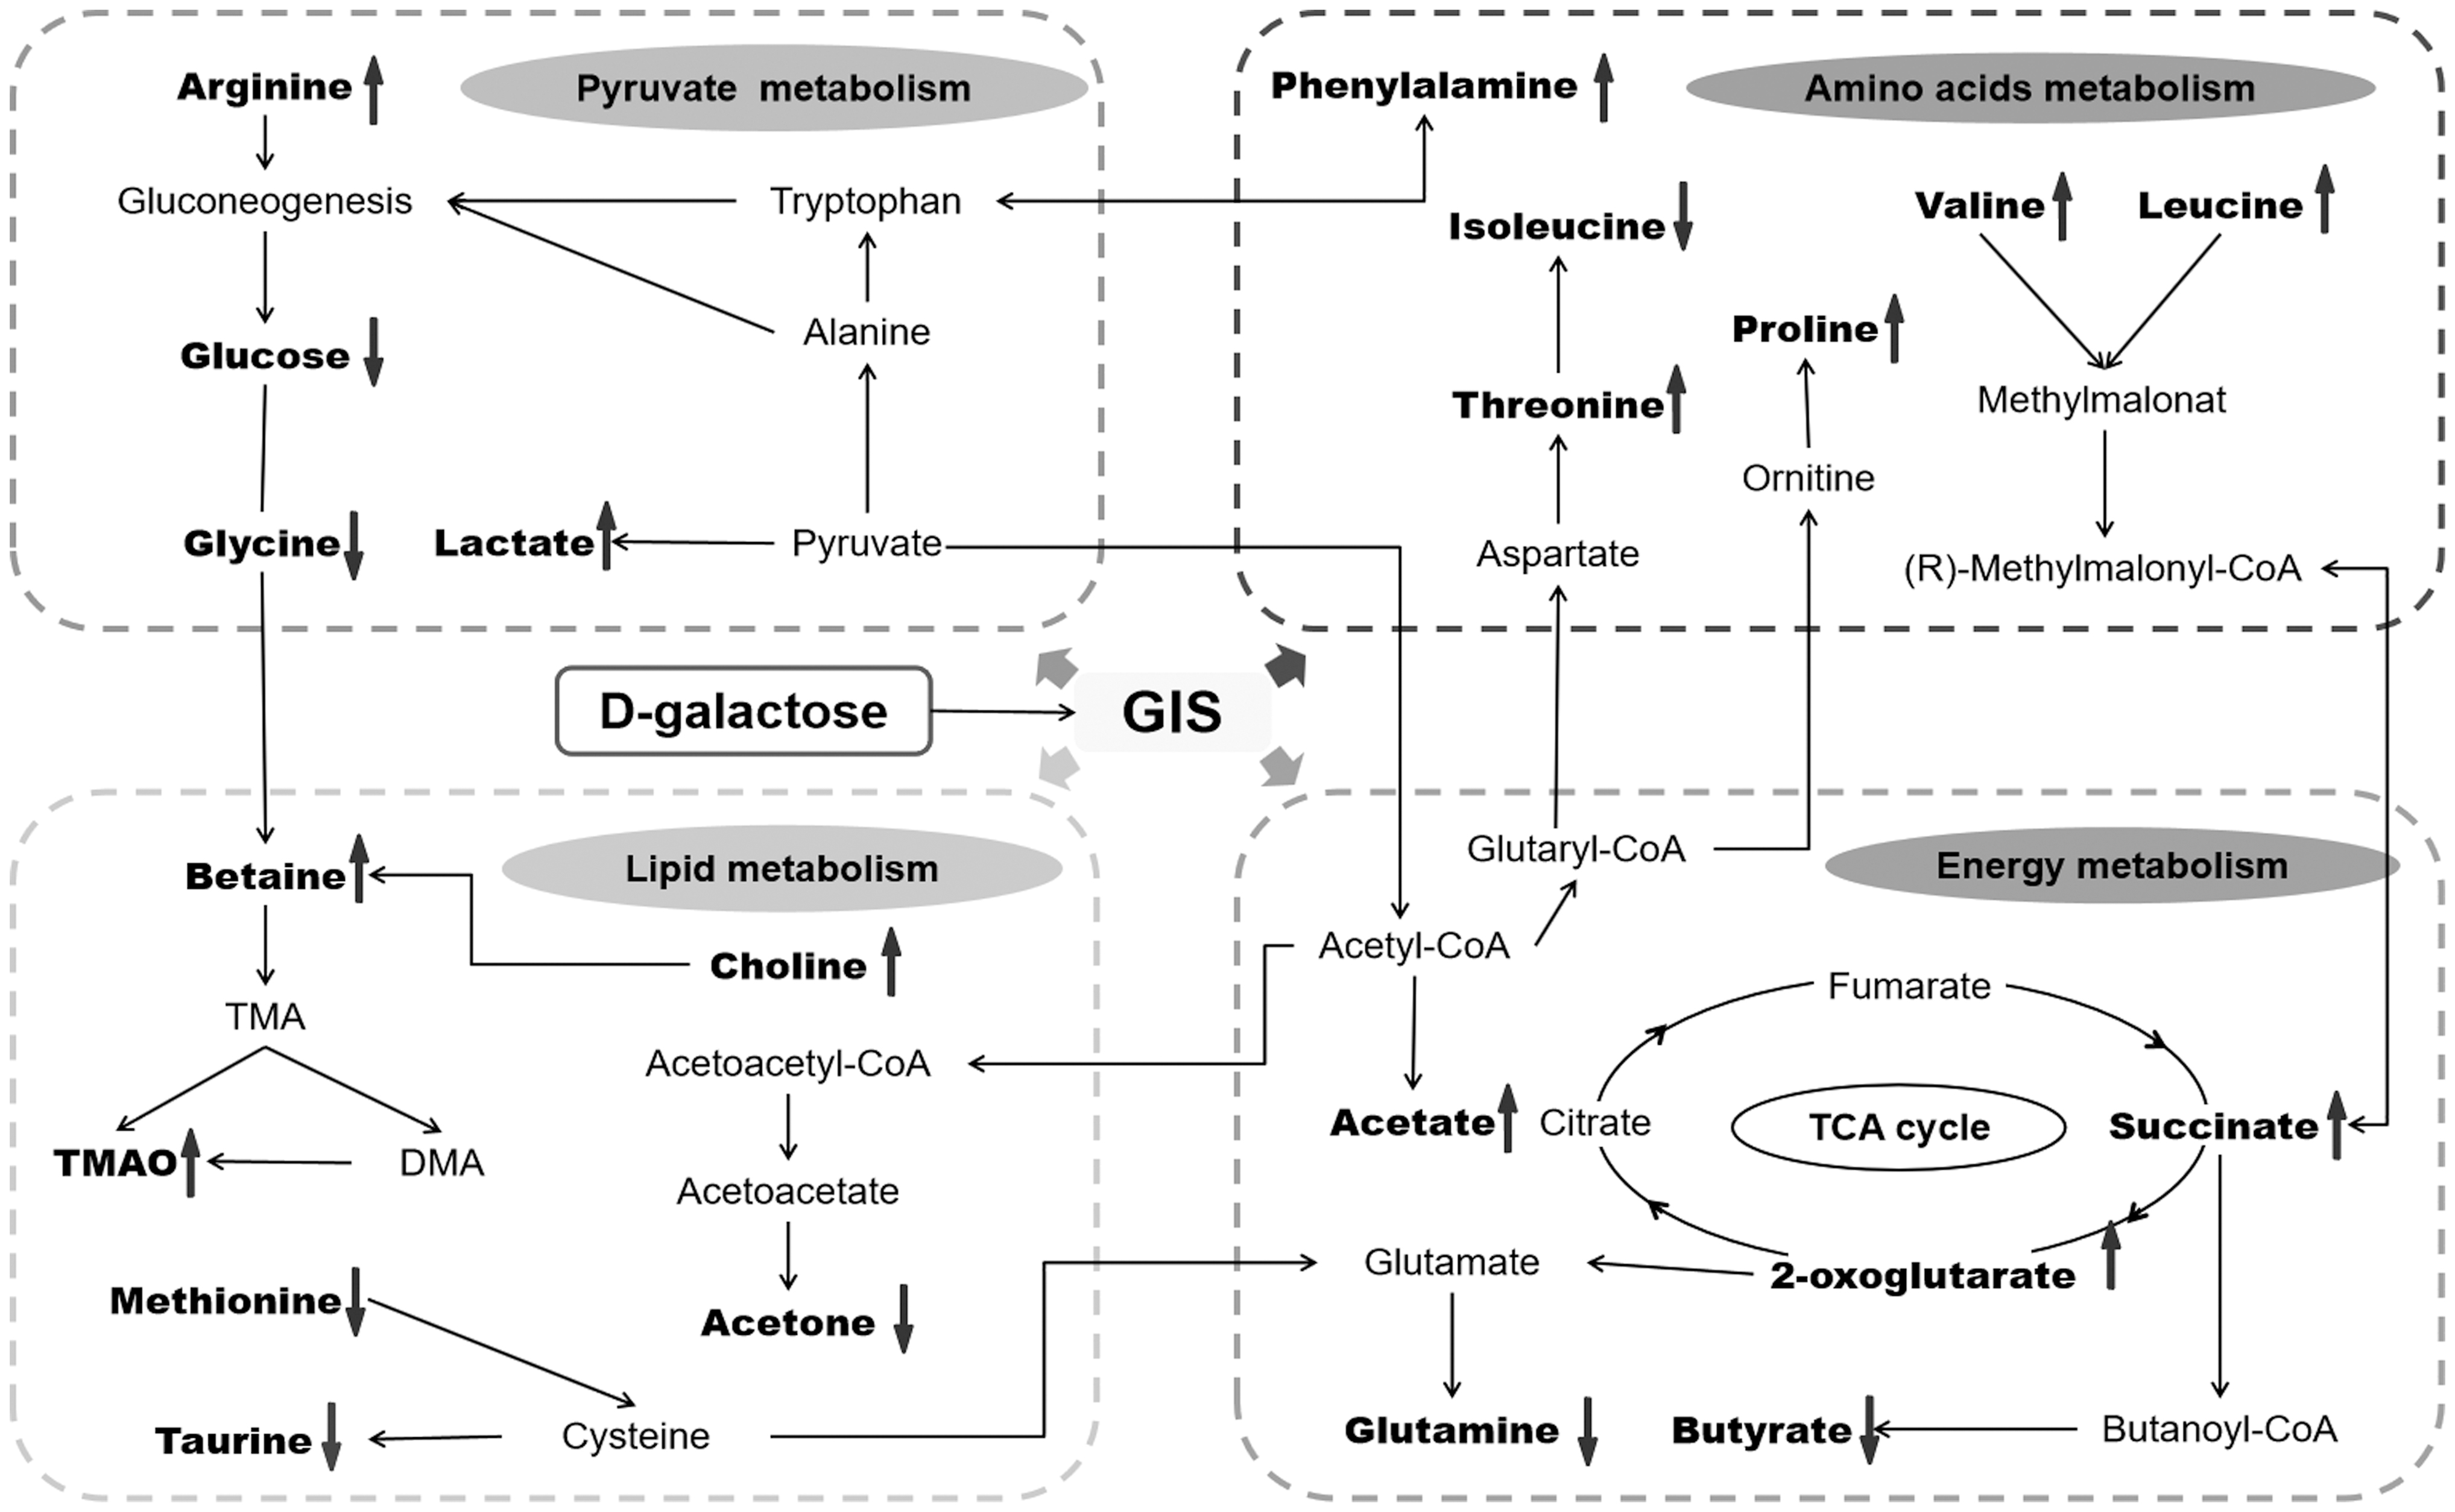
Potential metabolic pathways disturbed by
Discussion
In this study,
Gastrointestinal dysfunction of aging rats by d -gal
There is no doubt that gastrointestinal dysfunction will affect the life quality. Few studies have proved the relationships between
Oxidative stress abnormality of aging rats induced by d -gal
Oxidative stress has been deemed to be a hazard factor for various diseases. CAT plays a crucial role in reducing lipid and hydrogen peroxide.
22,23
SOD is indispensable to the balance of antioxidation and oxidation in the body.
24
As the final product of lipid peroxidation, MDA indirectly reflects the extent of cellular injury.
25
In this study, after 11-week treatment of
Increased oxidative stresses have been testified to disrupt mucosal barrier function of intestinal epithelial cells characterized by increased intestinal permeability.
9,26,27
In addition, various pathological conditions of gastrointestinal tract, that is, gastroduodenal ulcers, gastrointestinal malignancies, and inflammatory bowel disease, are partially related to oxidative stresses.
28
The results of the increase level of oxidative stress in aging rats suggested that
Perturbations in the energy metabolism of aging rats by d -gal
The TCA cycle is the end metabolic pathway of three major nutrients, that is, carbohydrates, amino acids, and lipids.
13,24
In our study, the accumulation of two TCA cycle intermediates, that is, 2-oxoglutarate and succinate, in the aging rats revealed that more nutrient substances were utilized for energy supply. The view is also supported by a significant reduction in glucose and α-xylose. Such an accumulation also explains why the glucose contents of the aging rats are significantly lower than that of control rats. Lactate, as the end product of glycolysis, can reflect the changes of energy metabolism in the body.
29
In our study, the concentrations of lactate increased in aging rats, possibly due to enhancing anaerobic glycolysis.
30
The results were consistent with previous results that energy metabolism in rats was disturbed by
Altogether, the mentioned results suggest that
Perturbations in the liver functions of aging rats by d -gal
Creatine is mainly found in muscle, which is in the form of creatine phosphate. 24 Clinically, an elevated urinary creatinine suggests a possible kidney injury, which may be related to toxin accumulation. 33 The increase of creatine content in the aging rats indicates that the creatinine metabolism was promoted and the renal function has been impaired.
Taurine, the second most abundant amino acid of mammals, is an important index of the degree of liver injury.
31
In this study,
Perturbations in the amino acids metabolism of aging rats by d -gal
In our study, amino acids were significantly altered by
Arginine protects ibuprofen-induced mucosal damage from oxidative stress.
36
The sharp increase of arginine in aging rats indicated that it might be involved in the oxidative stress, and then alleviating and repairing liver damages. Similar to arginine, the increase of proline indicated again that
For the aging rats, the contents of glycine, methionine, and isoleucine significantly declined (Supplementary Fig. S3). In this study, the abnormal metabolisms of amino acids indicated that
Perturbations in the gut bacteria metabolism of aging rats by d -gal
Gut microbial host mutualism endows the host with a fitness advantage including nutritional, immune, and intestinal health aspects.
37
Changes of gut microbiota run through the whole life stage, especially in the early birth and old age. It has been shown that the diversity of gut microbiota reduced by
Perturbations in the SCFAs metabolism of aging rats by d -gal
SCFAs modulate health through providing energy to the host and regulating metabolic syndrome.
41
More than 90% of SCFAs are produced and absorbed within the colon, mainly making up of acetate, propionate, and butyrate.
42
The increased production of acetate may mediate an important positive feedback loop between the gut microbiota and central nervous system,
43
which promotes hyperphagia and increases energy storage in rats.
44
It may also explain why the weights of aging rats increase, but not decrease as natural aging rats do (Supplementary Fig. S1). We then found a significant negative correlation between propionate and intestinal propulsive rate (Fig. 5), suggesting that slight intestinal inflammatory response may occur in the aging rats.
45
The level of butyrate was significantly downregulated by
One limitation of this study is the use of only male rats. In a further study, it is necessary to perform sexually dimorphic microbiome/metabolome. In addition, we will take the dynamic analysis of different time points into our further study.
Conclusion
In summary, the current findings comprehensively demonstrated that
Footnotes
Author Disclosure Statement
No competing financial interests exist.
Funding Information
This study was supported by the Scientific and Technological Innovation Project of Higher Education Institutions in Shanxi Province (Grant No. 2019L0072), the Key Project of Innovation and Entrepreneurship Training Program for College Students in Colleges and Universities in Shanxi Province (Grant No. 2019017), and the Youth Science and Technology Research Fund of Shanxi Province (Grant No. 201901D211140).
Supplementary Material
Supplementary Figure S1
Supplementary Figure S2
Supplementary Figure S3
References
Supplementary Material
Please find the following supplemental material available below.
For Open Access articles published under a Creative Commons License, all supplemental material carries the same license as the article it is associated with.
For non-Open Access articles published, all supplemental material carries a non-exclusive license, and permission requests for re-use of supplemental material or any part of supplemental material shall be sent directly to the copyright owner as specified in the copyright notice associated with the article.
