




Abstract
Oxidative stress (OS) causes biochemical and morphological alterations in erythrocytes. The primary factors contributing to OS are aging and storage. Antioxidants significantly alleviate OS. Therefore, this study aimed to investigate the response of young and old erythrocytes to vitamin C and vitamin E during storage. Erythrocytes were separated into young and old by the Percoll method. Each erythrocyte subpopulation was categorized into the i) Control (additive solution-7 [AS-7]) and ii) vitamin C and vitamin E in AS-7 (VC+VE) groups and stored for 21 days at 4°C. OS, antioxidant, and aging markers were analyzed on days 1, 14, and 21. The activity of antioxidant enzymes was similar throughout storage in young cells. However, superoxide dismutase activity elevated in old cells (Control and VC+VE) on days 1 and 21. Catalase (CAT) activity increased on days 14 and 21, whereas glutathione peroxidase (GPX) increased on days 1 and 14 in old Controls. However, in old VC+VE, CAT increased on day 21 and GPX increased on day 1. Advanced oxidation protein products, superoxides, glutathione, and uric acid increased in old cells throughout storage. Malondialdehyde decreased in old VC+VE compared with old Control on days 14 and 21. Sialic acids and glutamate oxaloacetate transaminase activity were higher in young cells compared to old cells. Young cells exhibited lower oxidative changes throughout storage. Vitamin C and vitamin E were effective in maintaining the redox balance in old cells. These findings emphasize the need for specific approaches for different subpopulations during erythrocyte banking.
Introduction
Erythrocytes have a finite lifespan in the peripheral circulation for approximately 120 days, after which they are removed in an age-dependent manner.1,2 However, the shelf-life of stored erythrocytes is limited to 42 days. 3 Packed red blood cells have a mixed population of recently matured (young) to senescent (old) cells. The storage of erythrocytes with a higher proportion of old cells may result in a decline in cellular recovery, oxygen supply, and metabolic stability. 4
Erythrocytes undergo numerous biochemical, morphological, and immunological alterations during aging.5,6 These include a reduction in cell size, volume, deformability, and hemoglobin content, an increase in cell density, aggregation, binding of autologous immunoglobulin G (IgG),7–13 disruption of the band 3-mediated anchorage, and phosphatidylserine exposure,14,15 changes in membrane cation transport, 16 susceptibility to phospholipase A2, 17 lower sialic acids (SA) content and glutamate oxaloacetate transaminase (GOT) activity,10–12,18 and the accumulation of lipid peroxidation products. 19
SA regulate the membrane deformability, oxygen-carrying capacity, structure, and distribution of the hemoglobin. As erythrocytes continuously pass through narrow capillaries, their surface SA are gradually sheared off with age. 20 GOT activity decreases with erythrocyte age, due to erythrocyte fragmentation, denaturation of the enzyme, and lower levels of the cofactor, pyridoxal phosphate.21,22 Therefore, SA and GOT or aspartate aminotransferase (AST) are considered as indices of aging.2,20,23
Erythrocytes undergo changes that affect their viability and functions during storage, collectively known as “storage lesions.” Reactive oxygen species (ROS) overwhelm the antioxidant system, leading to oxidative stress (OS) during storage. However, erythrocytes possess efficient endogenous antioxidant defenses such as enzymatic and nonenzymatic antioxidants to counteract OS. 24 Exogenous antioxidants as additives can further enhance the antioxidant capacity, thereby improving the efficacy of stored erythrocytes.
The old erythrocytes during storage exhibit a decline in erythrocyte indices, plasma membrane redox system (PMRS), CD47 expression, accumulation of oxidation products, and reactive species, phosphatidylserine externalization, band 3 clusterization, and microparticle formation compared to young erythrocytes.15,25–27 Consequently, old erythrocytes encounter higher OS during storage. Therefore, antioxidants as additives have been in focus in recent years as modifying agents in storage solutions.
There are limited studies that examined the effect of antioxidants on young and old erythrocytes during storage. Arduini et al. 28 observed that L-carnitine could protect against the loss of potassium ions in old erythrocytes and reduced osmotic swelling in both young and old erythrocytes. Vitamin C and vitamin E were effective during storage in erythrocytes. 29
Therefore, the objectives were to investigate i) the intermittent changes occurring during storage in young and old erythrocytes and, ii) the influence of vitamin C and vitamin E on young and old erythrocytes during storage in terms of oxidative modulations. Thus, the OS markers and antioxidant defenses were analyzed.
Materials and Methods
Ethical committee approval was obtained for this study (841/b/04/CPCSEA) (IAEC/NCP/117/2022).
Blood sampling
Wistar rats (male, 4 months old, n = 10) were lightly anesthetized with ketamine hydrochloride and restrained in dorsal recumbency. In brief, the syringe needle was inserted just below the xiphoid cartilage and slightly to the left of the midline. Blood (4–5 mL) was carefully aspirated from the heart into plastic collecting tubes containing anticoagulant, citrate, phosphate, dextrose, and adenine (CPDA)-1 29 (sodium citrate, 89 mM/L; citric acid, 17 mM/L; sodium dihydrogen phosphate, 5.8 mM/L; adenine, 2 mM/L; glucose, 177 mM/L; pH, 5.6). Whole blood and CPDA-1 were mixed in a 1:7 ratio.
Erythrocyte separation
The blood was centrifuged at 2000 rpm at 4°C for 20 minutes. The erythrocyte pellet was washed with isotonic phosphate buffer and resuspended in isotonic phosphate buffer ((a) 0.155 M/L NaH2PO4 [monobasic sodium phosphate], (b) 0.103M/L Na2HPO4 [dibasic sodium phosphate], pH 7.4, 310 mOsm) to a final hematocrit of 50%. 30 The young and old erythrocytes were separated using a Percoll density gradient.
Isolation of young and old erythrocyte subpopulations by Percoll density gradient centrifugation
Young and old erythrocytes were isolated using a modified method by Rennie et al. 31 In brief, two solutions of bovine serum albumin (BSA) were prepared, solution 1: 4.8% BSA in water and solution 2: 4.8% BSA in Percoll (1.13 g/mL). Solutions A and B were prepared by mixing 19 parts of solutions 1 and 2 respectively with 1 part of HEPES buffer (4- (2-hydroxyethyl)-1-piperazineethanesulfonic acid) (pH 7.4). The two solutions were mixed at 80%, 71%, 67%, 64%, and 40% (v/v) to form discontinuous Percoll-BSA gradients. The erythrocyte suspension (50% hematocrit) was then layered carefully over the gradient and centrifuged at 3500 rpm for 20 minutes at 4°C. The erythrocytes fractioned in the 71% layer were “young cells,” and cells found in the 80% layer were “old cells.” These separated young and old erythrocytes were washed and resuspended in isotonic phosphate buffer (pH 7.4) to a final hematocrit of 50%.
Experimental design
The young and old erythrocytes were categorized into i) Control (additive solution-7 [AS-7]) and ii) VC+VE (vitamin C [10 mM] and vitamin E [2 mM] in AS-7) groups. The AS-7 and erythrocyte suspension were mixed at a ratio of 1.1: 4.5. 32 The samples were treated on day 1 and stored for 21 days at 4°C. The aliquots were taken on days 1, 14, and 21 of storage and the OS, antioxidant, and aging markers were analyzed. A hemolysate was prepared by diluting the erythrocyte suspension in a hypotonic phosphate buffer ((a) 0.01 M/L NaH2PO4, (b) 6.6 mM/L Na2HPO4, pH 7.4) (1:14 ratio) 30 and stored at −20°C for further analysis.
Antioxidant enzymes
Superoxide dismutase
Superoxide dismutase (SOD) activity was measured by the method of Misra and Fridovich. 33 Hemolysate was added to the carbonate buffer (0.05 M) [(A) Na2CO3 (5.3 g/L), (B) NaHCO3 (4.2 g/L), pH 10.2]. Epinephrine (30 mM) was added to the above mixture and the absorbance was read at 480 nm. SOD activity (units/mg protein) was expressed as the amount of enzyme that inhibits the oxidation of epinephrine by 50%.
Catalase
Hemolysate was treated with absolute alcohol and incubated at 0°C for 30 minutes. Hydrogen peroxide (H2O2; 6.6 mM) and phosphate buffer (0.1 M) were added to the above mixture and a decrease in absorbance was detected at 240 nm. Catalase (CAT) activity was estimated using the extinction coefficient of 43.6 M cm−1. 34 One unit of CAT activity is equivalent to one mole of H2O2 degraded/minute/mg protein.
Glutathione peroxidase
Glutathione peroxidase (GPX) was analyzed by the method of Flohe and Gunzler. 35 Phosphate buffer (0.1 M), glutathione (GSH) reductase (0.24 units), and 10 mM GSH were added to hemolysate and preincubated for 10 minutes at 37°C, followed by the addition of 1.5 mM nicotinamide adenine dinucleotide phosphate (NADPH) in 0.1% NaHCO3. The overall reaction was started by adding prewarmed H2O2 and a decrease in absorption was monitored at 340 nm. GPX activity was expressed as units/mg protein, where one unit corresponds to the oxidation of 1 mM of NADPH per minute.
Protein oxidation
Advanced oxidation protein products
Advanced oxidation protein products (AOPP) levels were estimated by Witko’s method. 36 Hemolysate was diluted in 0.1 M phosphate buffer saline and 1.16 M L−1 potassium iodide was added. Then acetic acid was added and immediately read at 340 nm. AOPP levels were calculated by using the extinction coefficient of 26 mM−1 cm−1.
Protein sulfhydryl
Protein sulfhydryl (P-SH) was measured as described by Habeeb. 37 Hemolysate was treated with 0.08 M sodium phosphate buffer containing 0.5 mg/mL of Na2-ethylenediaminetetraacetic acid (EDTA), and 2% sodium dodecyl sulfate (SDS). Subsequently, 0.1 mL of 5,5′-dithiobis-2-nitrobenzoic acid was added, vortexed, and absorbance was measured at 412 nm. P-SH was calculated by using the extinction coefficient of 13,600 M−1 L−1 cm−1.
Lipid peroxidation
Malondialdehyde
Hemolysate samples were treated with 8.1% SDS, and incubated at room temperature for 10 minutes. 20% acetic acid was added followed by 0.6% thiobarbituric acid, and the samples were boiled until a pale yellow or pink color developed. Butanol-pyridine (15:1) was added, and centrifuged at 1000 rpm for 5 minutes, and the absorbance of the colored supernatant was measured at 532 nm using standard (1,1,3,3-tetra methoxy propane). 38
Conjugate dienes
Conjugate dienes (CD) were assessed by the method of Olas and Wachowicz. 39 Hemolyasate samples were diluted with ether: ethanol (1:3 v/v), vortexed, and centrifuged at 8000 rpm for 20 minutes. The absorbance of the supernatant was measured at 234 nm and calculated using the molar extinction coefficient of 29,500 M−1 cm−1.
Thiobarbituric acid reactive substances
Thiobarbituric acid reactive substances (TBARS) were determined by the method of Bar-Or et al. 40 Hemolysate was treated with 0.9% NaCl and incubated at 37°C for 20 minutes. Next, 0.8 M HCl containing 12.5% TCA and 1% thiobarbituric acid (TBA) was added and kept in a boiling water bath for 20 minutes and cooled at 4°C. Centrifugation was carried out at 4660 rpm and absorbance was measured at 532 nm. TBARS were calculated by using the extinction coefficient of 15,6000 M−1 cm−1.
Reactive species
Superoxides
Superoxide levels were estimated by the method of Olas and Wachowicz. 39 Hemolysate was treated with cytochrome C (160 μM), incubated at 37°C and the absorbance was measured at 550 nm. The extinction coefficient of 18700 M−1cm−1 was used to calculate superoxide levels.
Nitrites
Nitrite levels were determined by the method of Yegin et al. 41 Hemolysate was treated with distilled water followed by a coupling reagent (Griess reagent [1% sulfanilamide, 0.1% N-(1-naphthyl) ethylenediamine dihydrochloride and 2.5% phosphoric acid]), vortexed, and incubated for 10 minutes. The absorbance was measured at 520 nm. Sodium nitrite was used as a standard to determine the amount of nitrites.
Total antioxidant capacity: cupric ion-reducing antioxidant capacity-BCS assay
Cupric ion-reducing antioxidant capacity (CUPRAC) was measured using the method described by Campos et al. 42 Briefly, the hemolysate was treated with 0.25 mM bathocuproinedisulfonic acid disodium salt (BCS) in 10 mM phosphate buffer (pH 7.4) and an initial absorbance was read at 490 nm. CuSO4 (0.5 mM) was added, and incubated at room temperature followed by 0.01 M EDTA to arrest the reaction. The absorbance was read at 490 nm, compared with a standard uric acid and expressed in mM uric acid equivalents/L.
PMRS
The PMRS was estimated by a modified method of Avron and Shavit. 43 The hemolysate was mixed with phosphate buffer saline (PBS) (containing 5 mM glucose and 1 mM potassium ferricyanide), incubated for 30 minutes at 37°C, centrifuged at 3500 rpm and the supernatant was treated with sodium acetate (3 M), citric acid (0.2 M), and FeCl3 (3.3 M). The amount of ferrocyanide was measured using 4,7-diphenyl-1,10-phenanthrolinedisulfonic acid disodium salt (6.2 mM) and the absorbance was read at 535 nm. PMRS activity was calculated using the extinction coefficient of 20,500 M−1cm−1 and expressed as μM ferrocyanide/mL hemolysate/30 minutes.
Nonenzymatic antioxidants
GSH
GSH was measured using the method described by Beutler et al. 44 Briefly, hemolysate was treated with 4% sulphosalicylic acid, vortexed, and centrifuged at 8000 rpm for 15 minutes. The supernatant was treated with 10 mM DTNB and the absorbance was read at 412 nm. GSH was calculated using the extinction coefficient 13600 M−1cm−1.
Uric acid
Uric acid levels were determined using the Uricase/POD method kit provided by Aspen Laboratories. 45 The hemolysate was treated with the reagent, mixed well, and incubated at 37°C. The absorbance was measured at 492 nm.
Aging markers
SA
SA was estimated using the method of Warren. 46 Briefly, the sample was treated with 0.2 M sodium periodate solution and incubated at room temperature for 20 minutes. Sodium arsenite solution (10%) was added and vortexed until the brown color disappeared. A solution of 0.6% TBA in 0.5 M sodium sulfate was added and incubated in a boiling water bath for 15 minutes. The reaction mixture was cooled and equal volumes of cyclohexanone were added to the top layer. The mixture was then centrifuged at 2000 rpm for 5 minutes at room temperature and the absorbance of the supernatant was read at 549 nm. The molar extinction coefficient, 57,000 M−1cm−1 was used to determine the SA content.
GOT or AST
The levels of GOT/AST in hemolysate were assessed utilizing the modified International Federation of Clinical Chemistry and Laboratory Medicine (IFCC) method at 340 nm as described in the Aspen Laboratories kit. 23 Reagents 1 and 2 were mixed (4:1 ratio), added to the hemolysate, and incubated at 37°C. The change in absorbance per minute was measured at 340 nm for 3 minutes, which is proportional to the GOT activity in the sample.
Protein determination
Protein in the samples was determined using the standard BSA following the method of Lowry et al. 47
Statistical analyses
The results obtained were expressed as mean ± SE. Two-way ANOVA and a Bonferroni post hoc test were performed using GraphPad Prism 6 software, and p < 0.05 was considered statistically significant.
Results
The results are represented as comparisons between i) Day 1 versus other storage days in their respective groups, ii) Control group versus Antioxidant group on a particular storage day, and iii) young versus old erythrocytes on a particular day of storage.
Antioxidant enzymes
SOD
SOD activity remained constant throughout storage in both the Control and VC+VE groups.
SOD activity increased by 3-fold in old cells compared with young cells, on days 1 (p < 0.05), 14, and 21 (p < 0.01) (Fig. 1A).

CAT
CAT activity increased by 14-fold (p < 0.001) and 20-fold (p < 0.0001) on days 14 and 21, respectively, in old Control, whereas it increased by 11-fold (p < 0.01) in old VC+VE on day 21 in comparison to day 1.
CAT activity showed an increment of 38% (p < 0.01) in old Controls compared to young Controls on day 21 (Fig. 1B)
GPX
GPX activity decreased by 35% (p < 0.05) in old VC+VE on day 21 compared with day 1.
GPX activity increased by 94% (p < 0.01) in old Controls compared to young Controls on days 1 and 14, and it increased by 55% (p < 0.01) in old VC+VE compared to young VC+VE on day 1 (Fig. 1C).
Protein oxidation
AOPP
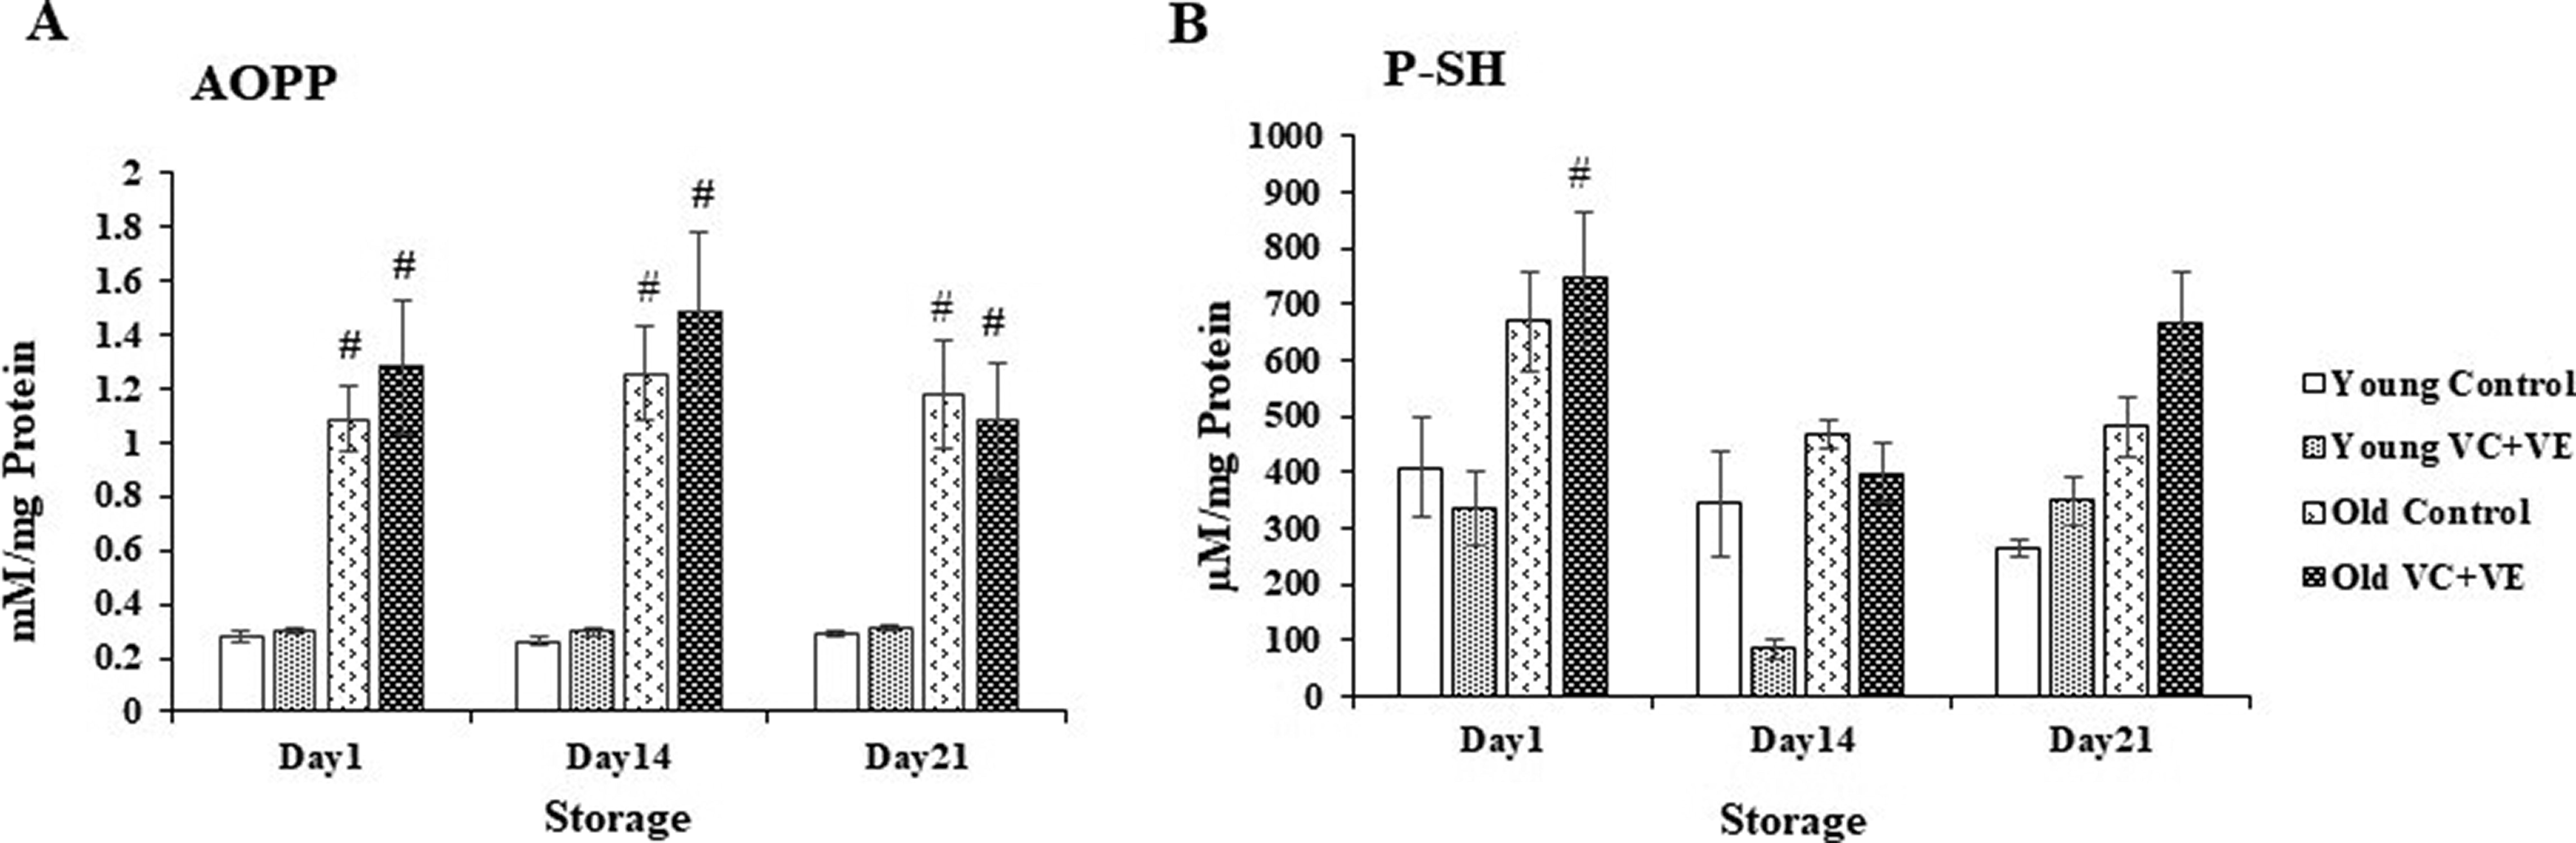
AOPP levels were similar in both the Control and VC+VE groups during storage.
AOPP levels increased by 3-fold (p < 0.05) in the old cells compared to their respective young cells throughout the storage period (Fig. 2A).
P-SH
The changes in P-SH levels were similar throughout storage compared to day 1.
There were changes between the Controls and VC+VE groups throughout storage; however, these variations were statistically similar.
P-SH levels were higher by 1-fold (p < 0.01) in old VC+VE compared to Young VC+VE on day 1 (Fig. 2B).
Lipid peroxidation
Malondialdehyde
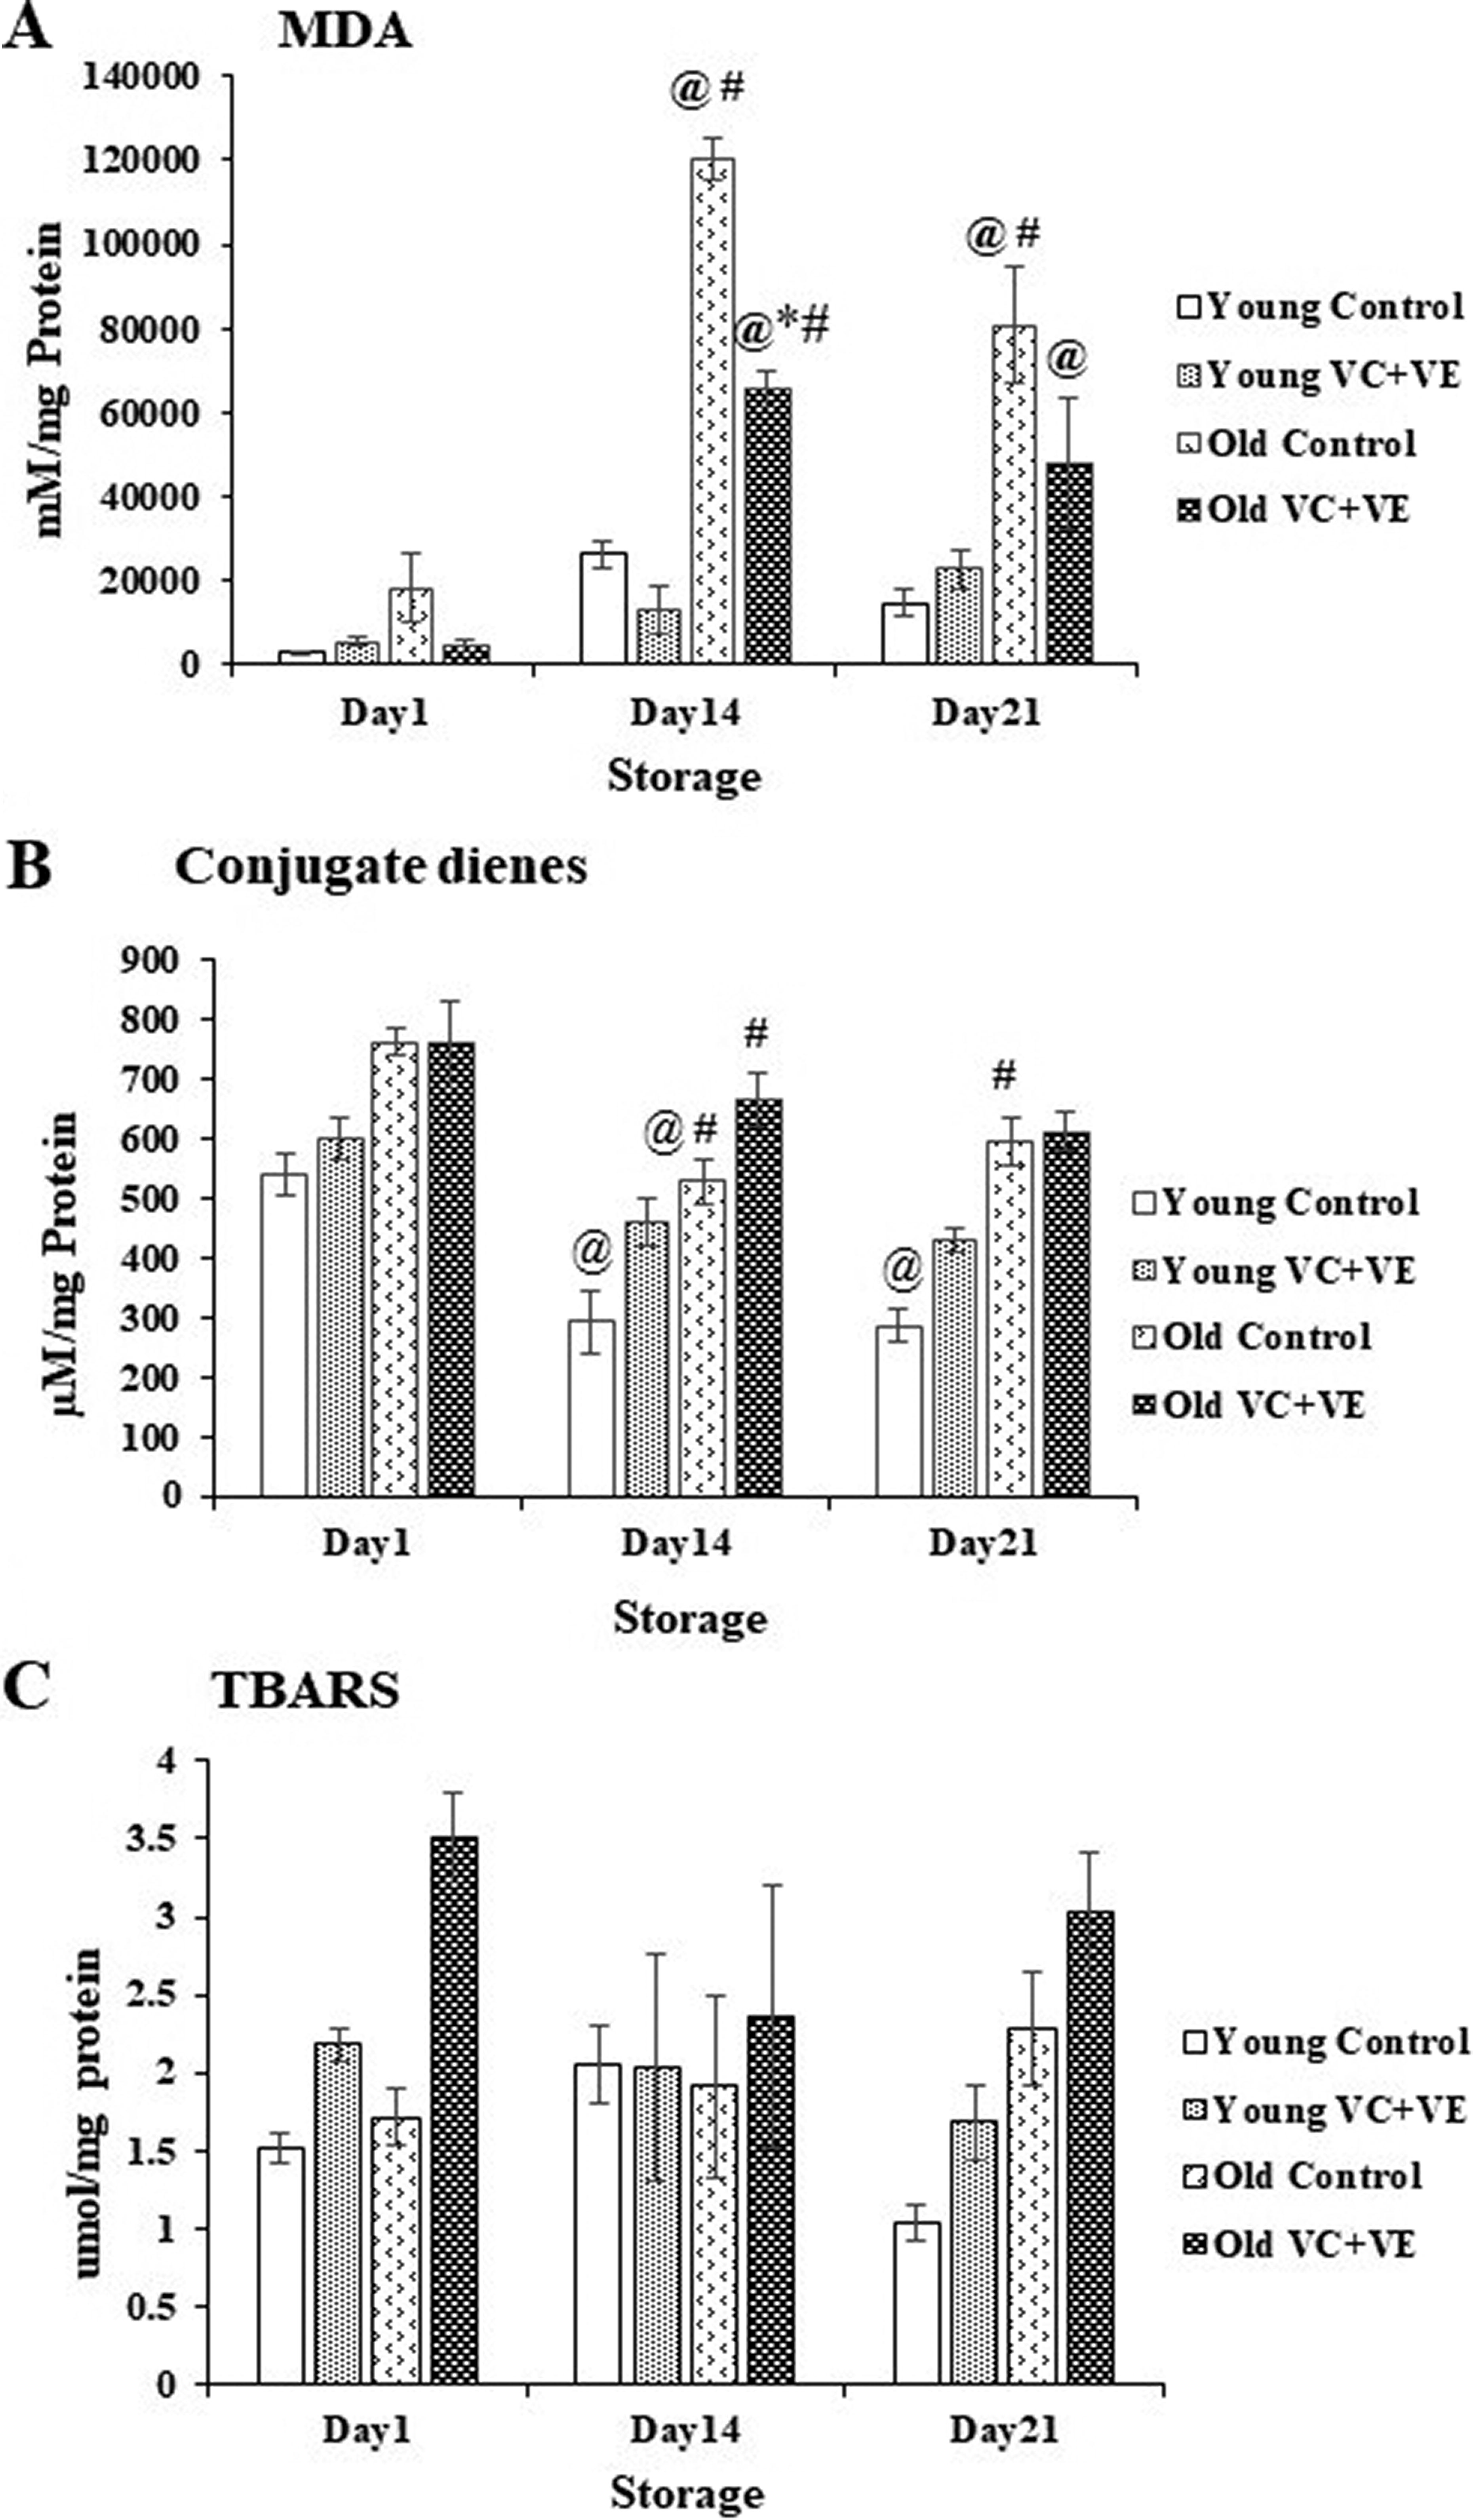
Malondialdehyde (MDA) levels showed increments of 5-fold (p < 0.0001) and 3-fold (p < 0.0001) on days 14 and 21, respectively, in old Controls and 13-fold (p < 0.0001) and 9-fold (p < 0.001) on days 14 and 21, respectively, in old VC+VE compared with day 1.
MDA levels decreased by 45% (p < 0.0001) and 41% on days 14 and 21, respectively, in old VC+VE compared with old Control.
MDA levels increased by 3-fold (p < 0.0001) and 4-fold (p < 0.0001) on days 14 and 21, respectively, in old Controls versus young Controls. Similarly, MDA levels showed increments of 4-fold (p < 0.0001) in old VC+VE compared to young VC+VE on day 14 (Fig. 3A).
CD
CD decreased by 46% (p < 0.01) in young Controls on days 14 and 21 and by 30% (p < 0.01) in old Control on day 14 compared with day 1.
CD showed increments of 81% (p < 0.01) and 45% (p < 0.05) in old Controls and VC+VE compared with young Controls and VC+VE respectively, on day 14. Similarly, CD increased by 108% (p < 0.0001) in old Controls compared to young Controls on day 21 (Fig. 3B).
TBARS
TBARS levels were similar throughout storage in all the groups (Fig. 3C).
Reactive species
Superoxides
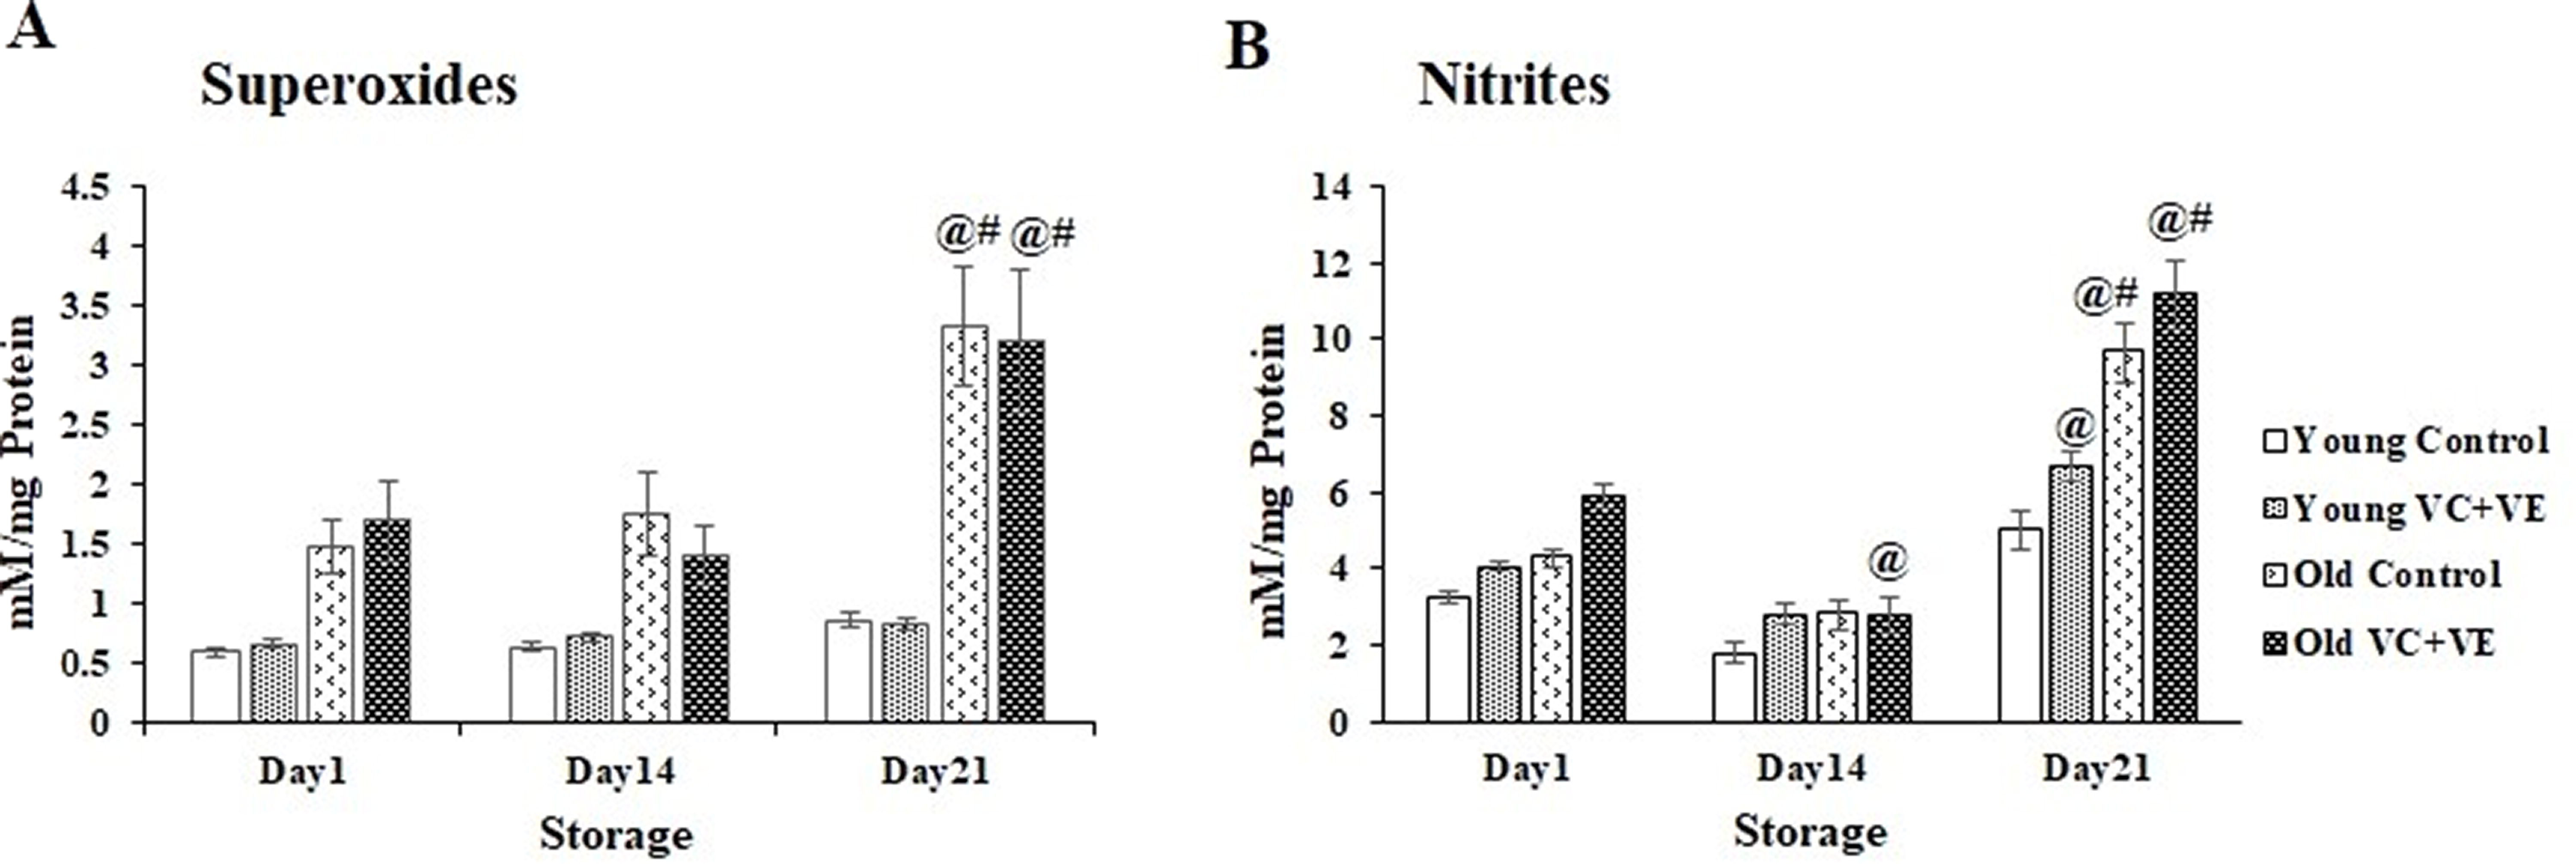
Superoxides increased by 124% (p < 0.001) and 89% (p < 0.05) in old Controls and old VC+VE, respectively, on day 21 compared with day 1.
Superoxides showed an increment of 285% (p < 0.0001) in old cells compared to their respective young cells, on day 21 (Fig. 4A).
Nitrites
Nitrite levels showed an increment of 122% (p < 0.0001) in old Controls on day 21. Nitrites decreased by 52% (p < 0.001), whereas they increased by 90% (p < 0.0001) in old VC+VE on days 14 and 21. Nitrites also increased in young VC+VE by 65% (p < 0.01) on day 21 compared with day 1.
Nitrites showed increments of 94% (p < 0.0001) and 67% (p < 0.0001) in old Control and VC+VE, respectively, compared with their respective young cells on day 21 (Fig. 4B).
Total antioxidant capacity
Total antioxidant capacity (TAC) was decreased by 57% (p < 0.0001) and 46% (p < 0.001) on days 14 and 21, respectively, in young Controls, and by 50% (p < 0.05) on day 21 in young VC+VE compared with day 1.
TAC was maintained in Controls and VC+VE in both young and old cells throughout storage (Fig. 5A).

PMRS
PMRS was similar in all the groups throughout storage.
PMRS increased by 1-fold (p < 0.001) in old VC+VE compared with young VC+VE on day 1 (Fig. 5B).
Nonenzymatic antioxidants
GSH
GSH levels were similar in all the groups during storage.
GSH levels increased by 103% (p < 0.0001) in old Controls and 70% (p < 0.0001) in old VC+VE compared with their respective young cells throughout storage (Fig. 5C).
Uric acid
Uric acid levels were decreased by 32% (p < 0.01) in old VC+VE on day 14 compared with day 1.
Uric acid levels showed increments of 87% (p < 0.0001), 78% (p < 0.05), and 65% in old Controls on days 1, 14, and 21 respectively, compared with young Controls. Uric acid levels also increased by 59% (p < 0.0001) and 74% (p < 0.0001) on days 1 and 21, respectively, in old VC+VE compared with young VC+VE (Fig. 5D).
Aging markers
SA
SA levels were maintained throughout storage in all the groups (Fig. 6A).

GOT or AST
GOT activity was maintained similarly throughout storage. However, GOT activity was higher in young cells compared to old cells throughout storage (Fig. 6B).
Discussion
Oxidative alterations occur during the second week of erythrocyte storage. 48 Therefore, the initial analysis of samples was confined to intervals of 14 days. The young cells disappear from day 21 of storage.26,49 Therefore, storage period was limited to 21 days. SA and GOT serve as markers of erythrocyte aging, whereas old erythrocytes have lower levels of SA levels (30%) and GOT activity compared with young cells.2,20,23 This was confirmed in this study by estimating the GOT activity and SA content.
Erythrocytes are more susceptible to oxidative damage with age, 2 leading to a decline in their function and viability. 5 SOD converts superoxide radicals into H2O2 and oxygen. CAT and GPX scavenge H2O2. 24 However, the GSH-dependent activity of GPX has been considered the primary line of defense against H2O2.
Young erythrocytes exhibit lower oxidative changes compared to old cells.27,50 This was evidenced by constant protein oxidation products throughout storage and a decline in primary lipid peroxidation product, CD, on days 14 and 21, indicating a cessation in lipid propagation reaction. Consequently, secondary products such as MDA and TBARS were maintained in young Controls. Similarly, the antioxidant defenses, including SOD, CAT, GPX, uric acid, GSH, the PMRS, superoxides, and nitrites, were maintained throughout storage in young Controls, suggesting that redox homeostasis was maintained in young cells. However, there is a gradual decrease in TAC on days 14 and 21 in young Controls, as erythrocytes experience a reduction in antioxidant capacity during storage.51,52
Erythrocytes are susceptible to OS with cell age and storage.15,27,50,51 This was evidenced by elevations in CD on day 14 and MDA levels on days 14 and 21, respectively, in old Controls with storage. Superoxide levels were higher in old erythrocytes than in young ones. This could be attributed to the accumulation of reactive species during cell aging, which were generated by the auto-oxidation of hemoglobin and possibly by NADPH oxidase.11,53,54 In addition, reactive species such as nitrites and superoxides increased at the end of storage, leading to a decline in TAC. The antioxidant defenses were activated due to the accumulation of reactive species. Consequently, CAT activity elevated on days 14 and 21 in response to higher levels of H2O2 in old Controls.
P-SH was maintained in a reduced state, whereas AOPP levels increased throughout storage in old Controls compared with young Controls. Furthermore, MDA and CD increased on days 14 and 21 in old Controls compared with young Controls, reflecting the increased susceptibility of old cells to OS. This was also evidenced by higher levels of superoxide and nitrites on day 21 in old cells. Thereby, the antioxidant defenses were activated to counteract the reactive species and to maintain redox homeostasis. Therefore, SOD activity increased on days 1 and 21 to scavenge higher levels of superoxide radicals. GPX activity elevated on days 1 and 14 because it primarily scavenges lower levels of H2O2, whereas CAT activity increased on day 21 in response to higher levels of H2O2 at the end of storage. Similarly, endogenous antioxidants, such as uric acid and GSH, increased in old cells compared to their young cells throughout storage. Antioxidant defenses were upregulated in response to increased levels of ROS.55,56
MDA levels increased in old Controls and VC+VE with storage; however, they were lower in old VC+VE compared with old Controls because of the synergistic action of vitamins C and E against lipid peroxidation. 57 Vitamin E, as a membrane-interacting antioxidant, decreases MDA levels and protects erythrocytes from lipid peroxidation during storage.58,59 CAT activity elevated in old cells at the end of storage in response to higher levels of H2O2. Vitamin C and Vitamin E directly scavenge H2O2,60–62 thereby CAT activity was lower in VC+VE compared with Controls. This was also evidenced by elevated GPX activity. Nitrites declined in old VC+VE on day 14, indicating the reaction of vitamin C 63 and vitamin E 64 against nitrite generation, resulting in a decrease in endogenous antioxidant levels, such as uric acid. However, the nitrites increased on day 21 in both young and old VC+VE because of the consumption of nitrites by erythrocytes under hypoxic conditions, especially after storage for 14 days or longer. 65
AOPP levels increased throughout storage in old VC+VE compared with young VC+VE because of the susceptibility of sensitive protein groups to oxidation. Thereby, the antioxidant defenses, such as GSH levels elevated throughout storage and SOD activity, and uric acid levels increased on days 1 and 21. The reactive species such as superoxides and nitrites were maintained until day 14 and increased only at the end of storage in old cells compared to their young cells, indicating that additive antioxidants could scavenge oxidants61,63,64,66 and protected old cells up to 14 days of storage.
P-SH levels were higher in old VC+VE on day 1, indicating that additive antioxidants were effective in protecting P-SH groups against oxidation even in old cells on day 1 of storage. Vitamin C protects intracellular thiol groups, 67 thereby GSH levels were maintained in the reduced state. Higher levels of GSH protect the erythrocyte proteins from oxidation, 68 and preserved P-SH groups, 24 which were associated with these results.
PMRS maintains cellular redox balance by regulating the NAD(P)+/NAD(P)H ratio. 50 Vitamin C and vitamin E are involved in the cellular redox system by inhibiting lipid peroxidation and maintaining GSH in a reduced state, utilizing reducing equivalents from NADPH.69,70 Therefore, PMRS elevated in old VC+VE on day 1 and remained higher throughout storage, indicating the effect of antioxidant additives in maintaining redox equilibrium.
Conclusion
Erythrocytes are more prone to OS during their aging and storage. This was evidenced by the elevation in oxidation products, reactive species, activation of antioxidant defenses, reduced antioxidant capacity, lower levels of SA content, and GOT activity in old cells compared to young cells during storage.
Young cells exhibited minimal oxidative changes and consistent responses regardless of the presence or absence of antioxidants throughout storage. However, vitamin C and vitamin E could maintain antioxidant capacity (TAC) and scavenge nitrites in young cells up to 14 days of storage.
Vitamin C and vitamin E were effective in reducing MDA and nitrite levels up to 14 days of storage, and maintained sulfhydryls and PMRS in old cells. The onset of OS was evident from day 14 in old Controls, whereas it was evident from day 21 in old VC+VE. Therefore, employing antioxidant additives, vitamin C and vitamin E could delay the onset of oxidative changes in old erythrocytes during storage. These findings highlight the necessity for specific approaches in blood banking, particularly directed toward young and old erythrocytes.
Authors’ Contributions
M.P.: Investigation, formal analysis, data curation, writing—original draft, visualization. V.R.: Conceptualization, methodology, validation, supervision, Writing—review & editing.
Footnotes
Acknowledgments
The authors acknowledge Dr. Leela Iyengar, Dr. Soumya Ravikumar, Dr. Carl Hsieh, Dr. Manasa K, Ms. Magdaline Christina R, Anusha B A, and JAIN (Deemed-to-be University) for their support.
Author Disclosure Statement
There are no conflicts of interest to declare.
Funding Information
This research did not receive any specific grant from funding agencies in the public, commercial, or not-for-profit sectors.
Data Availability Statement
The data that support the findings of this study are available from the corresponding author, upon reasonable request.
Ethical Approval
The study was approved by the ethics committee (IAEC/NCP/117/2022) and animal care and maintenance were in accordance with the ethical committee regulations.