
Abstract
While the environmental and health benefits of the green transition are likely to be significant, its economic benefits may accrue unequally to different communities, thereby limiting a just transition. This article examines whether socially disadvantaged racial and ethnic groups are more vulnerable to occupational displacement in the green transition because their existing skills are less suitable to green jobs and because they reside in counties that are not rich in green jobs. Multivariate regression analysis is used to test this hypothesis, combining newly available county-level data on green jobs with socioeconomic and demographic information. The results show significant racial disparities, even after accounting for educational attainment and rural domiciles. Native American and Black-majority counties have fewer green jobs, amounting to about one standard deviation lower than the average county. The data does not show evidence of ethnic disparities in the distribution of green jobs. The analysis reveals that policies targeted toward enhancing or acquiring skills required for green jobs are urgently needed, particularly in socially disadvantaged racial communities, to ensure that the green transition is just and inclusive.
Introduction
Upon rejoining the Paris Agreement in 2021, the United States administration announced that the transition to a low-carbon economy—the so-called green transition—would be a top priority in the fight against climate change (The White House, 2021). While the centerpiece of this announcement was a new target of achieving a 50 to 52 percent reduction in net greenhouse gas emissions by 2030, there was an important labor market focus of these goals, which emphasized that the green transition would simultaneously present an opportunity to create “…good-paying union jobs, strengthen America's working communities, protect public health, and advance environmental justice” (The White House, 2021).
However, although the environmental and health benefits from a green transition are likely to be significant, there are reasons to worry that the economic benefits from such a large-scale transformation of the US economy will accrue unequally to individuals. This is because the green transition is expected to lead to a fundamental shift in economic activity from high-emission industries to industries that generate lower emissions, shift production toward greener goods and services that are environmentally sustainable, and reallocate capital investment from traditional to more resilient infrastructure (Consoli et al., 2016; Organisation for Economic Cooperation and Development, 2020; Popp et al., 2020). Such changes will lead to deep changes in the skills demanded of workers, requiring many to move to new occupations in emerging industries (Castellanos & Heutel, 2019; Sievers et al., 2019). While some workers may be able to use their existing skills in the green economy, and others may be able to adapt their skills to emerging jobs and industries, there are those whose skills will become redundant or obsolete, or who will need to be retrained and possibly relocated as the United States greens its economy.
The goal of this study is to contribute to better understanding the prospects of a just transition from the perspective of the US labor market as the greening of the economy gets firmly underway. That is, the focus is on whether socially vulnerable groups—based on race, ethnicity, and educational achievements—are less equipped to participate in a green economy based on their existing skills and occupations. An early study of the unequal impacts of climate change on minorities and poor—The Climate Gap—is presented in Frosch et al. (2009). Since then, many researchers have studied the disproportionate risks to racial and ethnic minorities in coping with the adverse effects of climate change, and Sovacool (2021) provides a meta review. However, this study found no work that quantitatively analyzes the racial and ethnic vulnerabilities to the green transition from the perspective of labor market skills mismatch. More insights into how this transition will impact the job prospects of vulnerable groups is critical to the design of worker training and upskilling programs to ensure an equitable transition to a low-carbon economy for all workers.
This research is made possible by a recent upsurge in the measurement of green jobs (see for example, Bowen et al. 2018; Consoli et al. 2016; International Monetary Fund, 2022; Vona et al. 2018; Vona et al. 2019). This growing body of work has at its foundation the US Bureau of Labor Statistics database on Employment and Training Administration Occupational Information Network (O*NET). O*NET is a comprehensive database containing occupation-specific information on skill occupational requirements and tasks performed on the job, tracked since the early 2000s. These data provide detailed requirements for each occupation, such as detailed tasks performed, skills, and education and training requirements. Using questionnaire data from a representative sample of US firms, expert evaluators and job incumbents assign importance scores to different task or skill items, such as problem solving (O*NET Resource Center, 2010, 2021).
O*NET defines “green occupations” as those expected to see increased demand due to the green transition, and those requiring enhanced or new skills to meet the needs of a low-carbon economy (Dierdorff et al., 2009). Drawing on the O*NET classification of tasks as either green or non-green, Vona et al. (2018) have proposed a “greenness index” for each two-digit SOC occupation. (The 2018 Standard Occupation Classification (SOC) is the US federal statistical standard used to classify workers into occupational categories in the data disseminated by federal agencies.) This index is measured as the ratio of its green to non-green tasks. For example, occupations such as environmental engineers and solar photovoltaic installers score high, reflecting the emphasis of these jobs on the sustainable use of resources, while occupations such as electrical engineers and biochemical professionals, whose tasks are often complementary to environmental activities, score in the mid-range, and construction workers and fossil-fuel miners score at the bottom (see Vona et al., 2018, Table 1).
Variables Used in the Analysis
Note. US Census Bureau data is taken from the 2020 census. Data from the USDA are in its 2020 economic research service (ERS), which draws from the US Census, the Bureau of Labor Statistics, Local Area Unemployment Statistics. Categories of race and ethnicity closely follow those from the 2020 census (US Census Bureau, 2021). IMF data are from World Economic Outlook April 2022 (IMF, 2022).
Building on this index—and using an approach popularized for proxying county-, state-, or country-level exposure to automation (Das & Hilgenstock, 2021) and remote workability (Dingel & Neiman, 2020)—the International Monetary Fund (IMF) (2022) has constructed a “green job intensity” or “green intensity” as a weighted average of the Vona et al. (2018) greenness index, using county occupational employment shares as weights. This employment-weighted green job intensity reveals that as of 2020, between 2 and 3 percent of employment in the United States is green, a number that has remained stable since 2014 (IMF, 2022). This study uses the county-level green intensity of jobs constructed in IMF (2022) and refers readers to that paper for details beyond those summarized here.
The main question posed in this study is whether socially disadvantaged racial and ethnic groups are more vulnerable to occupational displacement from the green transition because their existing skills are less suitable to green jobs. As this study documents, green-intensive jobs are, in general, high-skilled jobs associated with higher levels of educational attainment and are more likely to be found in urban areas. It has previously been documented that minority populations have lower educational attainment (see recent review, Roy et al., 2020) and are less equipped with the analytical and mechanical skills needed for green occupations (Kochhar, 2020). Drawing on this evidence, the working hypothesis is that minority populations are also less likely to currently be employed in green occupations and will therefore need to enhance their existing skills, acquire new skills, or if possible, retrain and move to new occupations in new industries in a green economy, all of which will potentially create a more difficult transition for them.
To empirically answer this question, an analysis of the green job intensity in 3,041 counties of the 48 contiguous states and the District of Columbia was undertaken. (Note that green job intensity data is not available for Alaska and Hawaii in the IMF 2022 report.) Adjusting for socioeconomic differences across counties, an assessment was made to address whether counties with more racially or ethnically disadvantaged populations have lower green job intensity. The empirical analysis combines the green-intensity of county employment from IMF (2022) with county-level data on racial and ethnic composition, education, and urbanization from the 2020 census of the US Census Bureau (2021) and the US Department of Agriculture (2021). The definition of race and ethnicity used in the study follows that used by the US Census Bureau (2021), which identifies five major racial categories in the United States: White, Black, Native American, Asian, Native Hawaiian or other Pacific Islander; and two ethnic categories: Hispanic or non-Hispanic (See Table 1). Due to the relatively small shares of Asian and Pacific Islanders in the US population, the results on race focus predominantly on the disparities between White, Black, and Native American populations. White populations are defined as the non-Hispanic White population, following the standards on race and ethnicity set by the Office of Management and Budget (OMB, 1997).
The raw data point to sharp differences in green job intensities along socioeconomic and demographic dimensions. Black- and Native American-majority counties have about half the green job intensity of White-majority counties. Educational attainment is strongly associated with green intensity, with an especially pronounced corelation for college graduates. More urban counties have higher green job intensity. No meaningful differences were found in green job intensity by ethnicity, although this result could reflect, in part, that the classification of ethnicity is not sufficiently disaggregated due to data limitations. Multivariate regression analysis continues to indicate that Black- and Native American-majority counties have lower green job intensity, even after controlling for differences in educational attainment, rural domiciles, and unobserved differences across states that can affect green job intensity (e.g., differences in states' clean-energy resources for businesses, education, and training in green jobs).
As progress toward greening the economy gathers pace, it is important that the transition be inclusive for all segments of the labor market. To that end, it is vital that the federal and state governments put in place a comprehensive package of policies that supports the enhancement or acquisition of skills for green occupations. This can include free or subsidized provisions for retraining programs, policies that lower impediments that workers could face in moving between occupations and industries, and adjustment programs for businesses to adapt to the new regulations of the green economy (for example, tax credits for installation of emission monitors and rebates for investment in climate-resilient infrastructure). The results of this study suggest that green job policies will need to be focused strongly on racially disadvantaged Black and Native American workers, workers in rural communities, and possibly those with lower educational attainment. Delaying these policies will limit the economic benefits that these workers can accrue from the green transition and possibly exacerbate existing disparities.
Data and Stylized Findings
The data for this study were drawn from two main sources. Data on the green intensity of county jobs is from the IMF (2022). A high-level description of this measure can be found in IMF (2022), the primitive sources in O*NET (2021), and additional details in Vona et al. (2018). County-level data on socioeconomic and demographic variables were drawn from the US Census Bureau (2021) and the economic research service of the US Department of Agriculture (2021). Table 1 provides a list and sources of the variables used in this study.
Green Job Intensity
The emerging literature on the green transition predominantly uses the O*NET database of the US Department of Labor as its underlying source for data (see e.g., Bowen et al. 2018; Consoli et al., 2016; Popp et al. 2020; Vona et al., 2018; Vona et al., 2019). The O*NET database presents detailed occupational-level information on “green tasks” and “general tasks” in each two-digit SOC occupation. For example, according to the O*NET database, water resource specialists perform both green tasks such as “identifying and characterizing specific causes or sources of water pollution” as well as general tasks such as “supervising teams of workers who capture water from wells and rivers.” Using this information, Vona et al. (2018) calculate a “greenness index” for each occupation as the ratio of green tasks to non-green tasks. Unsurprisingly, occupations such as wind energy engineers and solar energy systems engineers score high on this index, while occupations such as service operators in oil, gas, and mining, and other occupations associated with the fossil-fuel industry, score low.
Drawing on this index, IMF (2022) calculates a “green job intensity” as the weighted average of the greenness index using within-county employment shares as weights in two-digit SOC occupations. This green intensity of jobs is an approximation for the share of green jobs within a county. It ranges from 0 to 100 percent, with higher values denoting a larger share of green jobs.
Table 2 Panel A presents summary statistics about green job intensity. At the county level, the green intensity of occupations varies from a low of 0.37 percent (Buffalo County, South Dakota) to a high of 6.08 percent (Beaver County, Oklahoma), and has a mean value of 2.65 percent. In the United States as a whole, IMF (2022) and Vona et al. (2019) estimate the share of green jobs to be fairly low, at about 2 to 3 percent of all jobs. Calculations for the study indicate that the share of green jobs at the county level is similarly low, albeit with fairly high dispersion across counties, and that much progress will be required to significantly increase green occupations in the US labor market.
Summary Statistics
Green job intensity and total population are winsorized at 99 percent to eliminate extreme outliers.
Summary statistics are calculated over 3,041 counties, covering the 48 contiguous states and the District of Columbia.
Statistics for all variables, with the exception of the rural dummy variable, are reported in percent terms (e.g., 0.8 denotes 0.8 percent).
Educational attainment (high school, some college, and college graduate) does not add up to precisely 100% due to missing data in a few counties.
Racial breakdown does not add up exactly to 100% due to residual group of “Other.”
To understand the distribution of green jobs across states, a weighted average of the green intensity of counties is calculated within each state using employment shares of the state's counties as weights. Summary statistics of the state-level measure of green intensity are shown in the second row of Table 2, Panel A and illustrated in Figure 1.
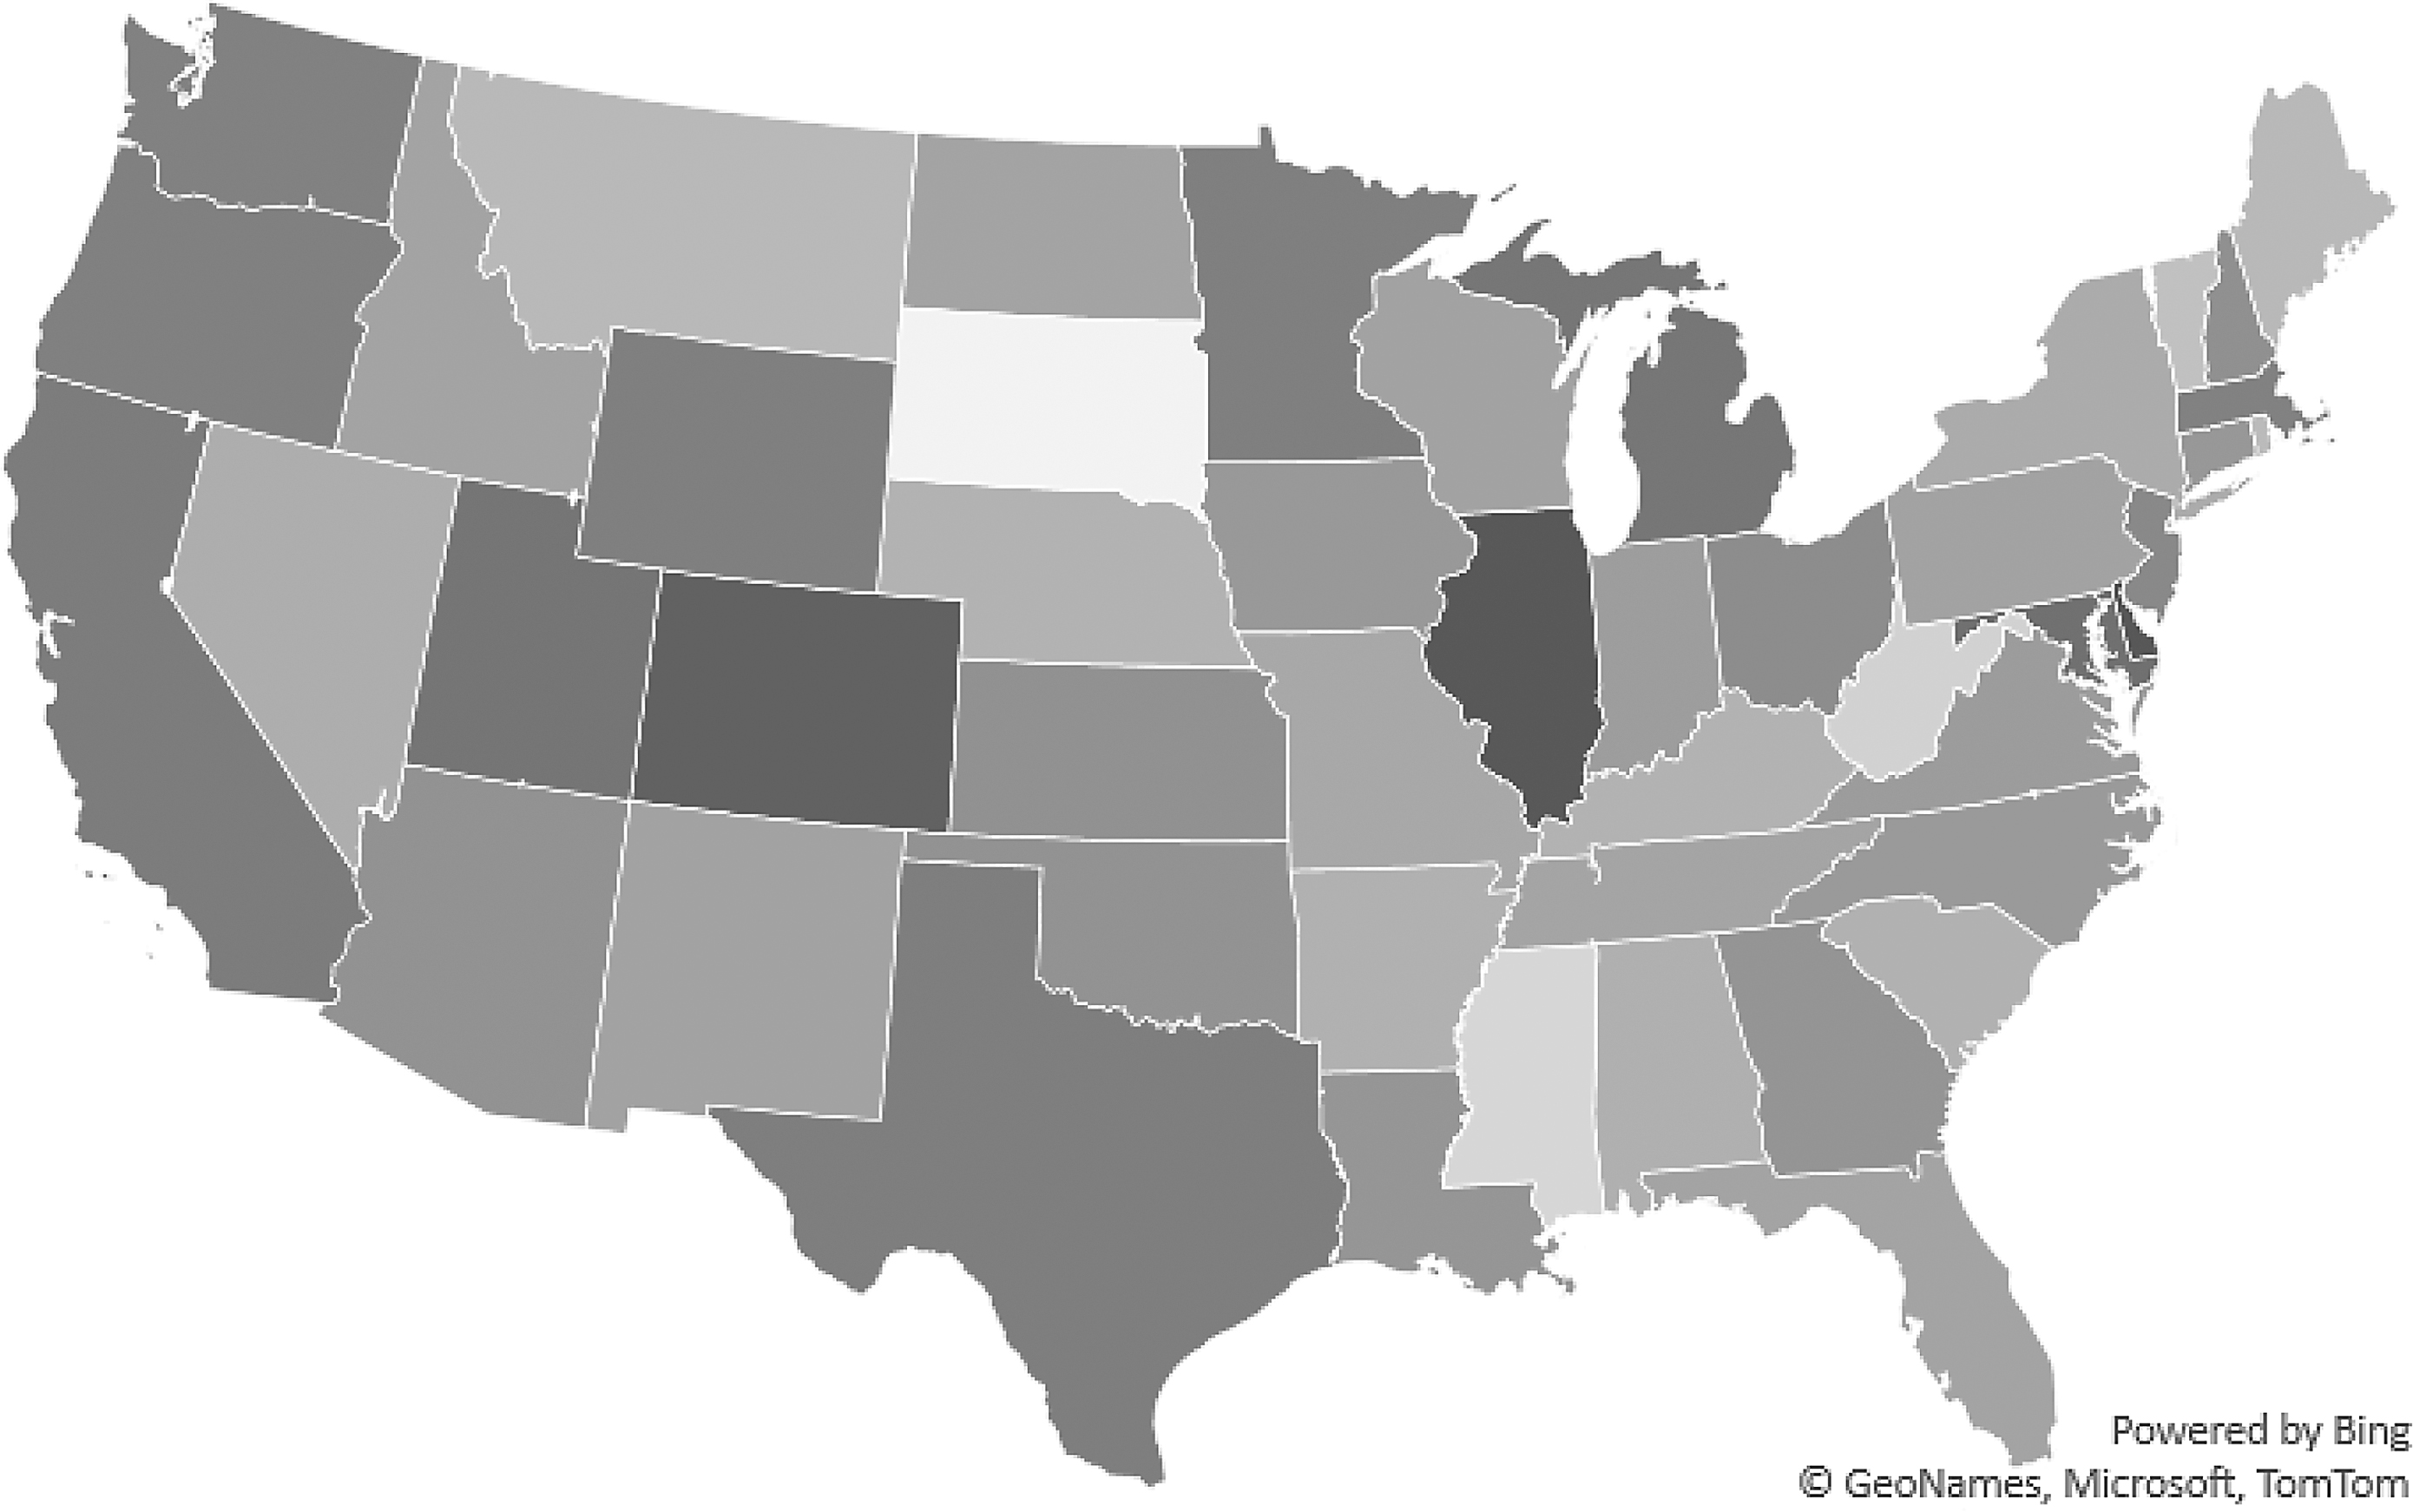
Geographical dispersion of green job intensity
According to this calculation, South Dakota—the state with the third-highest share of rural counties and the highest share of Native American residents—has the lowest green job intensity. The District of Columbia and Illinois—both of which have among the highest educational attainment in the United States and the lowest share of rural counties—have the highest green job intensity, amounting to around 4 percent of their respective local labor markets.
Socioeconomic and Demographic Data
Descriptive statistics of socioeconomic and demographic covariates are reported in Table 2, Panel B. As of 2020, about four in 10 individuals in the United States had educational attainment of high school graduation or less, while one in five had a four-year or higher college degree. These estimates are similar to those found in earlier years (Schaeffer, 2022). Drawing on the US Census Bureau's rural-urban commuting area designation, about 28 percent of the total population was found to reside in nonurban areas. The codes 9 and 10 of the rural-urban commuting areas are used to designate rural counties. (See Table 1).
On racial and ethnic composition, the US data indicates that as of 2020, three-fourths of the population are non-Hispanic White, and about 10 percent each are Black or Hispanic, with the rest distributed among Asian, Native American, and Pacific Islander racial origin. Note that the data reflect the US Census Bureau definition of “Black or African American alone population,” which excludes Black in combination with another race. With Black in combination with one or more races, the Black population is estimated at about 13.5 percent in the 2020 census.
Before turning to regression analysis, disparities of green job intensity in the raw data are examined by disaggregating race, ethnicity, educational attainment, and urbanization into more narrowly defined subgroups and examining whether green job intensity varies across these subgroups.
Beginning with the role of race and ethnicity in county green employment (Figure 2), following Sunter et al., (2019), counties are categorized as a majority or strong majority of a race or ethnicity if more than, respectively, 50 or 75 percent of the population self-identify as the same race or ethnicity. Using this definition, there are no counties in the 48 contiguous states and the District of Columbia that are majority Asian or Pacific Islander (see Table 2). Consequently, this study focuses on White-, Black-, and Native American-majority counties for racial disparities, and on Hispanic- and non-Hispanic- majority counties for ethnic disparities.
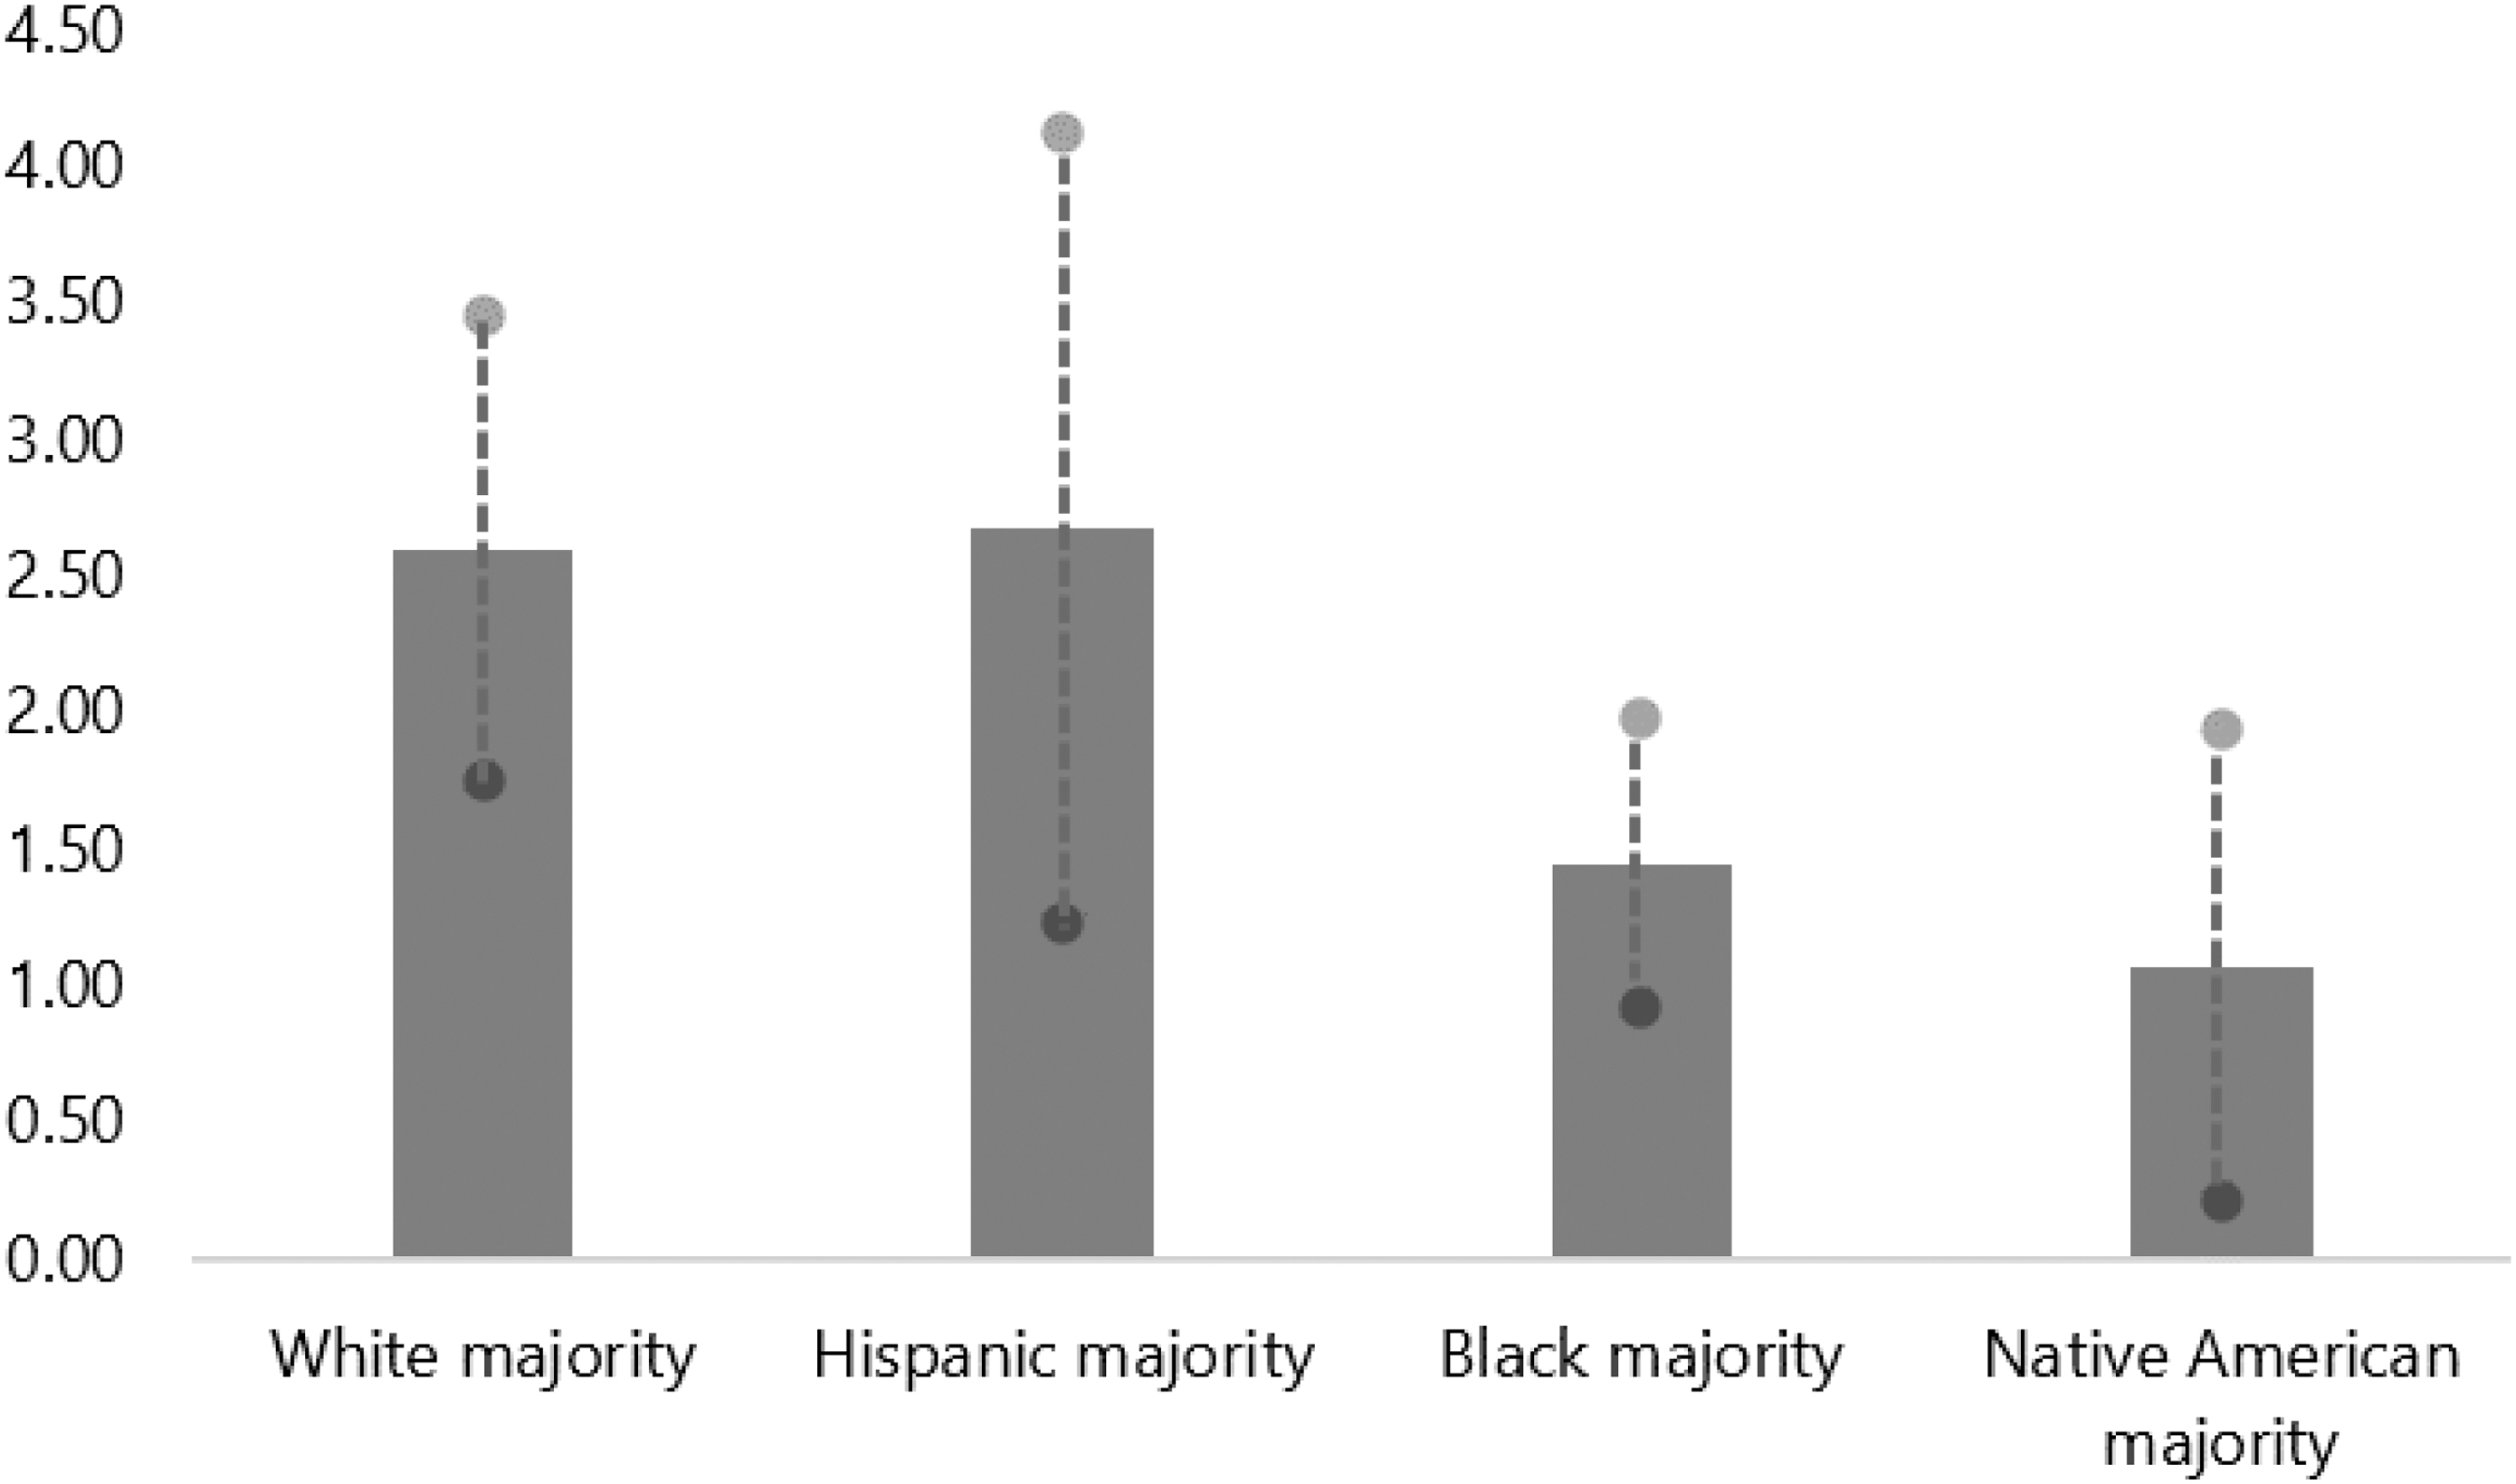
Race, ethnicity, and green job intensity
Figure 2 reveals large green job disparities by race, although not by ethnicity. Counties with Black majorities have lower green job intensity than either White- or Hispanic-majority counties, ranging from about half the green intensity found in Hispanic-majority counties to slightly more than half the green intensity in White-majority counties. Disparities are even larger for Native American-majority counties, where green intensity is about one-third the intensity in White- and Hispanic-majority counties and about two-thirds the level in Black-majority counties. It is possible that this is a reflection of the high concentration of jobs associated with wind and solar energy production in California, Florida, and Texas (Gerdes, 2020), which are also states with large Hispanic populations; the green job intensity is highest in Hispanic-majority counties where it averages 2.68 percent.
White-majority counties have nearly the same average green intensity as Hispanic-majority counties, at about 2.60 percent. However, the two standard deviation band around the average green intensity (shown by the dashed line in Figure 2) is shorter in White-majority than Hispanic-majority counties. The two standard deviation band around the average typically contains 95 percent of the observations around the average. Therefore, while 95% of White-majority counties have green intensity between 1.75 and 3.45 (the White-majority average green intensity minus and plus two standard deviations respectively), 95% of Hispanic-majority counties have green intensity between 1.23 and 4.13. This means that the green intensity in Hispanic-majority counties are spread out around the average much more than in White-majority counties, and therefore that the average green intensity of 2.6 is somewhat less representative for a typical Hispanic-majority county than for a White-majority county.
Black-majority counties have a green intensity of 1.45 percent and the smallest dispersion of green intensity, indicating that many Black-majority counties have green intensity clustered around this lower average. Finally, Native American-majority counties have the lowest green job intensity of 1.08 percent, albeit with high dispersion around this mean.
Educational attainment is also likely to be associated with disparities in green intensity. The O*NET database computes the extent to which 35 distinct skills are used in two-digit SOC occupations. Grouping these skills broadly into those associated with social, fundamental, analytical, managerial, and mechanical skills, green occupations are found to place greater importance on proficiency in analytical skills, particularly mathematics, systems analysis, and system evaluation skills (Kochhar, 2020). Since such skills are typical of higher levels of education, it is likely that a county with higher educational attainment has higher green job intensity. Figure 3 presents the average green intensity associated with three broad groups of educational attainment.
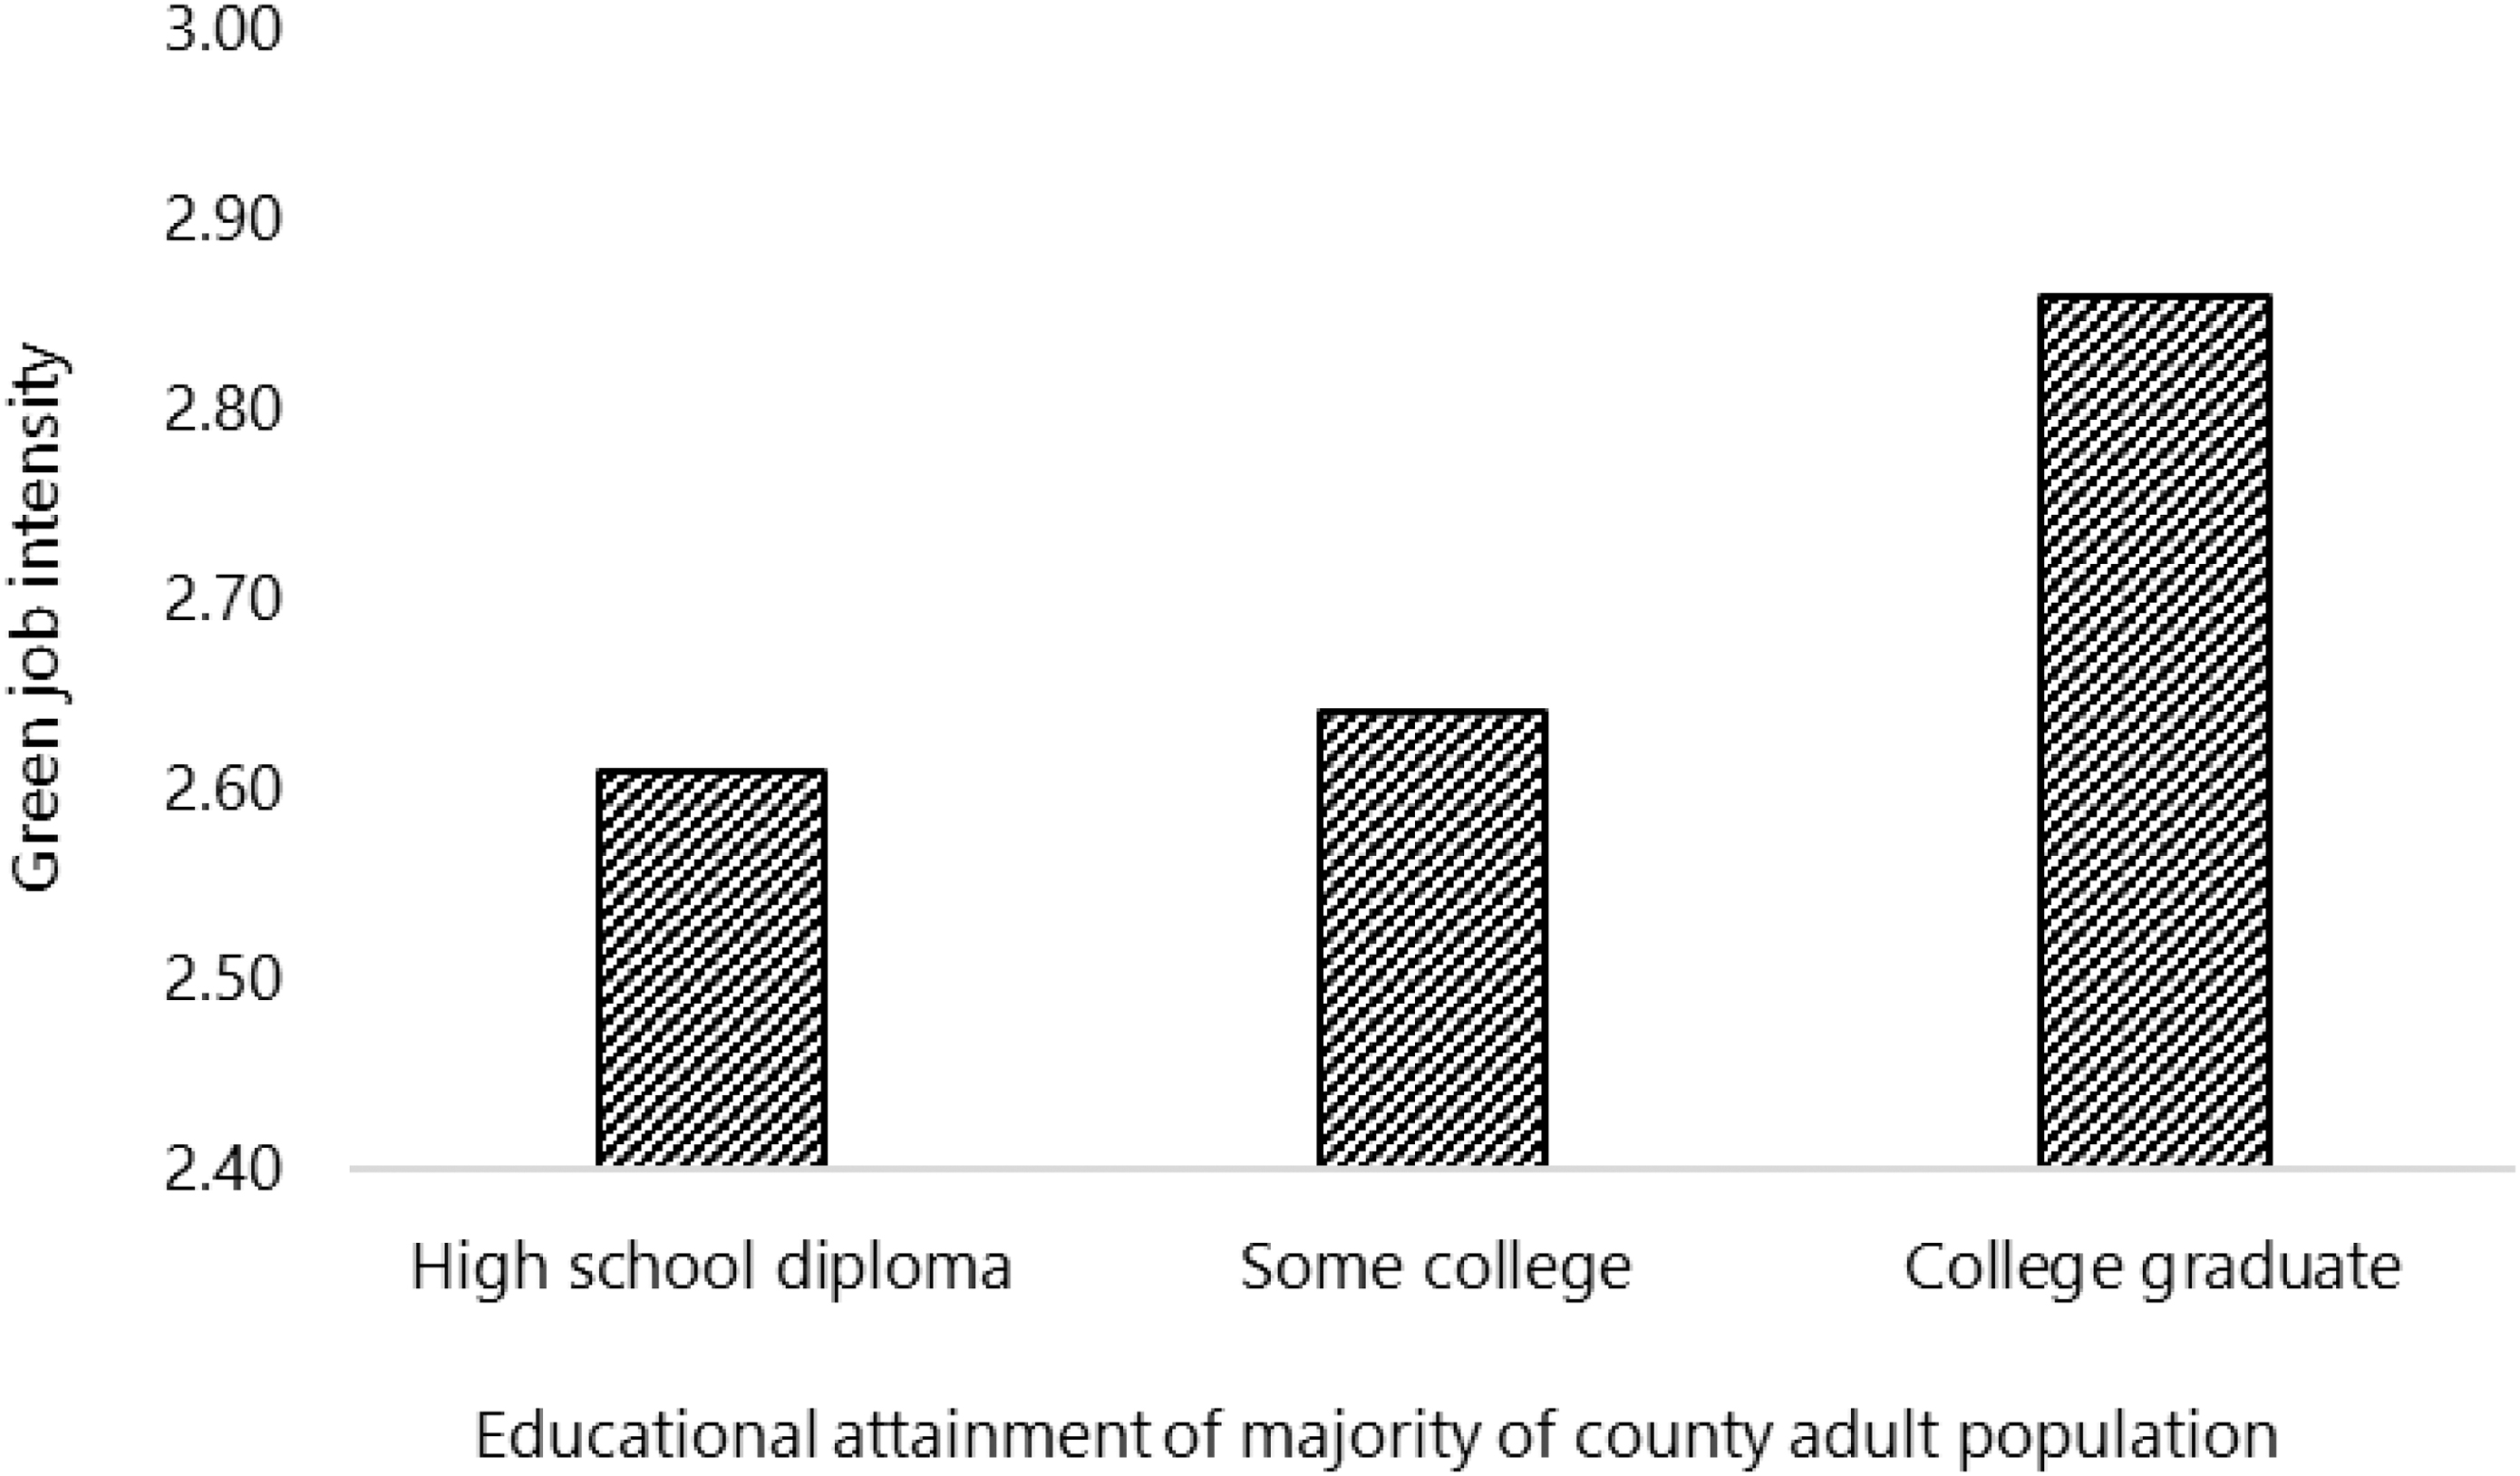
Green job intensity by educational attainment
Comparing green intensities by educational attainment indicates that as the county share of workers with higher educational attainment rises, so does the average green intensity of jobs. The green job intensity in counties where a majority of the adult population has only a high school diploma or less is 2.61 percent, which is only slightly lower than the average green intensity of 2.65 percent in counties where the majority has some college education. However, in counties where a majority of the adult population has a four-year college degree or more, the average green intensity is significantly higher at 3.6 percent.
Due to the long-established causal link between educational attainment and income, as reviewed by Pscharopoulos and Patrinos (2018), Figure 4 suggests that green job intensity is also likely to vary systematically with income. As shown in the figure, whereas the average green job intensity is 1.78 percent in counties with an annual median household income under $35,000, the average rises to 2.25 percent in counties where income is between $35,000 and $44,999. For counties where the median household income is greater than $75,000, the mean green intensity is nearly double that of the lowest income bracket, at 3.18 percent. The illustrative evidence in Figure 4 corroborates the hypothesis that the higher educational requirements of green occupations lead counties with greater green job intensity to also have higher average incomes.
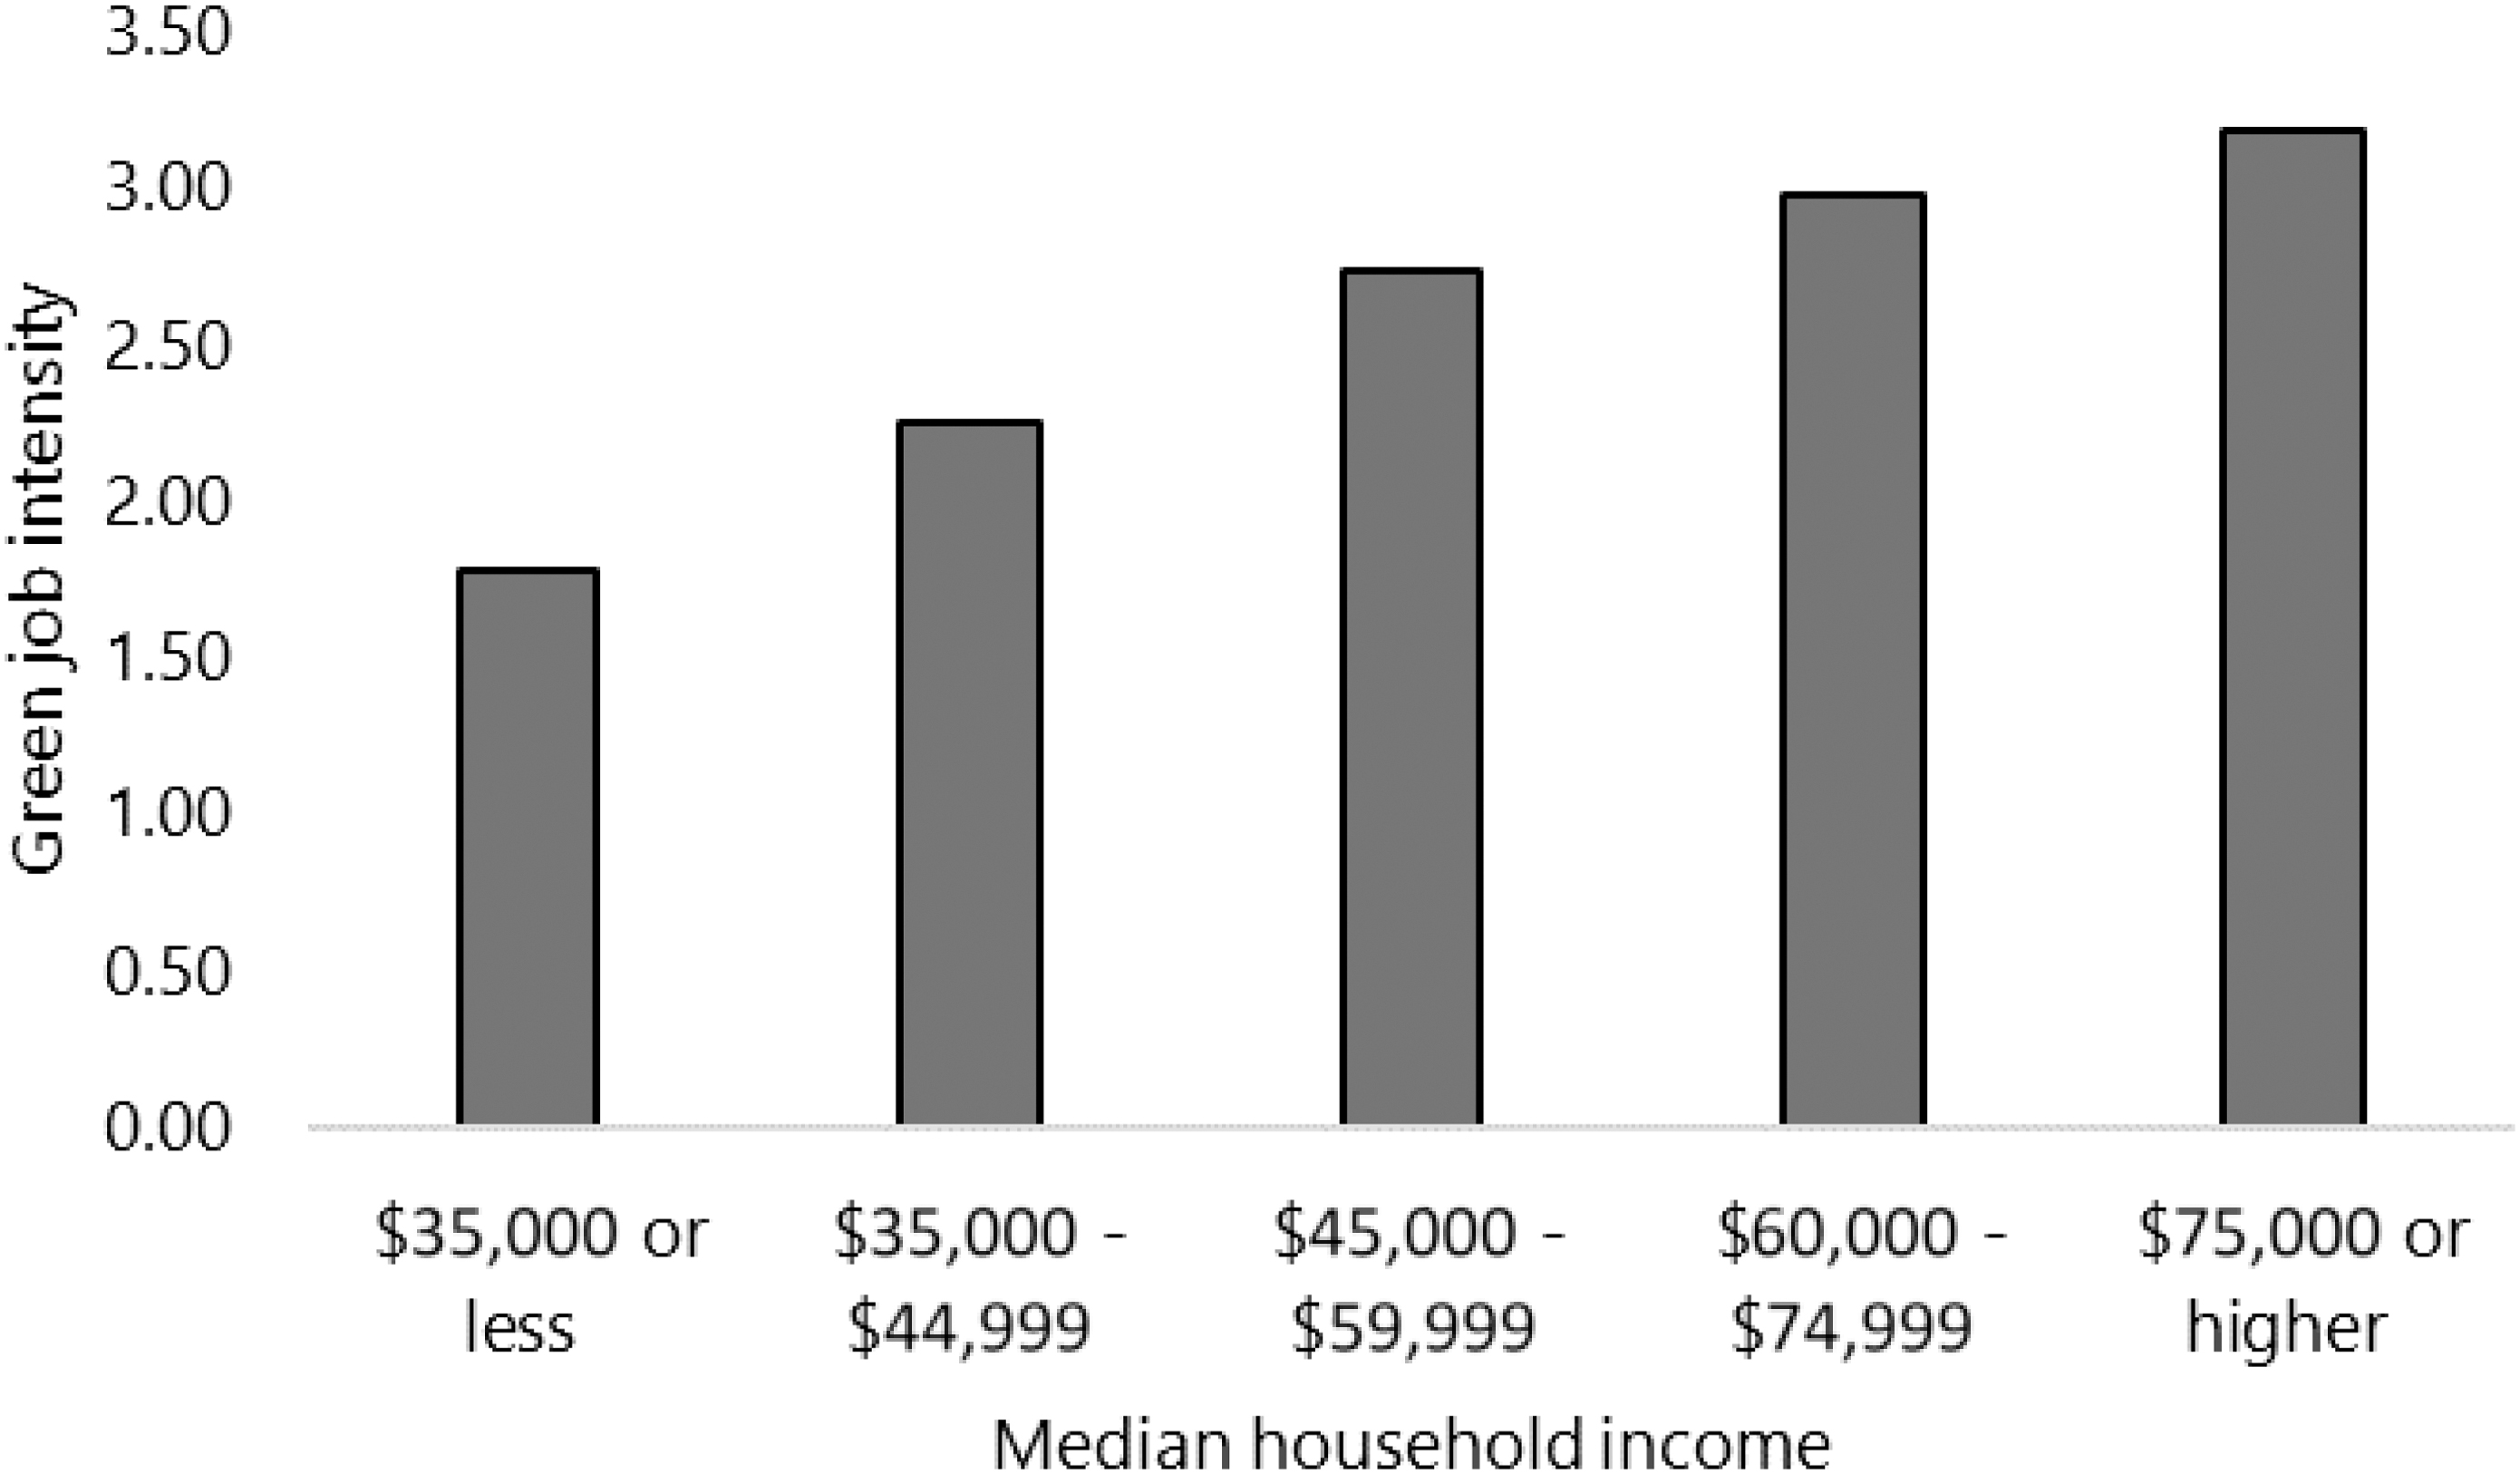
Disparities in green job intensity by income.
The US Census Bureau's rural-urban designation for commuting areas is used to explore whether green job intensity varies with the degree of urbanization (Figure 5). According to O*NET (2021), green jobs are present in both rural and urban settings. Green occupations arise as well in agriculture and farm products as on-site installers of wind turbines and solar photovoltaic panels, which are more likely to be found in rural areas. However, these jobs also include clean-energy engineers, industrial ecologists, and energy brokers who are more likely to reside in urban areas. Thus overall, rural counties on average have lower green job intensity than urban counties.
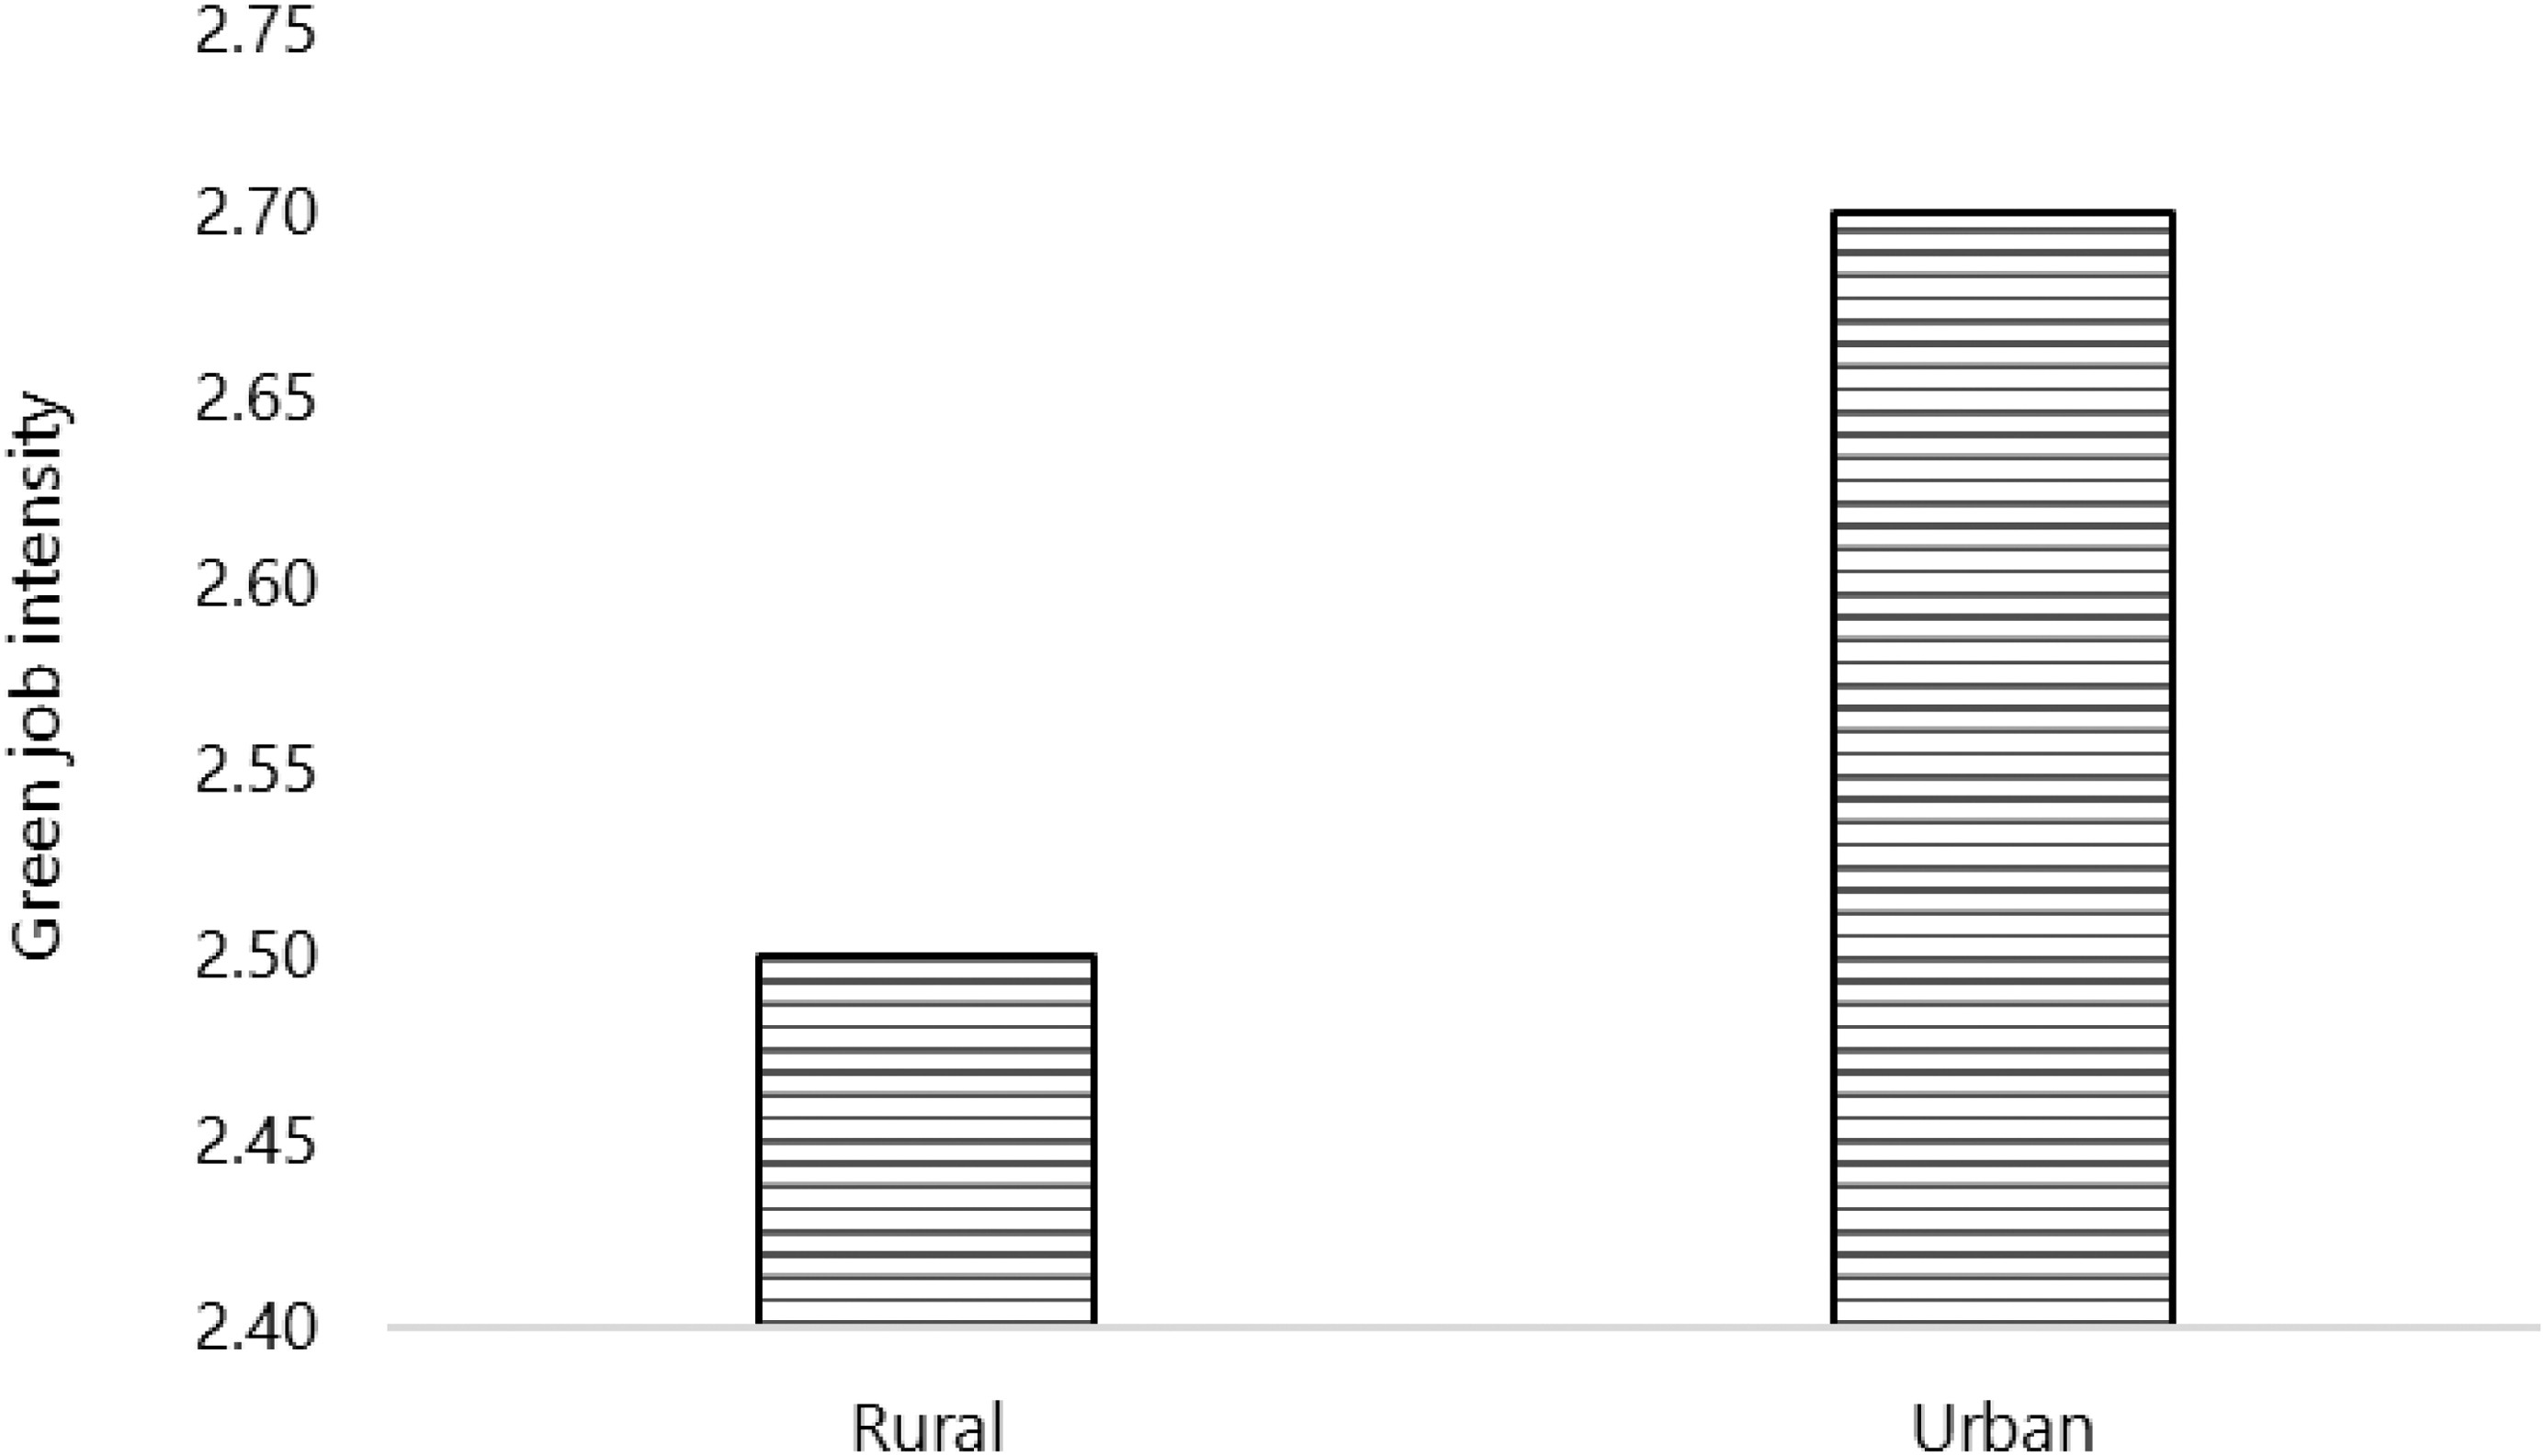
Green job intensity by extent of county urbanization
The stylized facts presented suggest there are significant disparities in green job intensity that disadvantage counties that are Black- or Native American-majority, that have lower educational attainment, and that are rural. These stylized findings are the first known to connect the disparities in green job intensity with socioeconomic characteristics such as race, education, and rural domicile within US counties.
Analyzing the data systematically using multivariate regression analysis allows for more precise identification of the distinct roles of race, ethnicity, education, and domicile on green job intensity. It has been widely documented that minorities have lower educational attainment (Psacharopoulos & Patrinos, 2018). Therefore, while Figure 2 points to low green job intensity in counties that are Black- or Native American-majorities, it could be the case that the low green intensity in these counties is not due to race per se but due to low educational attainments in these counties, which, coincidentally, are also inhabited by a majority of Black and Native American individuals. Regression analysis addresses such confounding effects by allowing for analysis of the direct impact of racial and ethnic majorities on green intensity while controlling for the effects of educational attainment, rural domicile, and other factors.
Regression Analysis
To analyze how the racial and ethnic composition of a county affects green job intensity, estimates for variations of the following multivariate regression were used:
where green denotes green job intensity, the index i (i=1,…, 3,041) indexes the counties, and X includes socioeconomic and demographic covariates such as educational attainment and rural domicile as well as state fixed effects.
In the data obtained, educational attainment in each county is divided into three mutually exclusive groups (as shown in Table 1): the share of county residents whose maximum education is high school or less (“% high school diploma”); the share whose maximum education is more than high school but less than four years of college (“% some college”); and the share who have four years of college or more (“% college graduate”). In every county, the sum of these categories adds up to 100 percent. To avoid perfect multicollinearity of the educational variables, the regressions use “% high school diploma” and “% college graduate,” leaving “% some college” as the left-out category.
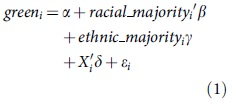
To empirically study how the racial and ethnic composition of a county is associated with green job intensity, a series of dummy variables was created, as shown in equation (1). These variables are subsumed in “racial majority,” which represents the racial majority of a county, and “ethnic majority,” which denotes the ethnic majority of the county. As noted, within the 48 contiguous states and the District of Columbia, there are no counties with either Asian or Pacific Islander majorities. Furthermore, the data only distinguish ethnicity by Hispanic and non-Hispanic groups. Therefore, the analysis of each of the 3,048 counties is either Black, Native American, or White in terms of its racial majority, and Hispanic or non-Hispanic in terms of its ethnic majority.
Racial and Ethnic Strong Majorities
Following Sunter et al. (2019), there are two approaches in defining county racial and ethnic majorities. The first is strong majorities which Sunter et al. (2019) define as counties where greater than 75 percent of the population self-identifies as the same race or ethnicity.We estimate the regression shown below in equation (2):
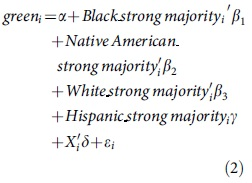
Table 3 reports results from a multivariate ordinary least-squares regression of equation (2) with Huber-consistent standard errors using the command “reg” with the option robust in Stata version 17. First separate regressions were estimated for each racial and ethnic strong majority group, and then all strong majorities were combined in a single regression. For each racial or ethnic group, regressions were first estimated with just a dummy variable of strong majority on green intensity; then education and rural designation were added, followed by the addition of state fixed effects. The regressions with state fixed effects are considered as the most informative as they control for the full set of county socioeconomic, demographic, and unobserved state characteristics. State fixed effects, as defined in Hsiao (1996), are dummy variables (one per state) that absorb constant attributes of states.
Green Job Intensity and Racial/Ethnic Strong Majorities
Note. Robust standard errors are shown in parentheses. Strong majorities are defined as populations where greater than 75 percent of the population self-identifies as a particular race or ethnicity. The left-out variable for educational attainment is “% some college”; dollar liabilities are dollar liabilities to cross-border banks. AE, EM, and DE are classified as per the IMF classification (see Table S3). Standard errors are clustered by country. Rural is a dummy variable and=1 if the county is rural. Columns 3, 6, 9, 12, and 13 use state fixed effects.
p<0.01
p<0.05
The Black-strong majority data in the first set of columns (1, 2, and 3) consist of results with a dummy variable. The negative and statistically significant coefficients indicate that counties with a strong Black majority have lower green intensity. The estimated coefficients decline from -1.19 in column 1 to -1.15 when controls are added for education and rural counties in column 2, and then reduces further to -0.78 in column 3 when state fixed effects are added. This suggests that green job intensity in part reflects intrinsic state-to-state differences that affect the availability of green occupations. The coefficient estimate on Black strong majority in column 3 indicates that relative to a Black-minority county, a Black-strong majority county is associated with reducing green job intensity by 0.78 percentage points. This is a large impact, equal to nearly one standard deviation of county-wide green intensity (see Table 2).
Rural counties are consistently negatively associated with green job intensity as well. While a larger share of high school graduates is associated with less green intensity (column 2), this result loses significance when state fixed effects are added as the share of college graduates is never statistically associated with higher green intensity. This suggests that the association of college graduates with higher green intensity (see Figure 3) may reflect that college graduates are predominantly non-Black.
Analogous results with a dummy for Native American-strong majority are presented in columns 4, 5, and 6 in the second dataset. The results on the dummy variable are qualitatively similar to that of the Black-strong majority, but the Native American group has a greater negative magnitude. In particular, in column 6, which includes state fixed effects, the coefficient indicates that relative to a county where Native Americans are in a minority, a Native American-strong majority county is associated with green job intensity that is lower by more than 1 percentage point.
The estimated coefficients of the rural dummy in columns 4, 5, and 6 are consistently negative and statistically significant, even in the presence of the dummy variable for Native American strong majority. Educational attainment and state fixed effects confirm that a rural domicile is a distinct factor associated with lower green intensity. Education does not show a robust association with green intensity (columns 4, 5, and 6).
By contrast, none of the estimates on the dummy variable for White-strong majority (columns 7, 8, and 9) is statistically significant. While the share of high school graduates is negatively associated with green job intensity (column 8), it loses significance when state fixed effects are added to the regression. The rural dummy variable is the only consistently negative and statistically significant variable for the White-strong majority regressions. Since rural communities in the United States consist predominantly of White rather than minority communities, as reported by the US Department of Agriculture (2021), the results are suggestive—though not conclusive—that for White populations, the availability of green occupations is mostly dependent on whether they are rurally domiciled.
There was no evidence of ethnic disparities in green intensity. Columns 10, 11, and 12 report results with a dummy variable for Hispanic-strong majority populations, which are never statistically significant. Education is not a robust driver of green intensity, as can be seen in columns 10, 11, and 12) either, although the rural dummy is once again consistently negative and significant.
Finally, when dummy variables for White, Black, Native American, and Hispanic strong majority are included all together (column 13), Black and Native American strong majority retain statistical significance, and quantitatively they remain very close to their estimates in, respectively, columns 3 and 6, while the White and Hispanic strong majority remain statistically insignificant. The estimated coefficient on the rural dummy variable also remains negative and statistically significant. Taking all the results together, Table 3 demonstrates a robust finding of racial disparities in green job intensity that disadvantage Black- and Native American-strong majority counties, even after adjusting for education and rural domiciles.
Racial and Ethnic Simple Majorities
Following the second approach of Sunter et al. (2019), simple majorities (or just “majority”) of race and ethnicities are considered. Under this definition, counties in which greater than 50 percent of the population self-identifies as the same race or ethnicity have a majority. We estimate the regression shown below in equation (3):
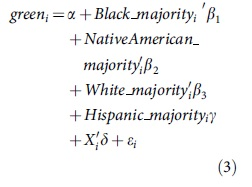
Re-estimating the regressions in Table 3, the strong majorities in race and ethnicity are replaced with simple majorities as defined, and no other changes. These results are reported in Table 4. This table is designed to explore whether counties that have a racial majority, but are nevertheless less racially concentrated than counties with racial strong majorities, are less disadvantaged in access to green occupations. The results provide strong evidence that counties that have Black or Native American majorities—but not strong majorities—have less negative association with green-job intensity. That is, counties with simple majorities of Black or Native American residents—which therefore also have a larger number of White populations compared to counties with Black and Native American strong majorities—tend to have relatively more green jobs than counties with strong majorities of racially disadvantaged populations.
Green Job Intensity and Racial/Ethnic Majorities
Note: Robust standard errors are shown in parentheses. Table 4 differs from Table 3 in the use of majorities, rather than strong majorities, in the independent variables. Majorities are defined as populations where greater than 50 percent of the adult population self-identifies as a particular race or ethnicity. The left-out variable for educational attainment is % some college. Rural is a dummy variable and=1 if the county is rural. Columns 3, 6, 9, 12, and 13 use state fixed effects.
p<0.01
p<0.05
p<0.1
A comparison of columns 1, 2, 3, 4, 5, and 6 on Table 4—corresponding to Black and Native Americans—with the same columns in Table 3, shows that the coefficient estimates in Table 4 remain statistically significant, but their magnitude drops by more than half relative to Table 3. That is, counties with Black and Native American strong majorities are associated with much lower green job intensities than counties with Black and Native American simple majorities. While Table 3 implies that, compared to a Black-minority county, a Black-strong majority county would have a 0.78 percentage point lower green intensity, Table 4 indicates that a Black-majority county has only a 0.26 percentage lower green intensity. Analogously, compared to a county with a Native American minority, a Native American strong majority has a 1.26 lower green job intensity, but a Native American majority has only 0.49 lower green intensity.
As with Table 3, in no regression are the estimated coefficients of White and Hispanic majorities statistically significant at conventional error levels; the coefficient of the share of high school graduates is statistically significant only in regressions without state fixed effects; and the rural dummy variable is consistently negative and statistically significant in all estimated regressions. The overall evidence indicates that as county Black or Native American populations become exceedingly concentrated so as to achieve “strong majority,” the prevalence of green jobs becomes much smaller.
Conclusion
This study shows evidence of racial disparities in the availability of green occupations—measured as the green job intensity—even after controlling for educational attainment, lack of urbanization, and intrinsic differences across states in resources available for the green transition. Relative to counties where Blacks and Native Americans are minorities: 1.) Black- and Native American-majority counties have lower green job intensity by, respectively, 0.26 and 0.49 percentage points; and 2.) Black- and Native American-strong majority counties have even lower green job intensities, by 0.78 and 1.27 percentage points, respectively. These are large disparities, considering that the county green job intensity averages 2.6 percent with a standard deviation of 0.89 percent. By contrast, ethnicity does not appear to be systematically associated with green job intensity. Overall findings suggest that policies targeted to enhancing or acquiring skills needed in green jobs are urgently needed in socially disadvantaged racial communities to ensure that the green transition is just and inclusive.
Interestingly, when the regressions account for unobserved state-wide differences—which are likely to include green economy resources available to businesses for adaptation or to workers for training—racial disparities become noticeably smaller. This suggests that state policies, such as subsidies for enhancing or acquiring skills for green occupations, tax credits for clean-energy investment, and assistance to facilitate worker mobility across sectors and occupations may be able to play a role in ensuring a just transition for all segments of the labor market as the greening of the economy gets strongly underway.
Future work can improve on this research in a few ways. The empirical analysis regresses green job intensity of a county on the racial and ethnic majorities in the county, the educational attainment of the county population, the share of counties that are rural, and state fixed effects. One limitation of this study is that it does not control for the prevailing skills in the county or the available infrastructure, both of which could determine the available green jobs in the county. In particular, Marin and Vona (2018) find that green jobs are more likely to locate in areas that have high-tech clusters and research laboratories, have a stronger propensity to innovate, and have a greater-than-average share of employment in high-tech manufacturing and knowledge-intensive services. This study partially captures these county characteristics with the education and rural variables. However, to the extent that these county features are not fully captured in the regression, they may act as omitted variables that bias the estimated coefficients. More analysis is needed to explore the role of these additional county characteristics.
Following up on insights from this research, future work should consider a deeper analysis of other potential reasons for low green job intensity in racially disadvantaged populations. These may involve complex aspects of both the supply of—as well as the demand for—green jobs by minorities. Considering that some green occupations—such as solar panel and insulation installers, boiler workers, and some construction labor—are low-paying jobs with little opportunity for advancement, some research contends that minorities self-select into non-green jobs that have relatively higher pay (Martinson et al., 2010).
If this is the case, then it is not apparent that training programs that seek to impart green job skills to ensure a just transition will necessarily lead minorities to choose jobs with higher green intensity. However, two influential reports (Taylor, 2014, 2018) contend that there is, in fact, proven interest in green jobs by minorities, but that there is little effort to recruit and retain minorities into well-paid green jobs. Future work should endeavor to provide a richer understanding about the reasons for racial disparities in green jobs so that federal, state, and local governments can tailor policies to support a just transition.
Footnotes
Authors' Contributions
Samuel Kuersteiner: Review and editing (equal); empirical analysis (equal); tables and figures (lead); writing original draft (supporting); methodology (supporting).
Hailey Ordal: Methodology (lead); writing original draft (lead); review and editing (equal); empirical analysis (equal); tables and figures (supporting).
Funding Information
There was no funding provided for this study.
Author Disclosure Statement
No competing financial interests exist.