




Abstract
This article evaluates the presence of innovative technologies and maturity levels in an eco-industrial park focused on energy and material recovery. The park comprises four entities as follows: a central company and three manufacturing units specializing in energy and material waste recovery. This study proposes a measurement model supported by following four constructs: innovative technologies, maturity level, energy recovery, and materials recovery. Each construct is evaluated through four categorical indicators. The assessment involved five managers and practitioners using a five-point Likert scale. The primary findings highlight a notable deficiency in the application of innovative technologies and a need for digital maturity in the park management body. Furthermore, the study reveals that material recovery holds greater significance and exhibits higher performance compared with energy recovery in the park’s operational strategy. In conclusion, the study suggests a series of strategic actions to enhance the application of innovative technologies and elevate the maturity level of management, thereby addressing the identified deficiencies.
Introduction
In modern manufacturing, digital transformation initiatives are key elements to progress (Wang et al., 2016). Such initiatives involve automation systems that utilize cutting-edge hardware and software technologies to manage the creation, capture, transmission, storage, and processing of vast amounts of data (Klingenberg et al., 2019). Data analysis is critical to gaining insight and knowledge (Lee et al., 2015), which is the reason why many industries recognize the need to adopt advanced digital solutions to optimize, adapt, and align their processes and activities (Erhun et al., 2021).
Fourth-generation technologies enable real-time tracking and analysis of product life cycles and transportation with multiple supply chain partners (Kumar et al., 2022). Supplier management involves monitoring carbon footprints and ensuring compliance with environmental regulations (Yu et al., 2022), which impact competitiveness and value creation (Kiel et al., 2017). Innovative technologies can improve both efficiency and effectiveness and help maintain or elevate organizational performance levels by supporting decision-making processes (Jordan and Mitchell, 2015). However, choosing technological solutions requires digital maturity to ensure compatibility with existing and future physical and digital components (Kumar et al., 2022).
The widespread adoption of digitalization and automation has the potential to enhance industrial processes, leading to greater efficiency and effectiveness. Currently, digitalization and automation are crucial for maintaining competitiveness in modern industry (Sarc et al., 2019). As a result, technology has become a key component in driving businesses forward, particularly when it comes to cost reduction and environmental sustainability (Klingenberg et al., 2019). Furthermore, the complexity of technological solutions means that implementation and maintenance can take time and effort, which may be foreseen in strategy planning (Kumar et al., 2022).
Specific to businesses, it is becoming increasingly important to consider not only the economic but also the sustainable and social aspects of operations (Ghisellini et al., 2016). Legal requirements and customer corporate image concerns are also driving changes in commercial dynamics (Lin et al., 2016). Incorporating sustainability principles into smart manufacturing can help businesses secure long-term competitive advantages (Dikhanbayeva et al., 2020), which means focusing on energy efficiency and reducing carbon footprint to meet sustainable requirements (Adiansyah et al., 2021). Such initiatives include transitioning to a circular economic model instead of a linear one (Dantas et al., 2021). Rajput and Singh (2019) explored how the circular economy and Industry 4.0 are connected in the context of supply chain management. In China and other parts of Asia, there has been a significant increase in economic circularity and recycling of end-of-life waste (Manaf and Abbas, 2021).
Eco-industrial parks (EIPs) are one of the alternatives that businesses can use to operationalize circular practices involving materials, energy, and information. By exchanging energy and solid waste and supported by integrated information systems, companies can achieve low-carbon operations and increased efficiency. EIP is an innovative approach to industrialization that aims to achieve a balance between economic growth and environmental protection (Agrawal et al., 2022). Industrial symbiosis, which involves partnerships among companies to repurpose waste and energy, is also gaining traction in EIPs’ strategies (Gil et al., 2021), influencing the transition toward circular practices (Ciliberto et al., 2021). Maturity models can provide a structured approach for monitoring technological development and identifying organizational capabilities that align with digital transformation objectives. By aligning organizational maturity levels with strategic planning, organizations can maximize the efficiency and performance benefits of innovative technologies (Vinayavekhin and Phaal, 2020).
The successful implementation of digital technologies can be decisive for the development and sustainability of EIPs (Zeng, 2021). EIPs are complex systems that involve multiple interconnected industries that can greatly benefit from digitalization and smart automation. With the help of advanced digital technologies, EIPs can achieve a high degree of efficiency and effectiveness in their operations (Zhou et al., 2018). The benefits of Industry 4.0 technologies in EIPs are manifold. Data-driven decision-making can help EIPs optimize their processes and improve their productivity (Lyu et al., 2022). Predictive maintenance can help prevent unplanned downtime and reduce repair costs (Alnaqbi et al., 2024). Energy management and resource optimization can help EIPs to reduce their energy consumption and carbon footprint (Chen et al., 2018). Finally, regulatory compliance can be achieved more easily and efficiently with the help of digital tools and automation (Tran et al., 2023).
Even if numerous studies have highlighted the link between digital technologies and the circular economy, more literature is necessary concerning companies’ readiness to share information and their eagerness to engage in projects that embrace cutting-edge technologies. This gap centers on companies’ hesitation, which is mainly due to the perceived vulnerabilities compounded by the associated expenses and uncertainties surrounding the return on investment. Bain et al. (2010) have also explored comparable obstacles. The study focuses on determining a cause-and-effect relationship between six key factors that enable the integration of Industry 4.0 and the circular economy within the supply chain and four challenging factors that hinder it. The study highlights the role of AI technology in bridging the gap between the two areas. However, it also cautions that the automated synergy model is one of the primary obstacles preventing the successful integration of 4th generation technologies and industrial symbiosis.
Given the above-identified research gap and the delineated context, the purpose of this article is to evaluate the presence of innovative technologies and maturity levels in an EIP focused on energy and materials recovery. The research question is: How can the presence of innovative technologies and maturity levels in an EIP dedicated to energy and material recovery be measured? The research method is qualitative modeling. The research subject is an EIP located in the southern region of Brazil, where the anchor or focal company oversees the operations of three additional manufacturing entities. The main findings are that in the studied EIP, materials recovery and implementation of digital technologies have high performance, whereas maturity level and energy recovery have low performance.
The modeling procedure involves two key steps. First, constructs derived from the literature were identified and subsequently broken down into indicators. Second, experts evaluated these indicators, expressing their opinions on the importance and performance of each indicator. Each indicator was gauged using a Likert agreement scale. The importance of each indicator may vary based on the influence it exerts on the construct and the impact the construct has on the top term. According to Schaefer et al. (2021), in strategic studies involving subjectivities such as preferences and opinions, categorical variables should be measured according to a Likert scale with a central point to offer balanced options to the respondents. This article delves into four key constructs as follows: innovative technologies, maturity level, energy recovery, and materials recovery. The subsequent sections of this article are methodologically structured, beginning with theoretical model presentation, followed by results, discussion, and final considerations.
Measurement Model: Theoretical Derivation
Innovative Technologies
The fourth industrial revolution is commonly identified as the era characterized by the integration of transformative technologies, particularly intelligent production systems. This shift in paradigm relies on a seamless fusion of information and communication technologies, Cyber-Physical Systems, the Internet of Things (IoT), cloud computing, artificial intelligence (AI), and big data analytics. This convergence of technologies is strategically positioned to meet the modern and ever-changing demands of the market while simultaneously improving production efficiency (Lee et al., 2015).
Industry 4.0 technologies can be categorized based on their functions concerning data (Chen et al., 2018). Use a framework to elucidate the organizational structure of Industry 4.0 technologies according to their functionalities (Klingenberg et al., 2019). The authors classified 64 technologies into four groups as follows: data generation and capture, data transmission, data storage and processing, and application. Paradoxically, technologies demonstrating the highest value creation potential, particularly those applying data to formulate innovative solutions, are infrequently discussed in the literature. An illustrative instance showing the capacity to comprehensively integrate all entities within the value chain, encompassing sustainability data, chains, and processes across business functions and accounting perspective through advanced digital technologies of Industry 4.0, is exemplified by the sustainable enterprise resource planning systems (Chofreh et al., 2014; Olsen, 2022).
The category of data collection, capture, and generation technologies is the most concentrated in terms of diversification. This group plays a distinctive role, functioning as transducers that transform signals from one physical quantity to another, either digital or analog. Electronic equipment with specialized instrumentation can interpret these signals (Lin et al., 2017). According to Roy et al. (2016), one important skill in advanced manufacturing systems is real-time data generation and capture. The generation and capture of data are the first indicators of the measurement model this study poses (A1).
Another important skill is transmission. In the transmission stage, a variety of technologies come into play, including IoT for devices connected to the internet. However, consensus on the definition of IoT is still being established in the literature, as noted by Atzori et al. (2017). Other technologies in this stage operate primarily in networks, both wired and wireless, such as wireless technologies and the internet itself. The main goal of this stage is to transmit data or information. Therefore, transmission is the second indicator (A2) of the model.
The conditioning, storage, and processing stage encompasses various technologies, with a particular emphasis on systems, such as cloud computing. Within this category, conditioning systems may undertake data filtration or grouping processes prior to subjecting it to algorithmic processing, simulation, and analysis through artificial intelligence (Lin et al., 2017). According to Klingenberg et al. (2021), during this phase, the conversion of data into meaningful information is executed, which justifies using storage and processing as the third indicator (A3).
Finally, application technologies encompass intelligent products, robots, artifacts, services, and smart manufacturing. This diversity manifests in various ways, such as the realization of heightened quality and superior production efficiency with reduced energy consumption, thereby adding value to the gathered information (Chen et al., 2018). At this operational layer, the utilization of this knowledge becomes instrumental for decision-making and problem-solving. For instance, intelligent vehicles leverage endogenous knowledge to make decisions and in smart factories, robots, and machines execute precise activities. Smart entities are also capable of self-diagnosing failures, predicting potential issues, or autonomously suggesting preemptive measures based on a knowledge-driven manufacturing approach (Liu et al., 2017). Closing the construct, the application is the last indicator (A4).
Digital Maturity
The impact of technological advancements has become increasingly apparent, with many companies deeply invested in the transformation process (Benhamou et al., 2023). The fourth industrial revolution, or digital transformation Industry 4.0, has revolutionized organizational strategies in numerous ways. These transformative technologies have the potential to enhance and streamline a variety of domains, such as waste management, but only if a company’s readiness for digitalization is thoroughly assessed (Sarc et al., 2019).
It is necessary to enhance workforce training through incentivizing measures that increase knowledge to prepare for the shift to digital technologies. This enhancement not only aligns with sustainability goals but also equips employees to navigate evolving technologies with ease. It is essential to identify the current and future capabilities of companies, mainly related to the workforce and the corporative culture, in a changing landscape (Akyazi et al., 2022). Therefore, people and culture are the first indicators of the second construct (B1). Sarc et al. (2019) stress the relevance of reallocating internal resources to enhance the capacity to migrate to digital and automated production systems to maintain competitiveness in today’s manufacturing industry. Therefore, readiness for Industry 4.0 is the second indicator of the second construct (B2).
One way to identify the current and future capabilities is through maturity assessment models, which provide successful transformation roadmaps from traditional industries to Industry 4.0. For example, Yu et al. (2022) analyzed 12 existing maturity assessment models that aim to support technological transitions. Meanwhile, research by Wagire et al. (2021) advocates for a maturity assessment focused on technology, including seven dimensions. The most critical factor in shaping the Industry 4.0 vision is the technical and organizational structure or capacity of the company. Based on Wagire et al. (2021), the third indicator of the second construct (B3) is strategy and governance.
Schumacher et al. (2016) support the relevance of managing strategy and governance in digital implementations, adding additional dimensions that overlap with those of Wagire et al. (2021). The perspective of Schumacher et al. (2016) includes products, customers, operations, and technology as fundamental concepts, as well as strategy, leadership, governance, culture, and people for organizational aspects. Each dimension is further broken down into several subitems to provide a comprehensive evaluation of Industry 4.0 maturity. The practical applicability has been validated through testing in multiple companies. Therefore, the fourth indicator in the second construct (B4) is products, value chain, and process.
Energy and Materials Recovery
Previous studies underscore the global pursuit of zero emissions, emphasizing high energy generation efficiency and transformative initiatives in countries such as China, which grapple with challenges in meeting their commitments to the Paris Agreement. Despite endeavors to incorporate CO2 capture elements (Manaf and Abbas, 2021) and direct utilization of renewable energy sources (Adiansyah et al., 2021), scholars caution that substantial efforts are imperative to achieve complete emission reduction.
The first aspect to be considered in the measurement model is energy recovery. Industries such as cement and steel can improve their performance by adopting a resource-efficient approach. This approach can be done by utilizing solid waste and surplus energy obtained from partner companies as raw materials and secondary fuel (Sellitto et al., 2013). Reuse can rely on several types of solid and energy waste. Biogas generation through the energy recovery of surplus materials from the food industry using anaerobic digesters is one sustainable avenue for energy production (Loureiro et al., 2021). Cogeneration using sugarcane bagasse is another way to generate high-quality electrical energy. Hybrid systems with heat exchange (Gil et al., 2021) from steam dryers can also reduce the demand for heating surface areas by up to 20 percent (Chantasiriwan, 2021). Finally, recycling waste from agri-food supply chains (Sellitto and Hermann, 2016) or discarded household equipment can also help optimize industrial activities and productive resource efficiency (Gunarathne et al., 2020). Therefore, the four indicators of the third construct are biomass (C1), heat (C2), fluids (C3), and efficiency (C4).
The last aspect to be considered in the measurement model is materials recovery. One way to recover material is waste reuse. The self-reuse of materials can achieve recovery rates of up to 81 percent. In comparison, collaborative industrial symbiosis efforts can elevate this figure to an impressive 99.5 percent (Bain et al., 2010). Another way is using by-products, such as rice husks, steel swarfs, or steel slag, as raw materials for other industries, such as the cement, machine building, or road pavement industries (Sellitto et al. (2021). According to Sellitto et al. (2013), an efficient logistics network with direct and reverse channels is essential either to reuse waste or to route by-products. Reusing materials or by-products can also achieve material recovery within the same generating company, which may substantially increase manufacturing efficiency by an expressive cost reduction of the supply chain operation (Yu et al., 2014). Based on the above reasoning, the four indicators of the fourth construct are waste reuse (D1), use of by-products (D2), logistics efficiency (D3), and manufacturing efficiency (D4).
Table 1 synthesizes constructs and indicators used in the measurement.
Tree-Like Structure Encompassing Constructs and Indicators
The Research: Methodology and Results
The research went through two distinct stages of development. First, a comprehensive literature review was conducted to identify relevant constructs, followed by an assessment of each construct’s intensity through a case study in an eco-industrial park. The EIP comprises a management or focal coprocessing company and three associated companies engaged in energy, waste, and by-product exchange, generation, and reuse. The metric used takes on a tree structure with general performance as the overarching term and the constructs and indicators from the literature forming the branches. The research methodology used is qualitative modeling. Each indicator of Table 1 was measured using a Likert agreement scale ranging from strongly disagree to strongly agree. The significance of each indicator varies based on its influence on the construct and its subsequent impact on the superordinate term.
The analysis was conducted through in-depth interviews and direct observations during virtual meetings with a group of companies in southern Brazil. These companies work in a symbiotic process and comply with environmental licensing and legal requirements in the country. Some of these companies operate internationally, spanning countries such as Argentina, Peru, Uruguay, the United States, Germany, and Japan, among others. Despite the physical distances, all of these companies function within a symbiotic system that involves waste generators, industries, and recyclers. The interviewees were strategically selected based on their involvement in organizational processes and technology, holding key leadership positions within their respective organizations. Although belonging to the same symbiotic group, the studied organizations operate in diverse activities and productive sectors.
Specializing in the foundry, Company A is a small yet high-risk entity that receives waste with high levels of Zinc from its focal company. This waste is then utilized as raw material in the manufacturing process of Zamac alloys, with the majority of the process material being used to minimize solid waste generation. Any operational failures are addressed by returning the material to the process and remelting it. Zinc oxide is the only thing that is not reused, and it is sent to another state for recycling. The focal company, which is focused on coprocessing, specializes in energy recovery from waste. It extracts the calorific value from waste to transform it into quality fuels, generating clean energy and reducing reliance on nonrenewable natural resources. The company is involved in waste-to-energy processes and handles liquid, solid, or pasty industrial waste of both Class I and Class II categories.
Company B is a new player in the market that aims to take advantage of strategic business opportunities related to Environment Social Governance (ESG) and sustainability. Its main concern is recycling automotive scraps and decontaminating and recycling scraps to provide the main company with raw materials. The company is committed to ensuring economic circularity and carbon market compensation, with the goal of recycling the same amount of steel that is used. It is dedicated to managing, recovering, and properly disposing of waste generated during the production, consumption, and disposal phases of the automotive industry.
Company C is a specialized organization that collects, selects, and processes electrical and electronic waste. They have a great deal of expertise in decontaminating and separating scrap for the purpose of reusing secondary materials. The company is also instrumental in exploring new waste materials and discovering new ways to utilize existing sources of waste.
Three managers and two practitioners, experts in technology, all from the focal company, were asked to reply to the questionnaire. Given the small number of respondents, the outcome of this study can be considered only as a hypothesis for further deeper studies based on surveys investigating strategic aspects in an entire industry, such as the one conducted by Schaefer et al. (2021) in a network of small companies in the same region of this study. Table 2 shows the professional profile data of the respondents.
Professional Profile of Respondents
The respondents replied, informing their degree of concordance to two statements as follows: (i) [Indicator n] is important for the overall operational outcome of the EIP, and (ii) EIP has a high performance in [indicator n]. The responses were recorded on a five-point Likert scale of concordance [agree (1), partially agree (0.75), neither agree nor disagree (0.5), partially disagree (0.25), disagree (0)]. Table 3 shows the answers.
Raw Data Collected from Respondents
Table 4 shows a summary of the results, including the average value for indicators and constructs, the respective differences, and the gaps.
Summary of Information for Analysis
The discrepancy, denoted as a gap, manifests as the difference between the perceived importance of a given indicator and its corresponding actual performance. When this gap assumes a positive value, indicative of a circumstance in which the importance of the indicator exceeds its actual performance, it signifies an inadequacy requiring augmented investment to facilitate performance. Conversely, a negative gap designates an instance where the indicator surpasses its perceived importance, characterizing an excess that, in some circumstances, can be strategically harnessed to restore equilibrium.
Discussion
Strategic movements regarding the performance of the EIP may focus on constructs, as well as indicators. According to Schaefer et al. (2021) and Nara et al. (2019), interventions targeted at a singular indicator may reverberate across others within the same construct, given that indicators within a shared construct are predisposed to exhibit correlations. Consequently, it is judicious to concentrate not only on mitigating deficiencies in individual indicators but also on addressing constructs with the most pronounced disparities. Strategic initiatives beyond constructs with more disparities are expected to yield comparatively limited effects on overall operational performance.
Upon conducting a preliminary examination of construct evaluations, discernible variations in the levels of incongruity between the perceived importance and actual performance are visible. Specifically, CT1 and CT2 exhibit substantial disparities, denoted by gaps exceeding a value of 1, whereas CT3 and CT4 demonstrate moderate disparities, with gaps falling below a value of 1. A gap of approximately one point on a 1 to 5 scale equates to about 25 percent disparity.
Furthermore, it is possible to observe that the absolute performance in CT1 and CT2, innovative technologies, and organization maturity, respectively, is lower than the performance in materials recovery. Energy recovery is not a focus of the EIP, which can be asserted from the low importance attributed by the respondents. One prior conclusion is that innovative technology and organizational maturity should be developed more in the EIP compared with materials recovery.
For instance, prioritized strategic actions should involve implementing a structured program to promote the evaluation of innovative technologies and facilitate technological exchange among members. Such action should contribute to enhancing the performance of the entire CT1. The same could be done regarding CT2. Another strategic initiative should be establishing a systematic schedule of management meetings to foster knowledge exchange and implementing an integrated information system capable of real-time information exchange, generating simulations, and assisting in decision making.
Concerning individual indicators, it is necessary not only to focus on gaps but also on the overall relationship between importance and performance. The ideal scenario envisions the attainment of elevated performance levels in indicators wielding greater influence. In instances marked by constraints on resources, a strategic reassessment may be necessary, prompting a discerning reallocation of resources currently committed to enhancing performance in indicators residing within the excess zone. This strategic reallocation endeavors to reinforce indicators situated in the shortage zone, thereby fostering a comprehensive optimization of resource utilization in alignment with overarching strategic objectives.
One way to assess such a relationship is by a scatter diagram, in which the x-axis is the importance and the y-axis is the performance. In the ideal scenario, the indicators should scatter in a balanced manner along a straight line, with a coefficient of determination R2 close to one. The portion above the diagonal is the excess zone, where indicators exhibit performance levels surpassing their relative importance. Certain indicators within this domain may excessively utilize strategic resources, including workforce, information systems, machinery, or financial resources, which may be in limited supply. Conversely, the area below the diagonal is the shortage zone, where indicators demonstrate performance below their perceived importance. In this region, specific indicators may necessitate increased strategic resource allocation to attain satisfactory performance levels. This analysis may signal the need for strategic adjustments in resource allocation. Figure 1 illustrates the paired ordering of importance and performance for indicators, according to the respondents of the EIP.
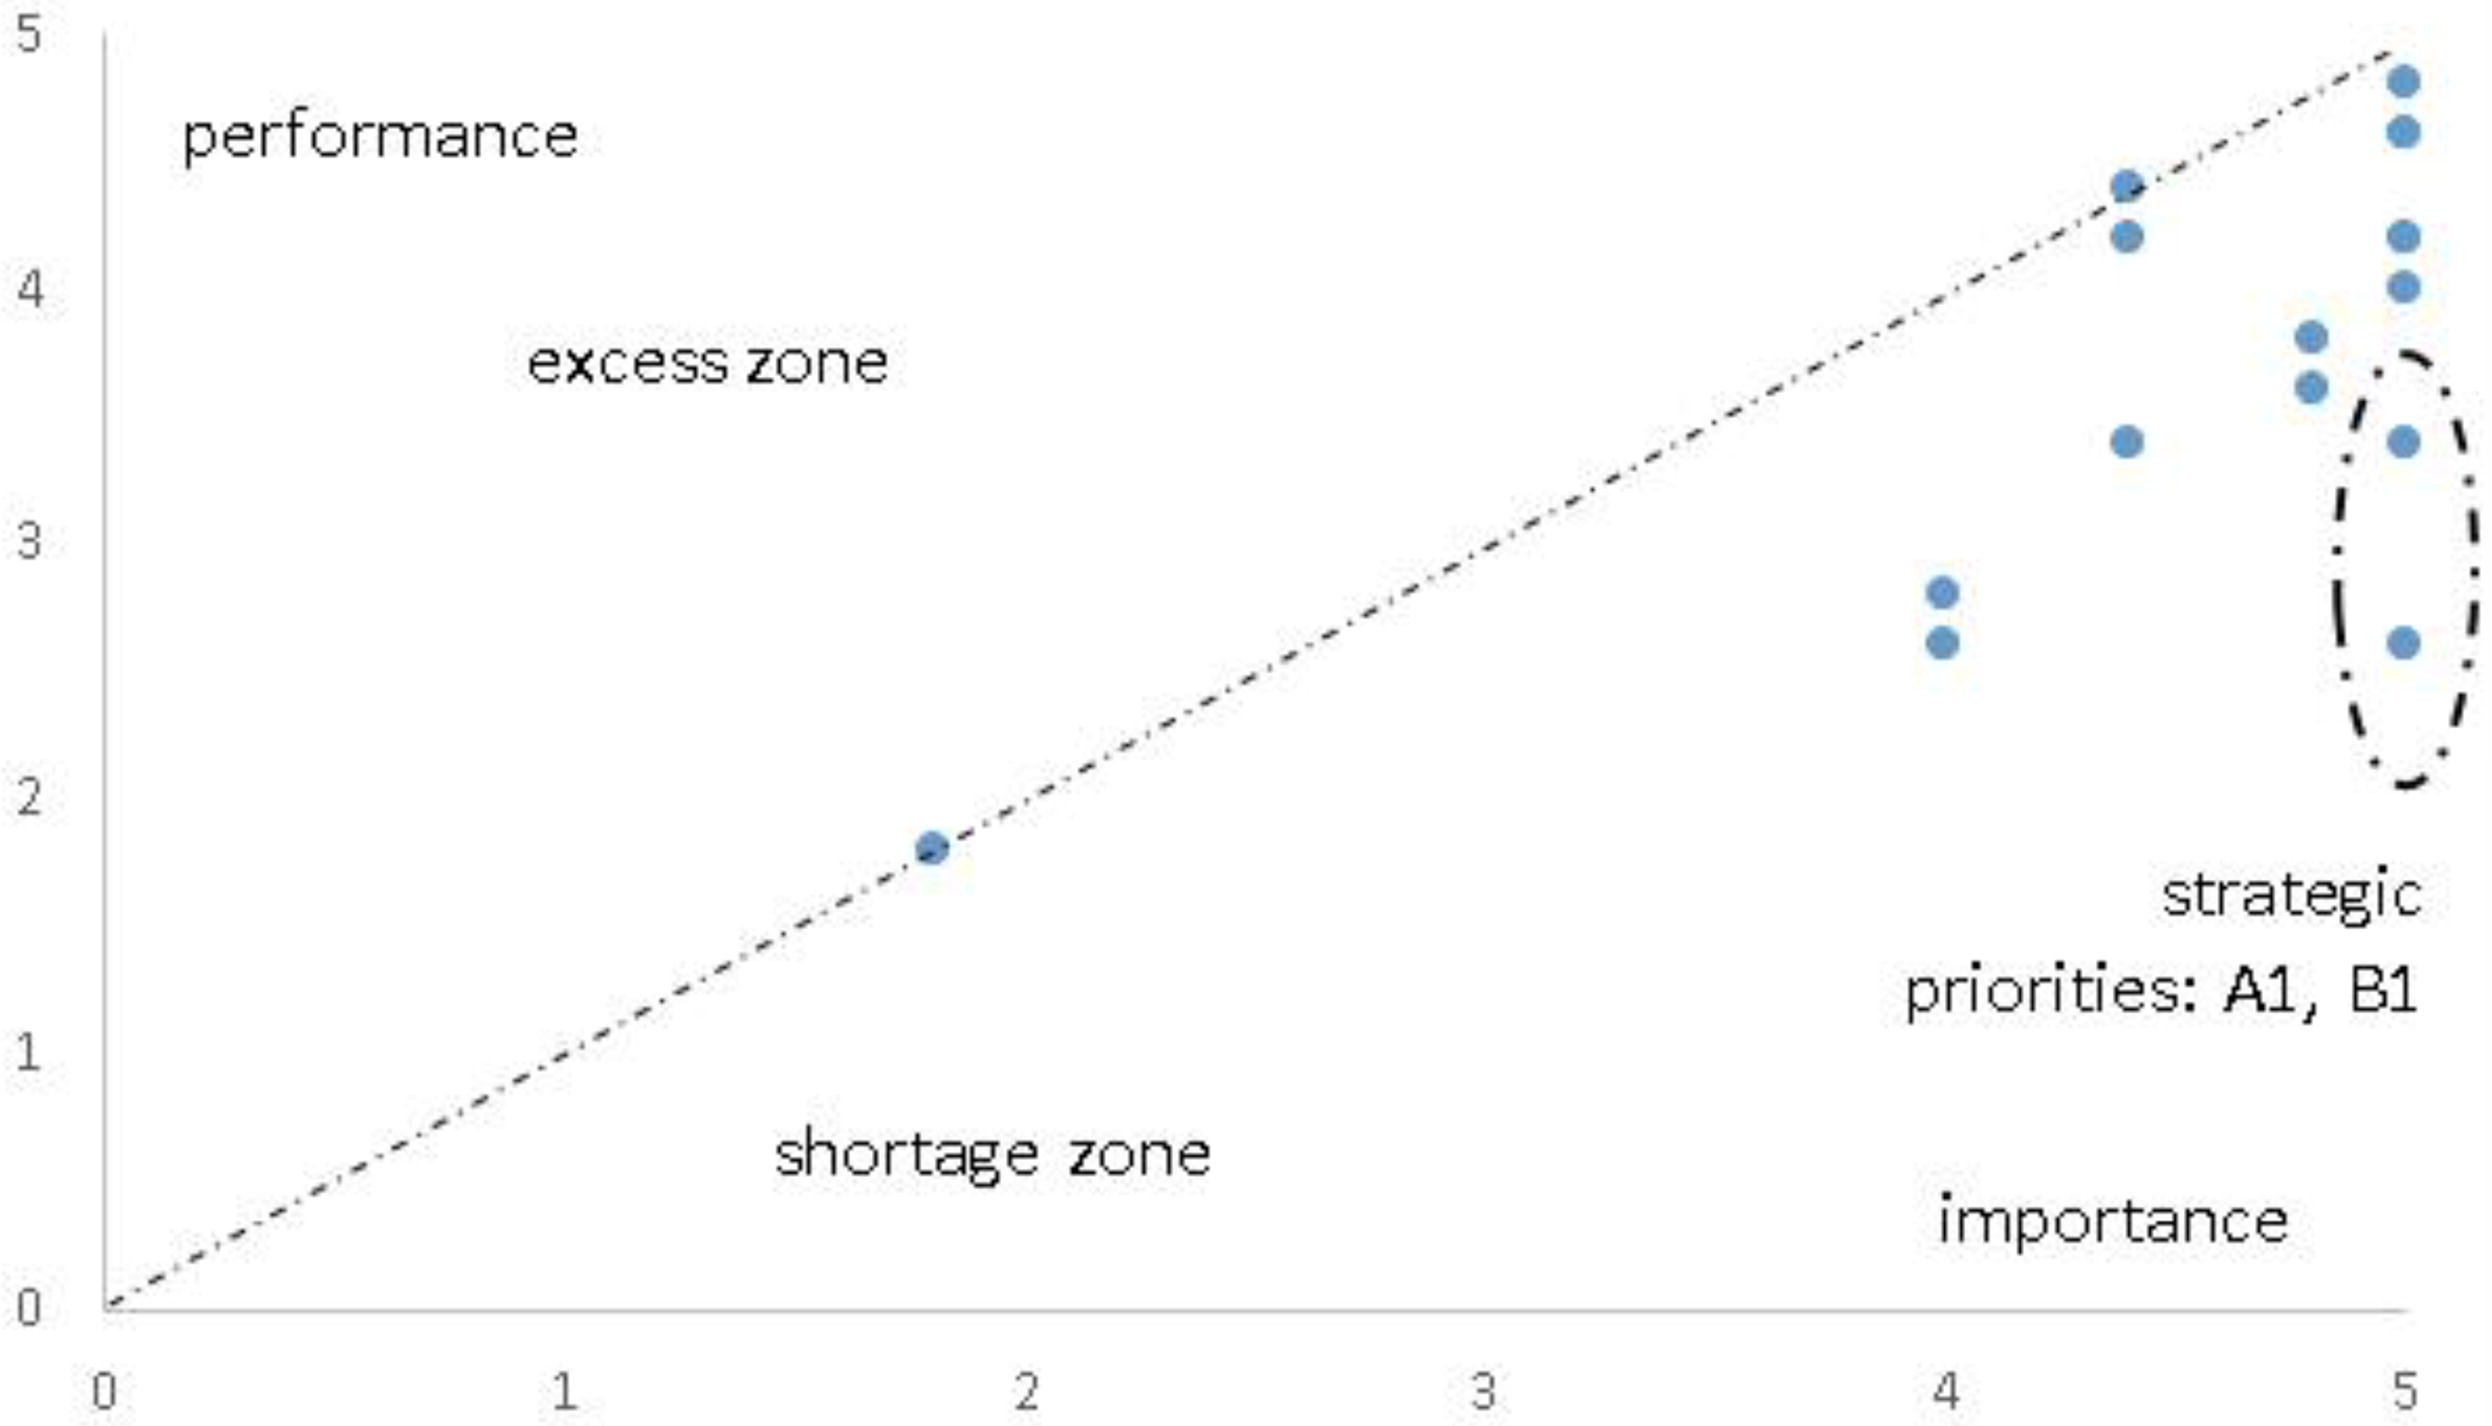
Relationship between importance and performance for the indicators
Examining the figure reveals the absence of indicators in the excess zone. Notably, two indicators (A1 and B1) exhibit performance levels significantly below their respective importance levels. In addition to directing attention toward CT1 and CT2, a targeted examination of these two indicators becomes necessary. Conducting a test to ascertain the roles of A1 and B1 within the strategic scenario is also required. Upon exclusion of A1 and B1 from the scatter plot, a linear regression results in a straight line with an elevated R2 value, which substantiates the deficiency in strategic management concerning A1 and B1.
Figure 2 visually depicts the scatter diagram devoid of A1 and B1, with the application of a linear model and the assignment of an R2 value close to 72 percent of the data.
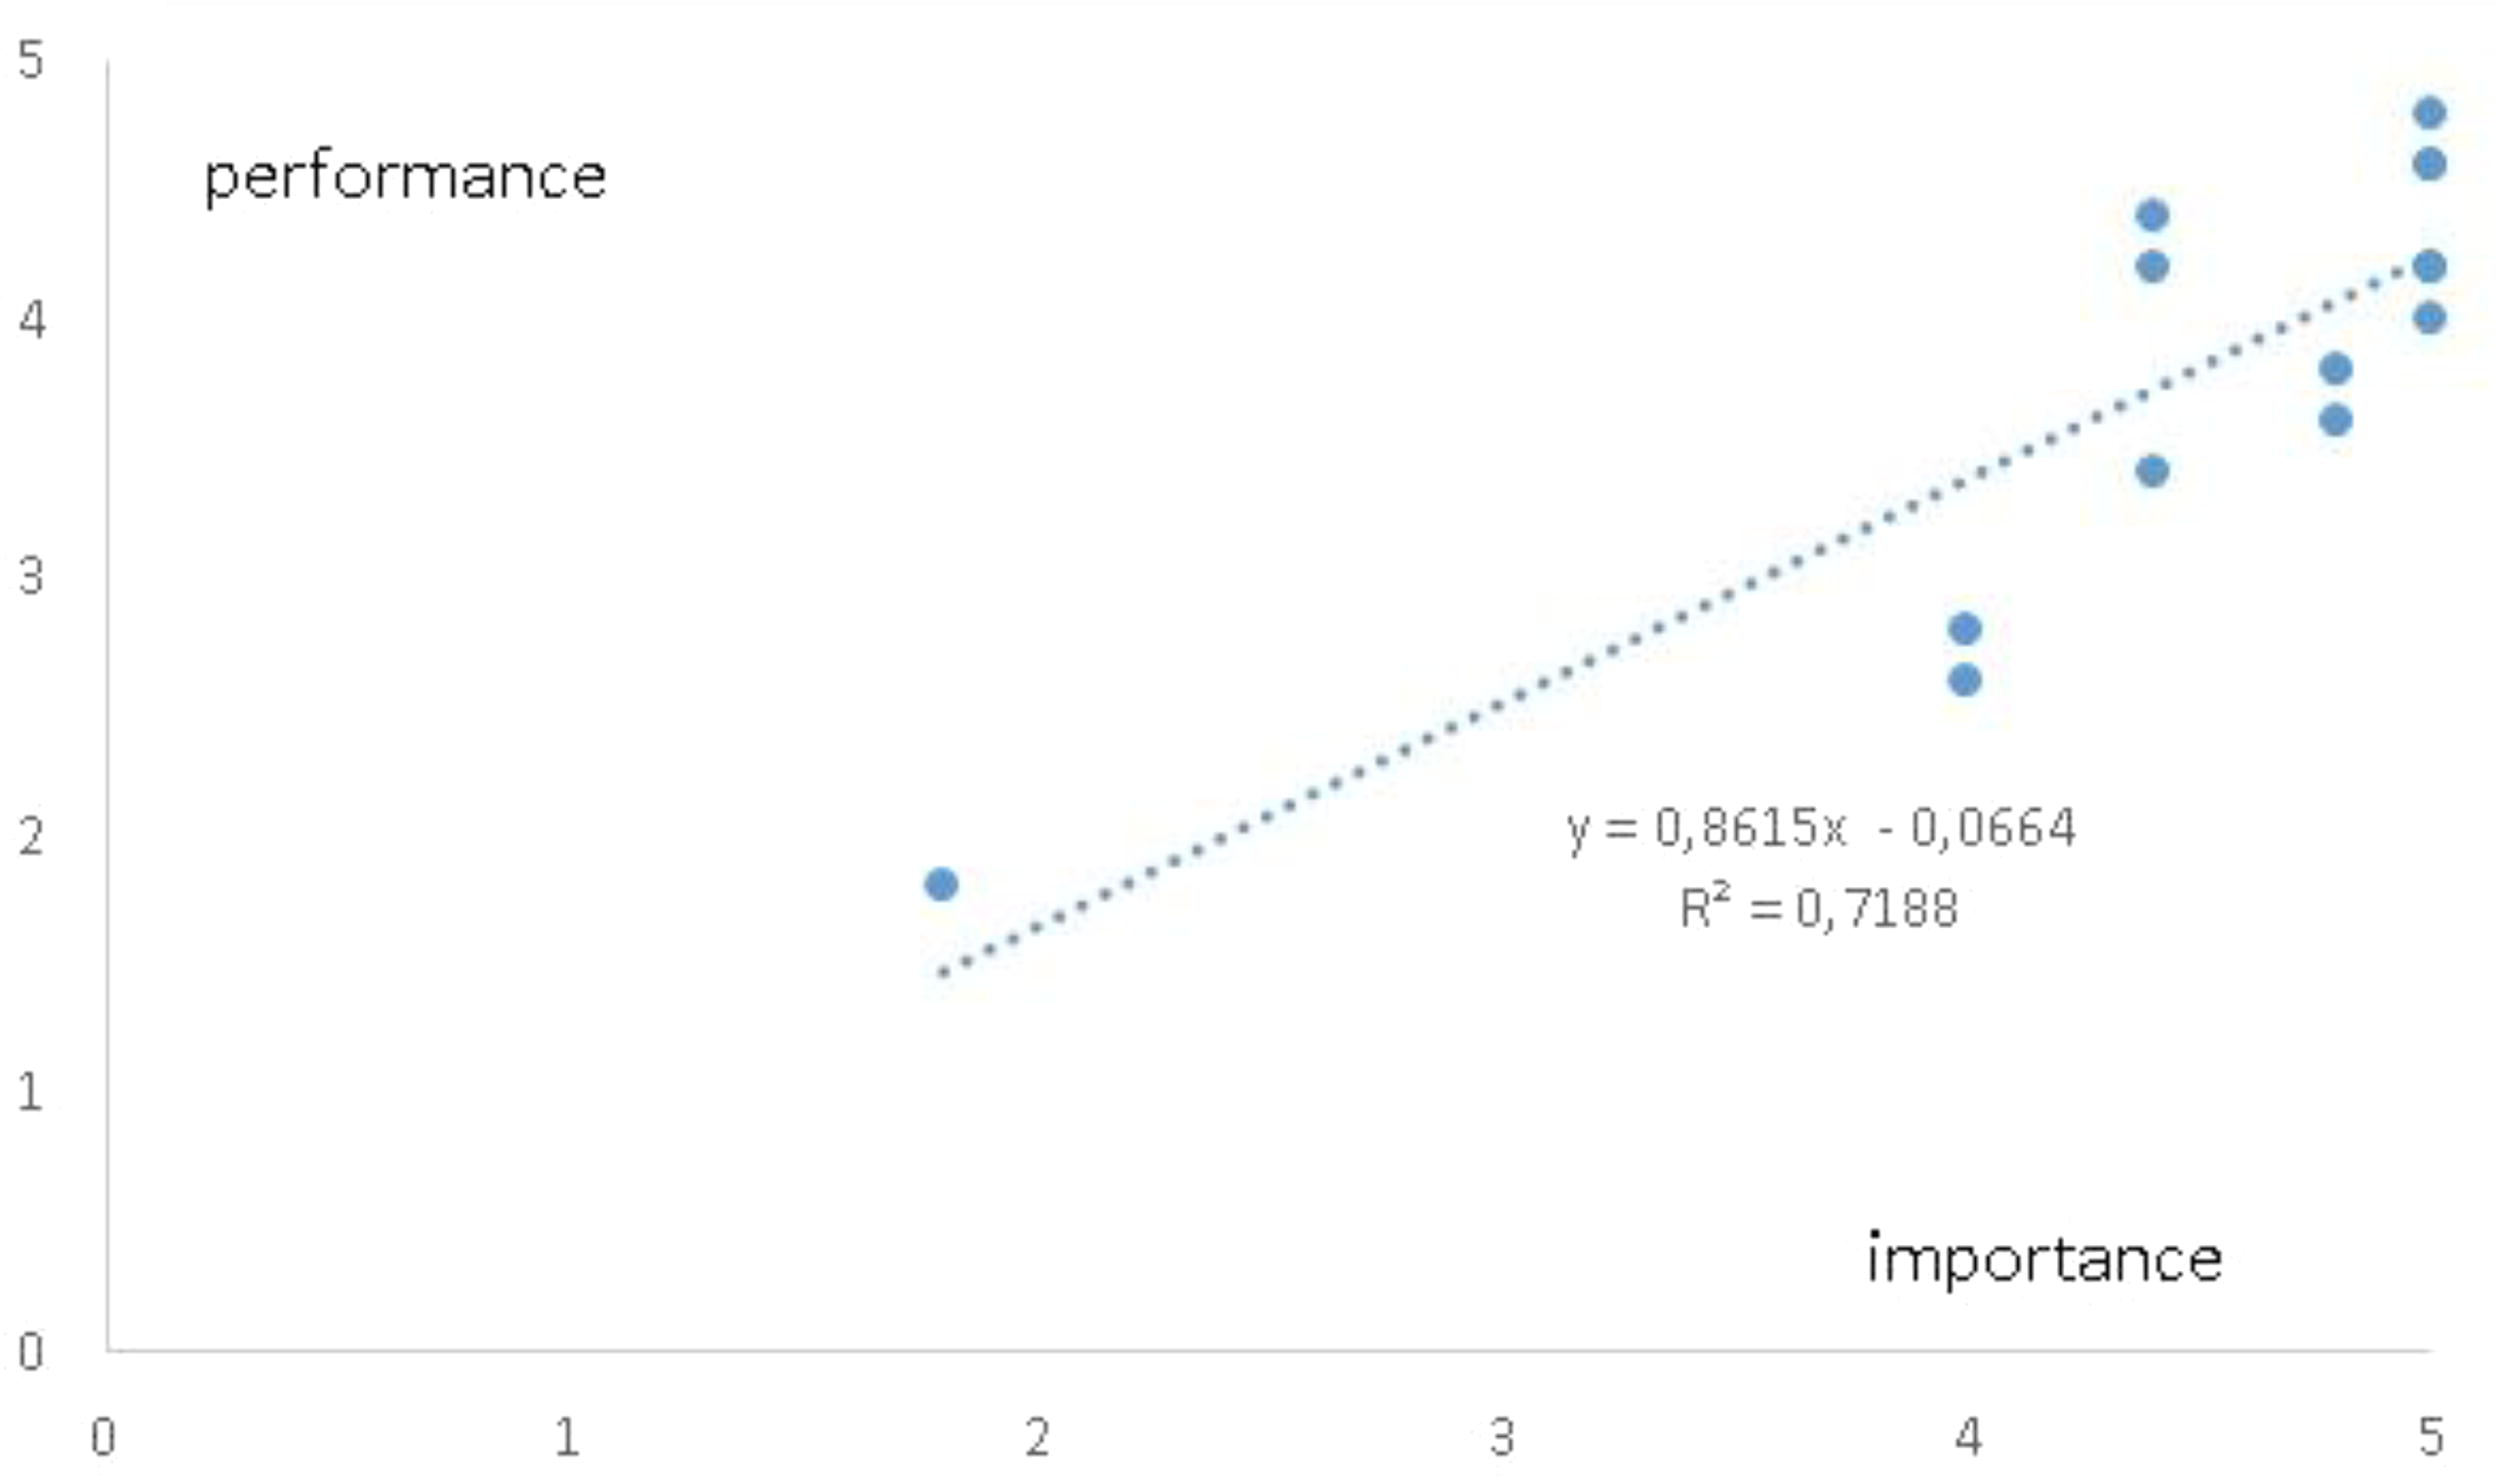
Relationship between importance and performance without A1 and B1
The last analysis concerns individual indicators. Figure 3 depicts the gaps in the indicators. It is possible to observe that the greater gaps are indeed concentrated in CT2, which reinforces the conclusion of the deficiency in digital maturity.

Gaps between importance and performance in indicators
Finally, to evaluate the general operational performance of the EIP, a strategic tool suggested and fully detailed by Koch et al. (2022) was applied. Equation 1 assesses the overall efficacy of the EIP.
Equation 1 indicates that despite an overall performance exceeding 70 perecent, significant opportunities for improvement exist, with approximately 30 percentage points available for further enhancement. Indicators A4 (application technologies) and B2 (readiness for Industry 4.0) exhibit performance levels below 3 on a scale of 1 to 5, corresponding to less than 50 percent. Therefore, as both indicators have a 4 level for importance, these are the best opportunities for improving the overall efficiency of the EIP.
While it is customary within the scholarly discourse to presume a substantial correlation among indicators belonging to the same construct (Nara et al., 2019), a single, shared action plan could benefit both indicators A4 and B2. Such a plan should rely on an extensive program of workforce training and incentives. The implementation of incentives can broaden the knowledge base of the workforce, thereby expediting the readiness of the EIP and subsequently enhancing its performance in the application of innovative technologies. According to Akyazi et al. (2022), heightened training endeavors can equip human capital with enhanced readiness to meet sustainability requirements and technological demands. A proficient workforce, in turn, holds the potential to positively impact the adoption of diverse Industry 4.0 technology strategies, consequently narrowing the gap between the perceived importance and actual performance of the two earlier-mentioned indicators. Finally, it should be observed that improvement in performance levels in people and culture, strategies, and governance conveyed by training and a consequent increase in maturity level may necessitate a specific period for consolidation (Agrawal et al., 2022). An emphasis only on fast-track results tends to undermine the achievement of superior achievements, according to the study by Klingenberg et al., 2021.
In the EIP, there is a conspicuous emphasis on data transmission, organization, and storage up to the level of supervision and tracking. However, the inability to apply the captured knowledge is evident through low performance in indicator A4. This difficulty is in line with the findings of Chen et al. (2018) and Klingenberg et al. (2021). Both studies state that difficulties in handling knowledge may hinder the generation of insights for operational improvements and exert a detracting effect on raising the levels of intelligence layers or the application of data capable of modifying value chain activities. This observed behavior aligns with the statement by Klingenberg et al. (2021) regarding the maturation stage of the technologies themselves and the feasibility of practical implementation and utilization of their potential. While data transmission (A2) has achieved consolidation within the industry, the same is not true for application technologies (A4). This disparity diminishes the potential for a more efficient utilization of available data and, consequently, hinders the creation of value.
Managerial Implications
Based on the findings, both the efficiency and effectiveness of the EIP present opportunities for improvement. For example, equalizing the performance of the four technology indicators would imply performance gains in logistics. This effect could be achieved by controlling the forecasting of material arrivals between EIP participants to eliminate wasted time queuing for the loading and unloading of materials and by-products traded among EIP participants with a view to the continuous flow of processes.
The lack of synchronicity and ineffectiveness of the technologies applied are represented by the gaps in importance and performance among the various areas or partners of the EIP. This effect can be reversed through automated integration with information exchange technologies available between the participants in the complex.
An alignment between the overall strategic planning of the EIP based on the adoption of technologies that promote the application of effective data capture in the right way, at the right time, and with adequate representation such as Klingenberg et al., (2021), can enable medium-term improvements in this sample. The results of this action would be an investment in technologies based on solutions designed by the organizational strategy and only then translated by technology experts rather than the adoption of a roadmap of best technological practices suggested by them, as observed during the analyses. Thus, the current limited level of maturity is reflected both in the need for better alignment between organizational strategy and technologies and in the organization’s ability to tactically and operationally carry out what is planned. Filling this gap tends to mitigate costly reinvestments and rework in high-risk trial-and-error technological experiments that compromise the loss of efficiency and organizational performance.
To achieve optimal performance, organizations must assess the effectiveness of their technology and maturity constructs. One effective approach is to address gaps in energy recovery, which can lead to enhanced energy efficiency and material recovery. Addressing the gaps, in turn, can directly impact overall organizational performance. However, achieving this requires investment in training, skills, process improvements, and qualification, particularly in the EIP domain. Such investment is essential for increasing organizational maturity and preparing for the fourth industrial revolution. Therefore, prioritizing these areas as an intelligent enterprise is crucial for achieving and keeping desired levels of performance.
Conclusion
This article evaluates the presence of innovative technologies and maturity levels in an EIP focused on energy and materials recovery. A performance measurement tool suggested by Koch et al. (2022) was useful to conduct the research. The study concluded that the EIP under investigation had a decent balance, although its overall performance was slightly above 70 percent. Innovative technologies and maturity levels are the areas with the most noticeable gaps.
The observed discrepancy between the perceived importance and actual effectiveness of both the innovative technologies and the maturity level constructed calls for strategic actions. Higher levels of technological implementation and organizational maturity may indicate an improvement in the digitalization strategy with a consequent enhancement in the overall performance (Schumacher et al., 2016). As an organization matures, it must prioritize its workforce and its culture while anticipating the implementation of innovative technologies. A lack of maturity regarding technologies that are less established in the industry can hinder the success of the EIP. Such failure can be due to poor technology choices for expected functions and an overemphasis on transmitting and storing data, neglecting the importance of technologies on the data application layer that can process and utilize information as knowledge to support decision-making within the EIP due to poor readiness for technological tools application in a result-oriented manner.
Management procedures should be improved by raising the level of organizational maturity in the medium term to optimize the performance of the EIP. In addition, investments in technologies were identified as necessary to support advancements in other constructs, such as energy and materials recovery. At the same time, increased technological resources are recommended to achieve superior overall performance in the EIP, thereby aiding decision-makers in making more intelligent choices. Furthermore, this study reveals that organizational maturity levels concerning readiness for Industry 4.0 are reflected in the organizational capability to translate strategic objectives into measurable tactical outcomes representative of targeted performance levels.
Although the study provides valuable insights, it does have certain limitations that open up possibilities for further research. The utilization of a strategic EIP performance evaluation tool was dependent on information from a restricted group of technology experts and managers solely from companies within the eco-industrial park, potentially leading to bias. Subsequent research could investigate more extensive EIPs and implement alternative methodologies to gain a comprehensive understanding of the impact of maturity on Industry 4.0 implementation and its effectiveness in improving organizational performance. Finally, the agreements and divergences between responders may also be analyzed with the support of other qualitative approaches, such as focus groups or variants of the Delphi method, as used by Bui et al. (2020).
Footnotes
Acknowledgment
The authors thank the Brazilian Research agency, CNPq, for funding the research.
Authors’ Contributions
All authors have read and agree with the published version of the article. L.T.S., C.M.K., and G.S.R. did the field research and data collection; M.A.B. did the bibliographic research and provided the theoretical foundation for the study; L.T.S. wrote the draft; and M.A.S. defined the methodology, managed the project, and wrote the final version.
Funding Information
The study was partially funded by CNPq, the Brazilian research agency, under the grant number 303496/2022-3 and 302570/2019-5.
Author Disclosure Statement
No competing financial interests exist.