
Abstract
Signal transducers and activators of transcription 3 (STAT3) is a pleiotropic transcription factor involved in a variety of physiological processes. STAT3 acts as a key transcriptional determinant of mouse embryonic stem (ES) cell self-renewal and plays a pivotal function in early mammalian embryogenesis because the development of many organs requires STAT3 activation. However, little is known about the role of STAT3 function during ES cell differentiation. To answer this question, we built a lentiviral construct with 7-repeat STAT3-binding sequence (enhancer) and minimal TA (promoter) driving renilla luciferase and monomeric red fluorescence protein (Rluc-mRFP), followed by a constitutive cytomegalovirus promoter driving green fluorescent protein as a selection marker. The specificity of our custom-designed 7-repeat STAT3 reporter construct was first confirmed by cotransfection with constitutively active version of STAT3 (STAT3C) into human embryonic kidney 293T cells. Next, a mouse ES cell line stably transduced with STAT3 reporter construct was isolated. This ES cell line showed a tight response in reporter gene expression with leukemia inhibitory factor (LIF) induction and was chosen as a developmental model for the STAT3 functional study. Using serial noninvasive bioluminescence imaging, we showed that the onset of embryoid body (EB) formation involved inhibition of STAT3 activity. However, during differentiation, STAT3 activity steadily increased from day 5 to 14 and was reduced by day 21. STAT3 activity was also confirmed separately by Western blots. Finally, phosphorylation of STAT3 was also found to correspond with cardiomyocyte differentiation. In summary, this is the first study to monitor real-time STAT3 activity during ES cell differentiation. This genetically modified line can be used to study the biological role of STAT3 during ES cell differentiation into different derivatives.
Introduction
E
Signal transducers and activators of transcription 3 (STAT3) is a pleiotropic transcription factor that is involved in a variety of physiological processes [1]. It belongs to the STAT family, which consist of transcription factors that are phosphorylated by JAK kinases in response to cytokine activation of a cell surface receptor tyrosine kinases [2]. Upon activation, the STATs dimerize and are localized to the nucleus where they bind to the sis-inducible elements on gene promoters and activate transcription of cytokine-responsive genes. Cytokines that activate STAT3 include leukemia inhibitory factor (LIF), Oncostatin M, interleukin-6, leptin, epidermal growth factor, platelet-derived growth factor, hepatocyte growth factor, and cardiotrophin-1. Importantly, the downstream response of STAT3 includes progression through the cell cycle, prevention of apoptosis, and upregulation of oncogenes such as c-Myc and Bcl-X [1]. In mouse ES cells, interference of the LIF-LIFR/gp130-JAK/STAT3 process leads to inhibition of ES cell self-renewal [3] whereas activation of the STAT3 pathway is triggered by interaction of LIF and LIFR/gp130 which is essential and sufficient for ES cell self-renewal [4,5]. The downstream signaling of STAT3 in mouse ES cells includes Jmjd1a and aes1 which functions are still unknown [6 –8]. Matsuda et al. [9] showed that using a drug inducible STAT3 construct (which can be activated without LIF stimulation), activation of STAT3 by the drug (4-hydroxytamoxifen, 4HT) is sufficient for ES self-renewal.
However, the view that STAT3 signaling is the key event in determining the undifferentiated phenotype is under challenge, as the STAT3 pathway is also active in many cell types other than ES cells [10]. The requirement of activated STAT3 in specific tissue genesis has been shown by many groups, although there are still some conflicting claims of STAT3 function for different lineage differentiation. For example, STAT3 plays a crucial role in liver [11] and myeloid [12] differentiation. In skin differentiation, STAT3 is not required for keratinocyte formation and first hair cycle, but keratinocyte-specific STAT3-disrupted mice exhibited retardation of wound healing and absence of the second hair cycle onward [13]. Suppression of STAT3 promotes neurogenesis in cultured neural stem cells [14], but activation of STAT3 is a crucial step for astrogenesis by neural stem cells [15]. Finally, the JAK2/STAT3 pathway also directs cardiomyogenesis within mouse ES cells. Foshay et al. showed that there was a 70% increase in JAK2 protein levels within beating embryoid bodies (EBs) while inhibition of STAT3, a specific target of JAK2, by dominant/negative STAT3 resulted in complete loss of these beating areas [16].
In this study, we hypothesize that the alteration of STAT3 activity might be an important event in the initialization of ES cell differentiation and the orientation of lineage differentiation. To monitor the kinetic activity of STAT3 temporally and spatially, we built a STAT3 reporter vector and established a stable STAT3 reporter expression mouse ES cell line.
Materials and Methods
Construction of STAT3 activity reporter lentiviral vector
A lentiviral transfer plasmid was constructed as previously described [17]. Briefly, a STAT3 specific–binding promoter was synthesized by linking seven tandem STAT3-recognition sequence (TTCCCGAA) with a small TA promoter (PAN facility, Stanford, CA). Then the U6 promoter from vector pSico-GFP (a gift from Andrea Ventura, Jacks lab, MIT, MA) was cut out with XbaI and EcoRI and sequentially replaced by the synthesized STAT3-binding promoter and a small polyA termination. Afterwards, a double fusion reporter consisting of the fusion of renilla luciferase (Rluc) and monomeric red fluorescence protein (mRFP) was inserted under the STAT3-binding promoter to form the specific reporter response element to activated STAT3. A preexisting cistron with cytomegalovirus (CMV) promoter driving green fluorescent protein (CMV-GFP) was used as the selection marker.
Lentivirus package and transduction
The STAT3 reporter vector was cotransfected with the packaging vector pDeltaVPR and VSVG vector into human embryonic kidney 293FT cells by using the calcium phosphate precipitation method as described before [18]. After culturing for 72 h at 37°C, the viral supernatant was harvested and filtrated through 0.45 μm filter to remove cell debris, then ultracentrifuged by 15,000g for 2 h to condense the virus. Titer of virus was detected by 293FT cell infection and fluorescence-activated cell-sorting (FACS) analysis. For transduction, undifferentiated mouse ES cells under feeder-free culture were washed with PBS and incubated with lentivirus diluted in OptiMEM (Invitrogen, Carlsbad, CA) and 8 μg/mL polybrene (Sigma-Aldrich, St. Louis, MO) by a multiplicity of infection of 10. The lentivirus solution was replaced with regular media 4 h later, and cells were kept on culture for 48 h before flow cytometry sorting of GFP positive cells.
Mouse ES cell culture and differentiation
The mouse ES-D3 (CRL-1934) line was obtained from the American Type Culture Collection (Manassas, VA) and maintained with DMEM on γ-ray-irradiated mouse embryonic fibroblast feeder cells. The medium was supplemented with 15% fetal bovine serum (FBS), 0.1 mM β-mercaptoethanol, and 103 units/mL of LIF (Chemicon, Temecula, CA) to suppress ES cell differentiation. For differentiation, a cardiac preference protocol was used as described [19]. Briefly, ES cells were dispersed with trypsin, resuspended in differentiation medium (15% FBS, 1% ITS, 450 μM MTG, and 1% P/S in Iscove's Modified Dulbecco's Media), and cultured using the hanging drops method by aggregating and expanding 400 cells per drop for 4 days. They were then seeded into a 48-well gelatin-coated plate for additional 10 days. Spontaneously beating clusters were dissected with a sterile micropipette and recultured for further experiments.
ES cell proliferation and viability
The CyQuant cell proliferation assay (Molecular Probes, Eugene, OR) was measured using a microplate spectrofluorometer (Gemini EM, Sunnyvale, CA) at the 24-, 48-, and 72-h time points. Eight samples were assayed and averaged. Cell viability was determined using a trypan blue (Gibco) exclusion assay in triplicate.
Imaging reporter gene expression
Rluc activity from the same EB was measured by bioluminescence imaging and confirmed with cell lysates luciferase assay. In sequential noninvasive imaging, attached EBs were exposed to 2 μg/mL of coelenterazine directly supplemented in the medium and detected with a cooled charge-coupled device (CCD) bioluminescence camera (In Vivo Imaging System, IVIS 50; Xenogen, Alameda, CA) immediately, as described previously [20]. Localization and measurement of bioluminescence emitted from the ES cells were performed by using the overlay of the photographic image and the bioluminescence scan. Photon emission was acquired for 3 min and bioluminescence was quantified in units of maximum photons per second per centimeter square per steridian (p/s/cm2/sr) as previously described [20]. To confirm the in vivo Rluc imaging results, ex vivo luciferase assays on lysed cells were performed according to the manufacturer's protocol (Promega, Madison, WI) using a luminometer (Applied Bioanalytical Labs, Sarasota, FL), and normalized by total protein. Ex vivo luciferase activities were expressed in units of relative light unit per mg protein.
Semiquantitative RT-PCR
First-strand complementary DNA (cDNA) template was synthesized from 2 μg of total RNA isolated from mouse ES cells or EBs by using iScript cDNA Synthesis kit (Bio-Rad, Hercules, CA). One-tenth of the first-strand cDNA mixture was used in the reverse transcriptase polymerase chain reaction (RT-PCR). Embryonic- and cardiac-specific transcriptions [Nanog and (β-myosin heavy chain (β-MHC), respectively] were compared during different stage of mouse ES cell differentiation at day 0, 7, 14, and 21. Primer sequences for these specific genes are listed in Supplementary Table 1.
Western blot
Mouse ES cells were lysed with RIPA buffer (Sigma-Aldrich, St. Louis, MO) at day 0, 4, 7, 10, 14, and 21 of differentiation. Cell debris was removed by centrifugation. Protein concentration was determined by using the BCA Protein Assay kit (Bio-Rad, Hercules, CA). Afterwards, 30 μg protein in an equal volume of loading buffer (Bio-Rad, Hercules, CA) was boiled and separated by 4–12% sodium dodecyl sulfate polyacrylamide gel electrophoresis (SDS-PAGE)-ready gel and transferred to a polyvinylidene fluoride membrane (Bio-Rad, Hercules, CA) for staining. The nonspecific binding sites of protein were blocked in Tris-buffered saline–containing 5% nonfat dry milk and 0.1% Tween-20 for 1 h. The membrane was then incubated at 4°C overnight with primary antibodies against STAT3 or phosphor-STAT3 (Cell Signaling, Danvers, MA; dilution 1:1,000), followed by probing with horseradish peroxidase–conjugated secondary antibodies (dilution 1:2,000), and visualized with enhanced chemiluminescence luminol reagent (Santa Cruz Biotechnology, Santa Cruz, CA). Protein expression was quantified by densitometry.
Immunohistochemistry
Fully differentiated EBs (day 14) were dissociated with collagnease type 2 (Worthington, Lakewood, NJ) and seeded into gelatin coated chamber slides overnight to reach 70% confluency. Slides were fixed with 4% paraformaldehyde for 20 min at room temperature, soaked in methanol at − 20°C for 5 min. The cells were permeabilized with 1% Triton X-100 in PBS for 30 min, and blocked with 10% FCS for 50 min at room temperature. Binding of primary antibodies (mouse anti-phospho-STAT3/RFP and goat anti-Troponin T) was performed at 4°C overnight. Then slides were washed and incubated with a mixture of the second antibodies (TRITC-labeled rabbit antimouse IgG and fluorescein isothiocyanate (FITC)-labeled donkey antigoat IgG) at room temperature for 30 min, followed with Hochest 33342 nuclear staining. Double-stained cells were observed and photographed using a Zeiss fluorescence microscope.
Statistical analysis
Data are given as mean ± SD. For statistical analysis, the two-tailed Student's t-test was used. Differences were considered significant at p < 0.05.
Results
Design of a versatile STAT3-promoter TA-Rluc-RFP (pS3/RR) reporter construct
To monitor the subcellular localization and activation of STAT3 in mouse ES cells and their derivatives, we first rationally designed and constructed a reporter construct to be responsive to STAT3 activity. The reporter construct is shown in Fig. 1. Considering the low efficiency of plasmid transfection in ES cells, a lentiviral backbone was chosen [21]. Tandem repetition of transcription factor binding site could significantly increase downstream gene expression [22]. To improve the detection of our reporter gene, we chose to make a 7 repeat of STAT3-recognition sites using the backbone from the commercially available four repeat construct (Clontech, Mountain View, CA). The design of the reporter is based on a previous study in which we found that Rluc facilitates quantitative and noninvasive imaging both in vivo and in vitro, and that mRFP can be visualized using fluorescence microscopy, thus facilitating the localization of target cells by microscopy [17]. The fusion of these two reporter genes was placed under the control of STAT3 consensus-binding sites. The separate cistron with CMV-GFP allowed us to isolate stable clones by flow cytometry sorting of stably transduced cells. For example, LIF docks on cell surface receptor gp130, gp130 phosphorylates JAK kinase and subsequently phosphorylates STAT3. Upon activation, STAT3s dimerize and relocalize to the nucleus where they bind to specific sites on gene promoter and activate transcription of cytokine-responsive genes. In our reporter system, activated STAT3 induces the expression of Rluc and mRFP. The reporter substrate coelenterazine is catalyzed by reporter protein Rluc, which produces light that can be detected by the CCD camera whereas RFP can be detected by fluorescence microscopy and FACS analysis.
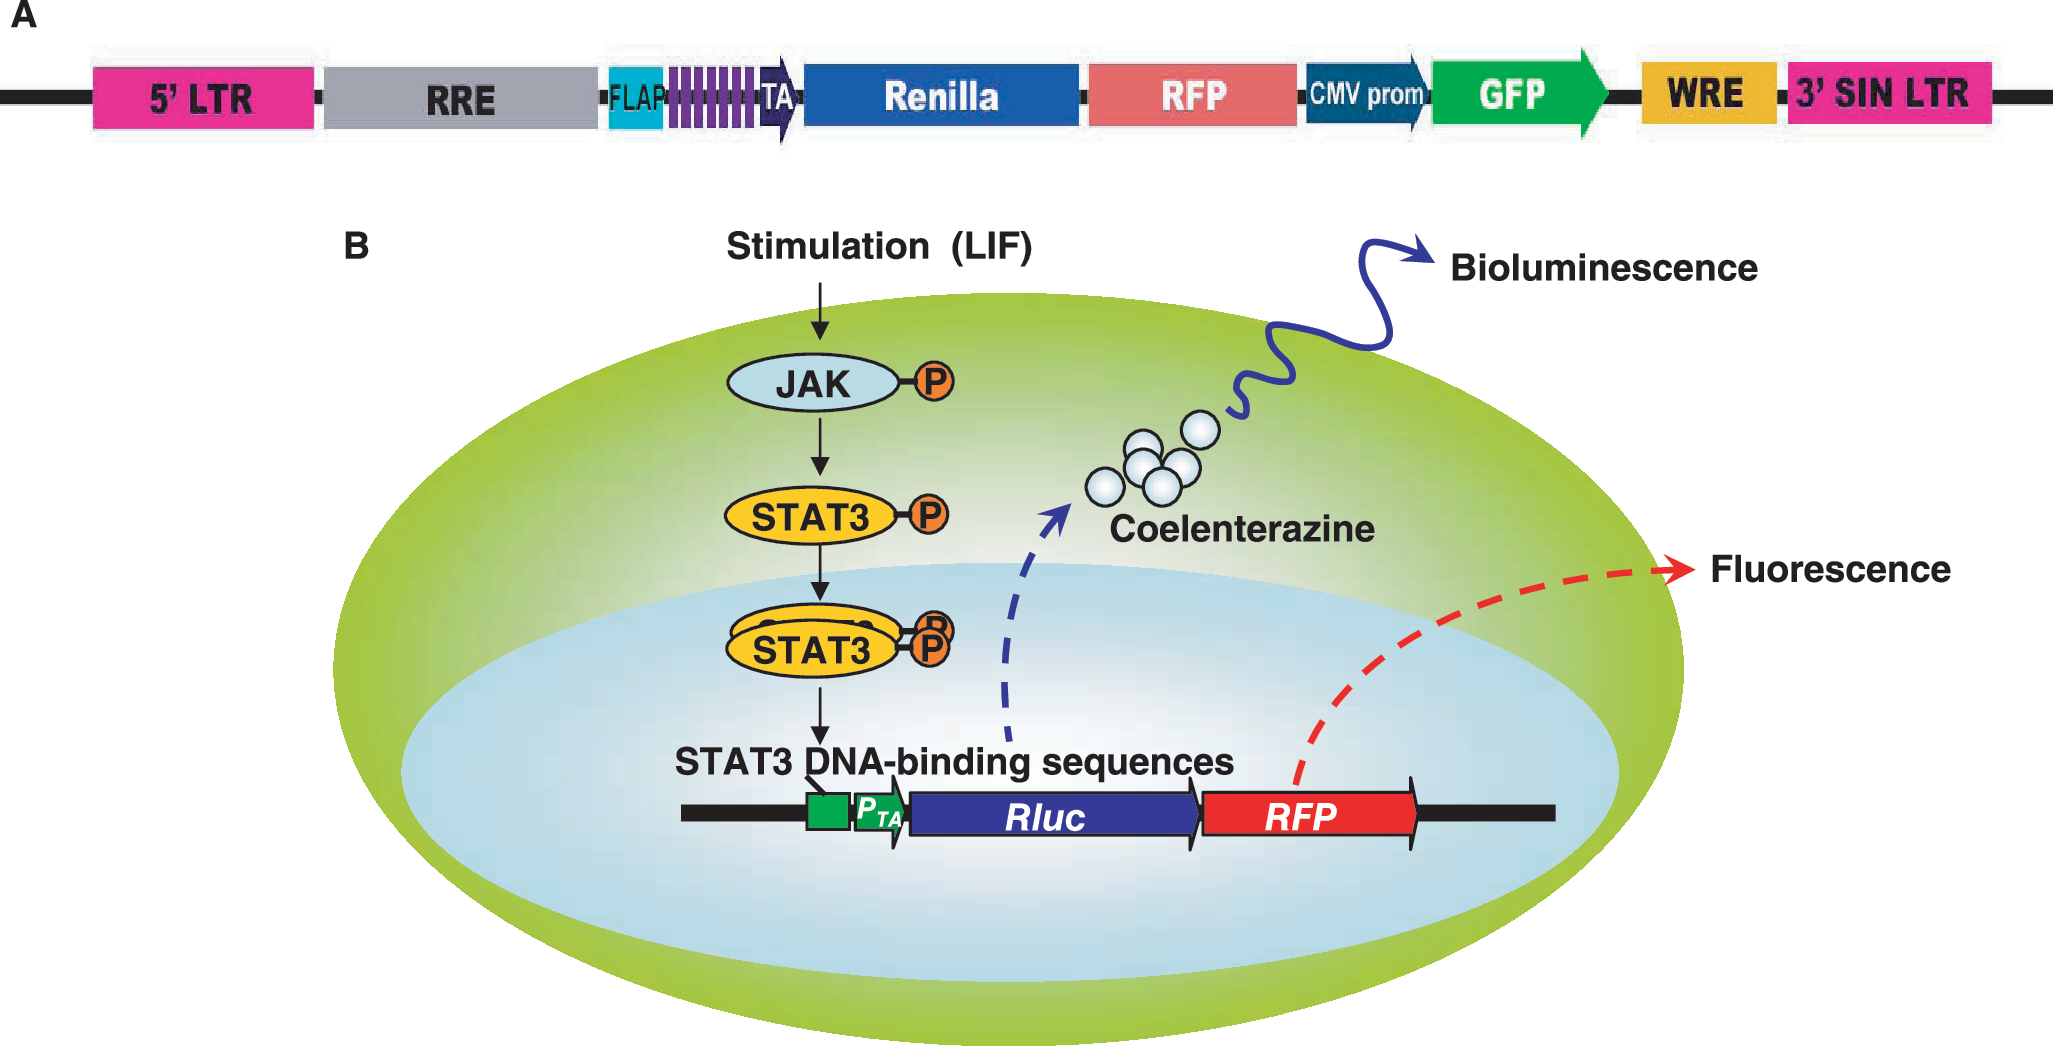
Schema of the Stat3-promoter TA-Rluc-RFP (pS3/RR) reporter construct. (
Activation of pS3/RR reporter construct in 293T cells
The specificity and sensitivity of the pS3/RR reporter construct were first examined in 293T cells by cotransfecting with STAT3C, a constitutively active version of STAT3 [23]. Forty-eight hours after transient transfection, 293T cells were subjected to bioluminescence imaging. As shown in Fig. 2A, Rluc activities of the reporter construct were significantly increased by the presence of STAT3C transcription factor following cotransfection (5.17 × 10⁵ ± 1.40 × 10⁵ p/s/cm2/sr; p < 0.01) compared to reporter only transfection (2.17 × 10⁵ ± 4.63 × 10⁴ p/s/cm2/sr) or STAT3C only transfection (2.32 × 10⁵ ± 3.32 × 10⁴ p/s/cm2/sr) or cell only control (9.30 × 10⁴ ± 1.45 × 10⁴ p/s/cm2/sr). In comparison, cotransfection of STAT3C with a TA promoter/enhancer–driving firefly luciferase (pTA/Fluc) but deficient of STAT3-binding sequence showed only background activity for all groups (1.2 − 1.5 ×10⁴ p/s/cm2/sr; p = NS for all). This STAT3-specific Rluc activity suggests our reporter construct can be used to reliably image STAT3 activity. Expression of another reporter gene (RFP) from the fusion construct was also tightly regulated by the existence of activated STAT3 (Fig. 2B). The strong correlation of expression between Fluc and RFP are expected because the two reporter genes are expressed as a fusion protein joined by a 12-amino acid linker (XERSDFXZEWRE). Finally, semiquantitative RT-PCR confirmed increased STAT3 expression by pS3/RR and STAT3C cotransfection (Fig. 2C).
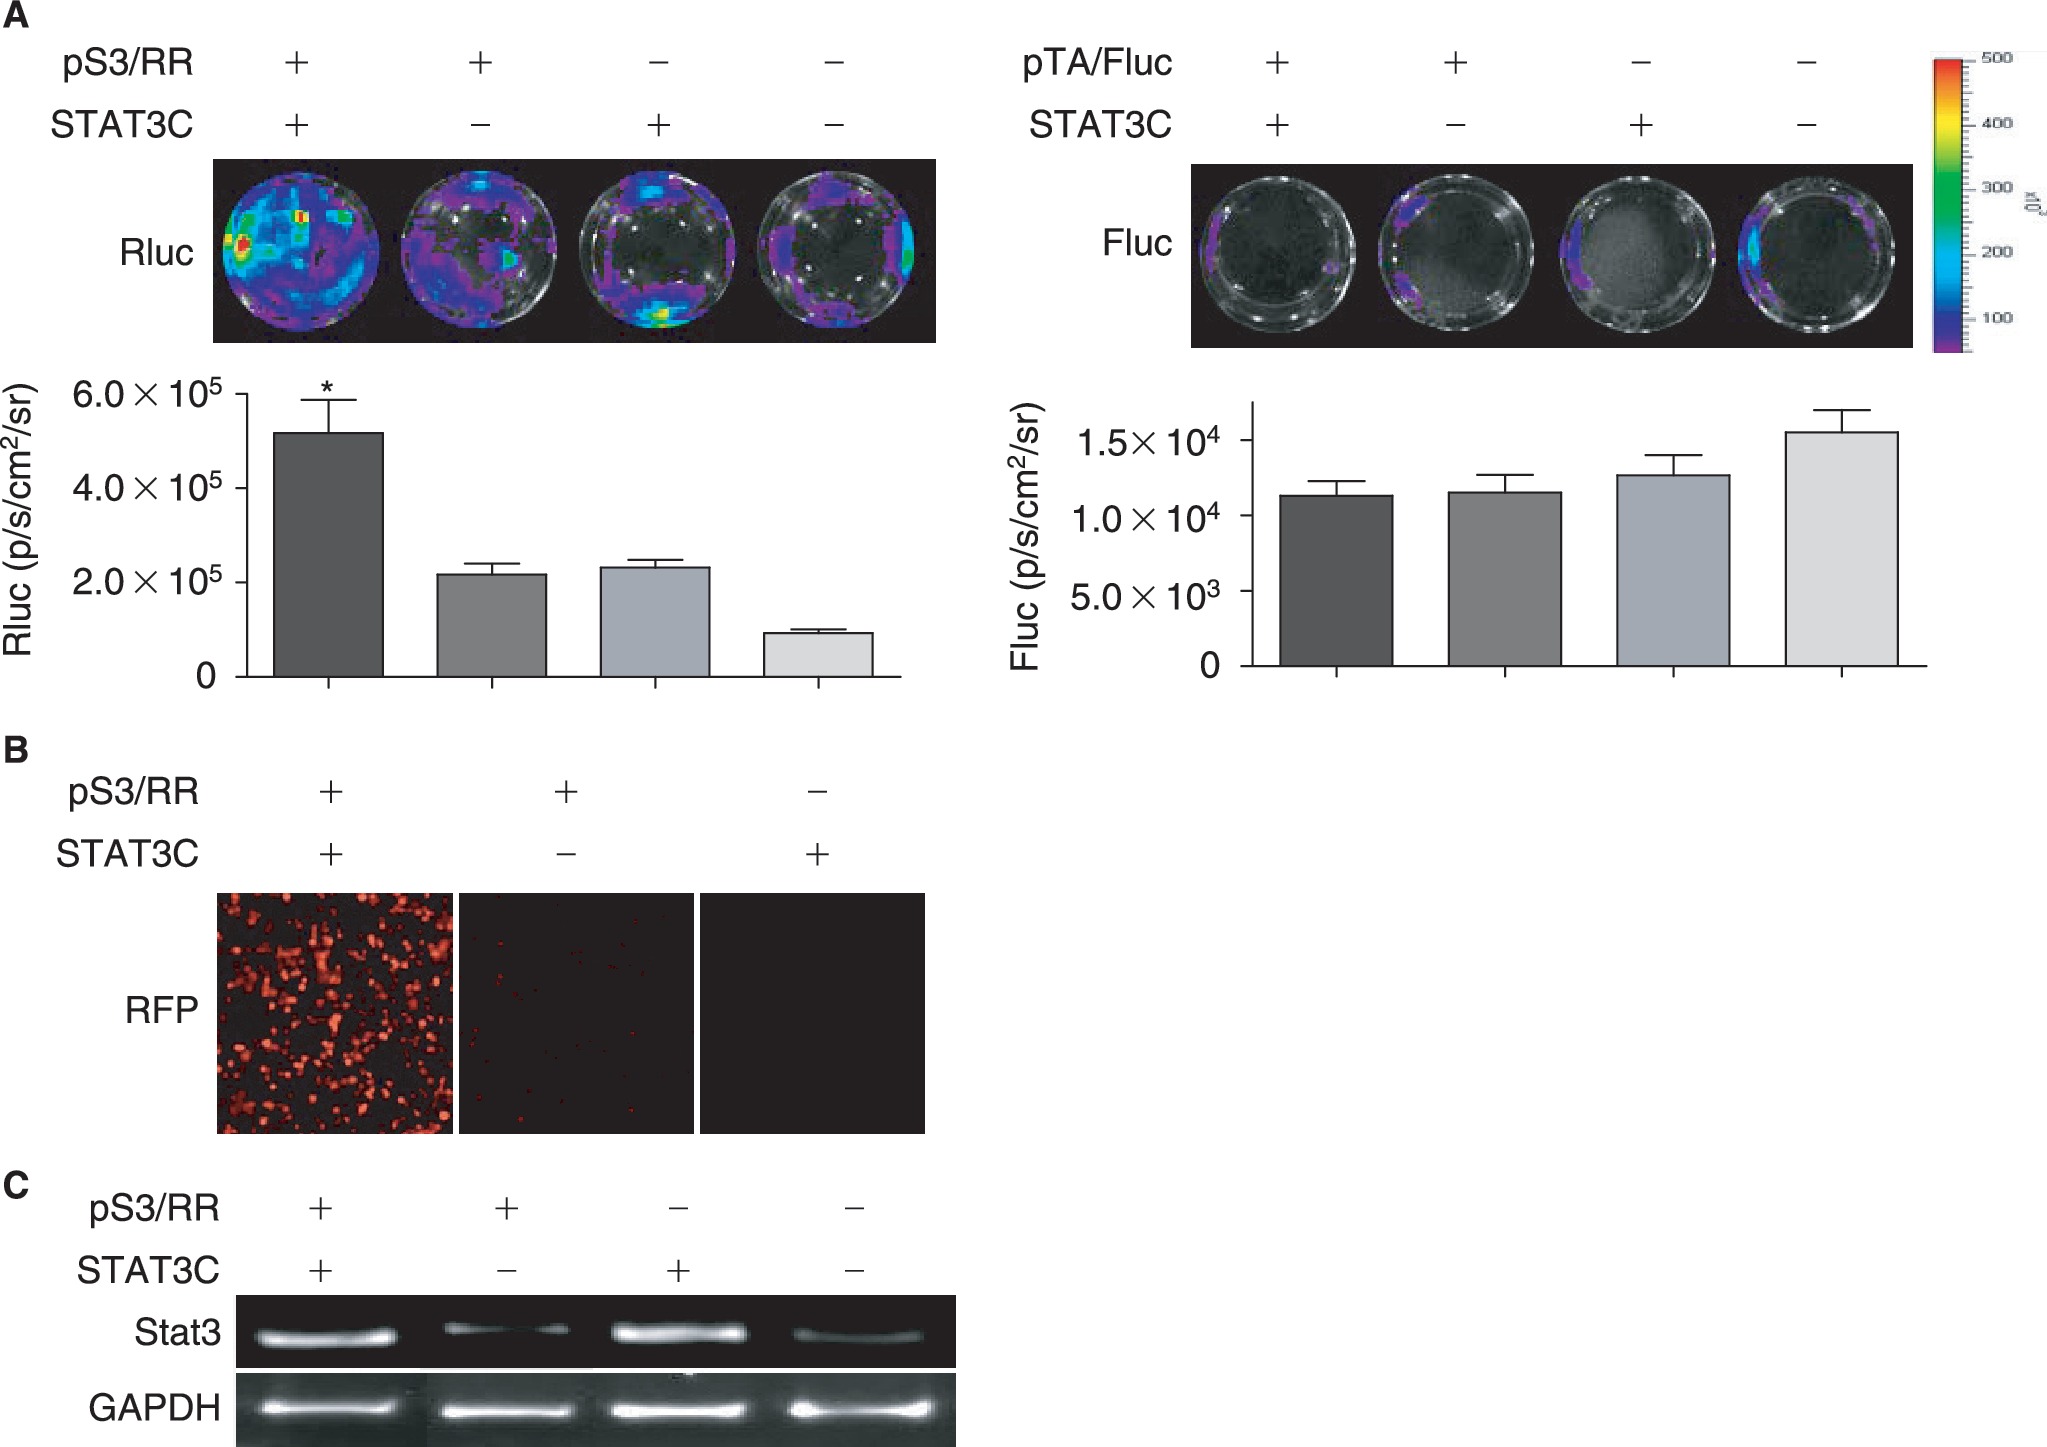
Transient transfection of human embryonic kidney 293T cells. The pS3/RR reporter construct is tested by cotransfection with STAT3C, a constitutively active version of STAT3. (
Characterization of mouse ES cell line stably expressing pS3/RR reporter construct
Lentivirus with STAT3p-Rluc-RFP-CMVp-GFP (pS3/RR) construct was packaged as previously described [24]. Lentiviral transduction of murine ES cells with the STAT3 reporter gene showed high efficiency (18.1 ± 5.2 %) based on the FACS scan using a FITC (530 ± 15 nm) filter setting (Fig. 3A). Stable clones were selected with FACS twice and confirmed by fluorescence microscopy by GFP expression (Fig. 3B). The expression of GFP gene remained stable for >4 months of ES cell passage (data not shown), suggesting minimal reporter gene silencing. Mouse ES cells carrying STAT3 reporter (ES-pS3/RR) showed strong alkaline phosphatase activity through alizarin red staining, which is characteristic of undifferentiated mouse ES cells. We also examined control nontransduced ES and ES-pS3/RR cell viability and proliferation at several time points and observed no significant changes between the two populations (Fig. 3C–D). Taken together, these findings are consistent with previous studies from our group [17] and others [25] showing that lentiviral transduction does not significantly affect ES cell characteristics adversely.
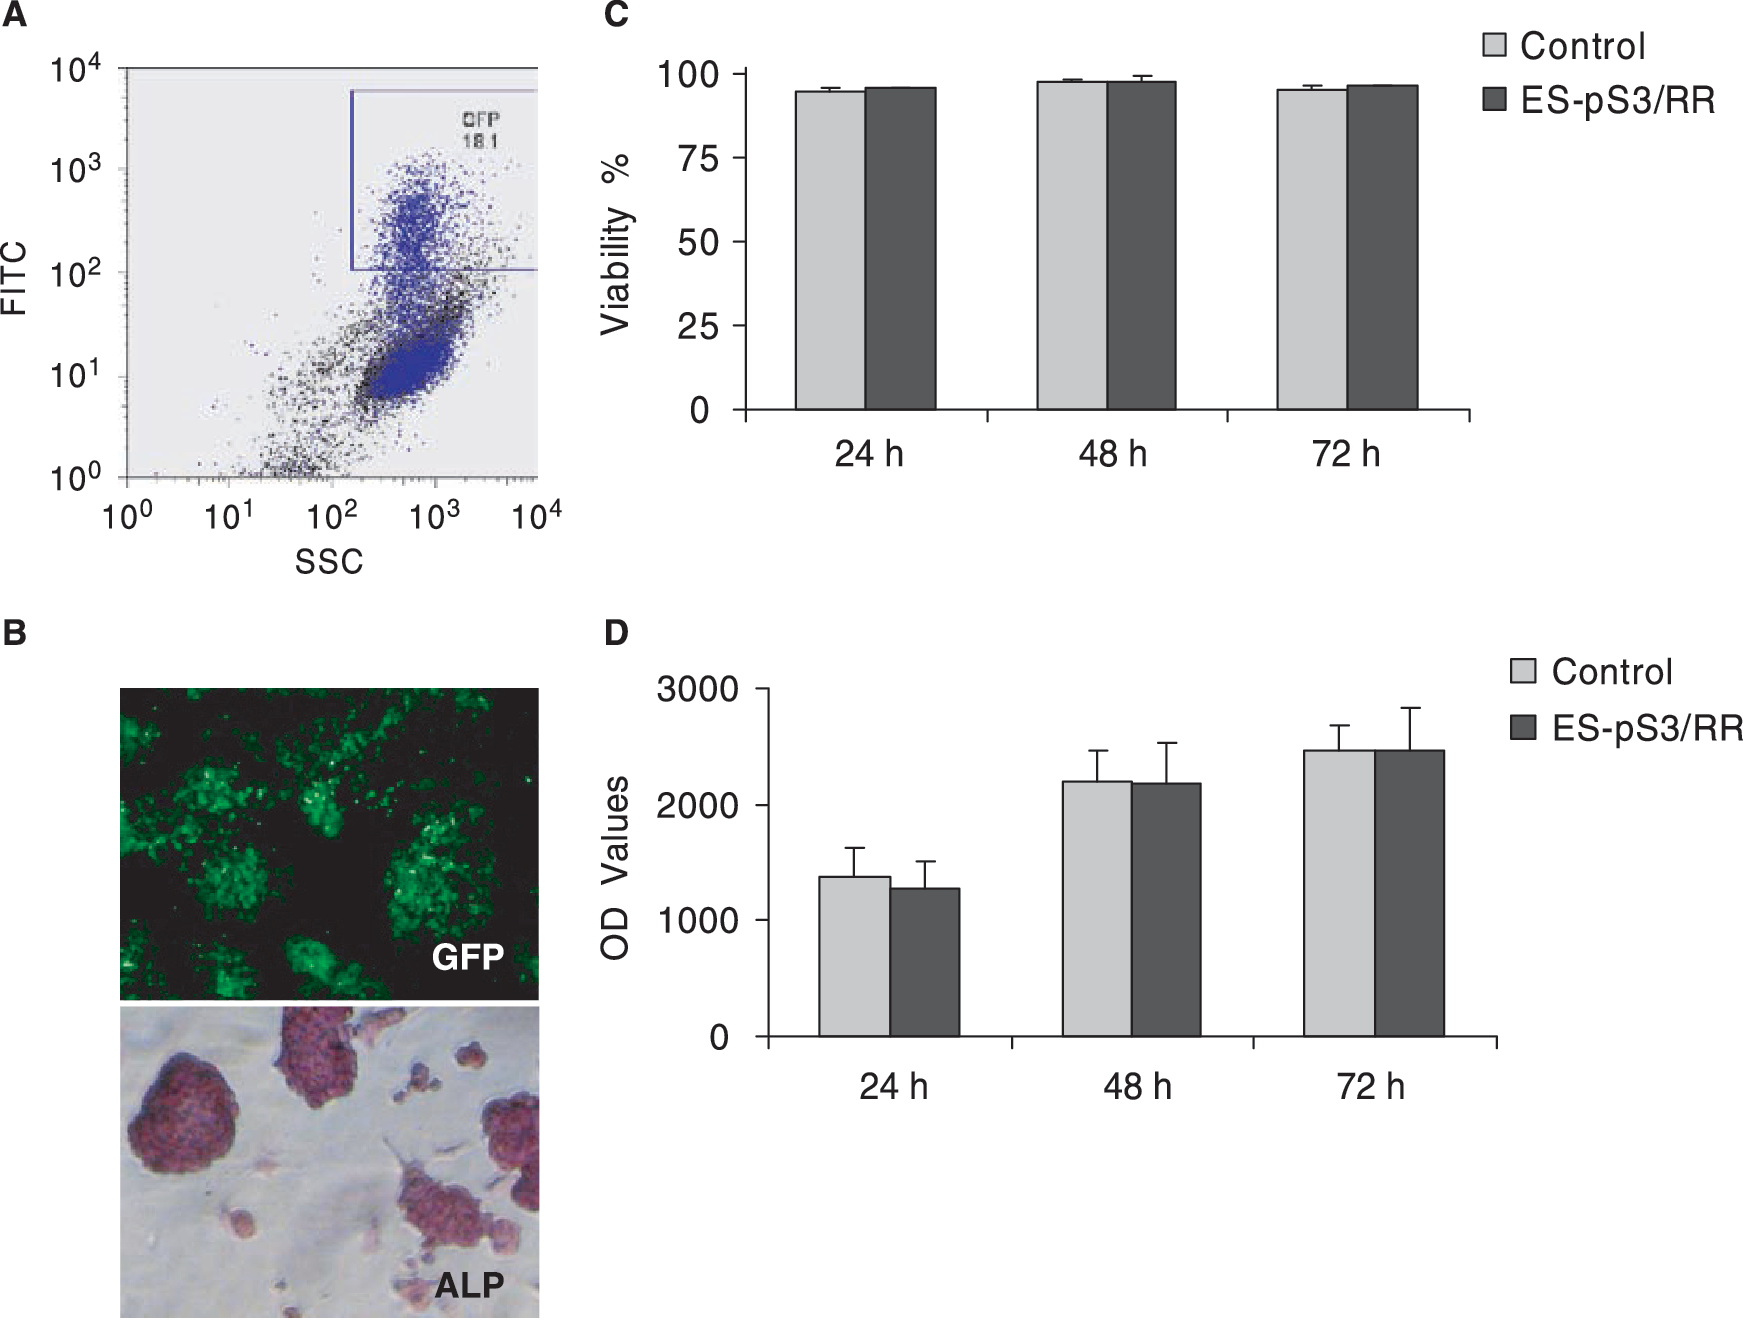
Stable transduction of mouse ES cells with STAT3 reporter construct pS3/RR. (
STAT3 activation is involved in the LIF pathway
Mouse ES cells require LIF for self-renewal [26]. The way LIF exerts its function from extracellular signaling to integrated biological responses has proven to be dependent on STAT3 [5]. Therefore, we tested whether this process can be imaged by our reporter gene expression. We investigated the temporal response of STAT3 phosphorylation in mouse ES cells upon supplementation with LIF. Mouse ES-pS3/RR cells were starved of serum and LIF for 24 h followed by stimulation with 103 U/mL of LIF for the indicated times. Similar to the study by Zhang et al. [27], most of these cells were still pluripotent and could be used as a model for STAT3 signaling. During the LIF withdrawal period, the cells retained ES cell–like morphology. Our result showed that Rluc activity, which represents STAT3 activity, increased initially within 30 min ∼7.0 ± 0.6 fold after LIF stimulation (Fig. 4A). The Rluc signal remained stable during the 2-h imaging period, but decreased steadily afterwards. Imaging results were also confirmed by Western blot, using a pair of STAT3 antibodies against total STAT3 (STAT3α, 86 kDa, and STAT3β, 79 kDa) and Phospho-STAT3 (Tyr705) only (Fig. 4B). Phosphor-STAT3 showed peak staining at 30 min after LIF treatment and remained stable for 1 h. The phosphorylation change was not caused by protein-loading differences because the total STAT3 protein level did not vary dramatically. At 120 min, the phosphorylation of STAT3 was below the detection level in Western blot (Fig. 4B); however, the Rluc activity was still detectable at the same time point (Fig. 4A). We speculate this discrepancy maybe due to the longer half-life of Rluc versus phosphor-STAT3 (50 min [28] vs. 20 minutes [29]) as well as the higher detection sensitivity of bioluminescence imaging.

Imaging ES cell STAT3 activity in response to LIF treatment. Mouse ES cells stably expressing the STAT3 responsive reporter construct (ES-pS3/RR) were serum and growth factor starved for 1 day, then treated with LIF (103 U/mL). (
Real-time imaging of STAT3 activity during ES differentiation
Previous study by Duncan et al. suggests that STAT3 plays an important role in regulating early developmental processes. In mouse embryogenesis, STAT3 expression initiates at around E7.5 in the embryo. By E9.5, STAT3 mRNA was identified in a number of tissues including the yolk sac endoderm, myometrium, cephalic mesenchyme, and blood islands. However, the investigators could not establish in which of these STAT3 is active [30]. To assess how STAT3 activation is involved in embryo development and lineage differentiation, especially in cardiomyogenesis, stably transduced ES-pS3/RR cells were induced into differentiation by withdrawal of LIF followed by treatment with differentiation medium until the formation of spontaneous contracting EBs was found. Noninvasive imaging of these EBs was performed sequentially for 21 days using the bioluminescence CCD camera (Fig. 5A). At day 5, the maximum bioluminescence signal in EBs (1.10 × 10⁵ ± 4.24 × 10³ p/s/cm2/sr) was significantly less than in undifferentiated ES cells at day 0 (1.72 × 10⁵ ± 2.97 × 10⁴ p/s/cm2/sr) (p < 0.05). However, Rluc signal increased progressively from day 5 to 14 (1.55 × 10⁵ ± 1.98 × 10⁴ p/s/cm2/sr), then decreased by day 21 (1.14 × 10⁵ ± 3.34 × 10⁴ p/s/cm2/sr), indicating the activation of STAT3 peaked at day 14 during the 3 week differentiation process (Fig. 5A). In contrast, background signal of 2.7 × 10⁴ ± 5.0 × 10³ p/s/cm2/sr was seen in control nontransduced EBs (lacking p3S/RR reporter construct) for all time points as expected (data not shown). Quantification of Rluc activity with cell lysate assay also confirmed our noninvasive imaging result (Fig. 5B). Thus, during the 21-day ES cell differentiation to cardiomyocytes, peak activity of STAT3 occurred at day 14, which was also confirmed with Western blot by phosphor-STAT3 specific antibody staining (Fig. 5C).
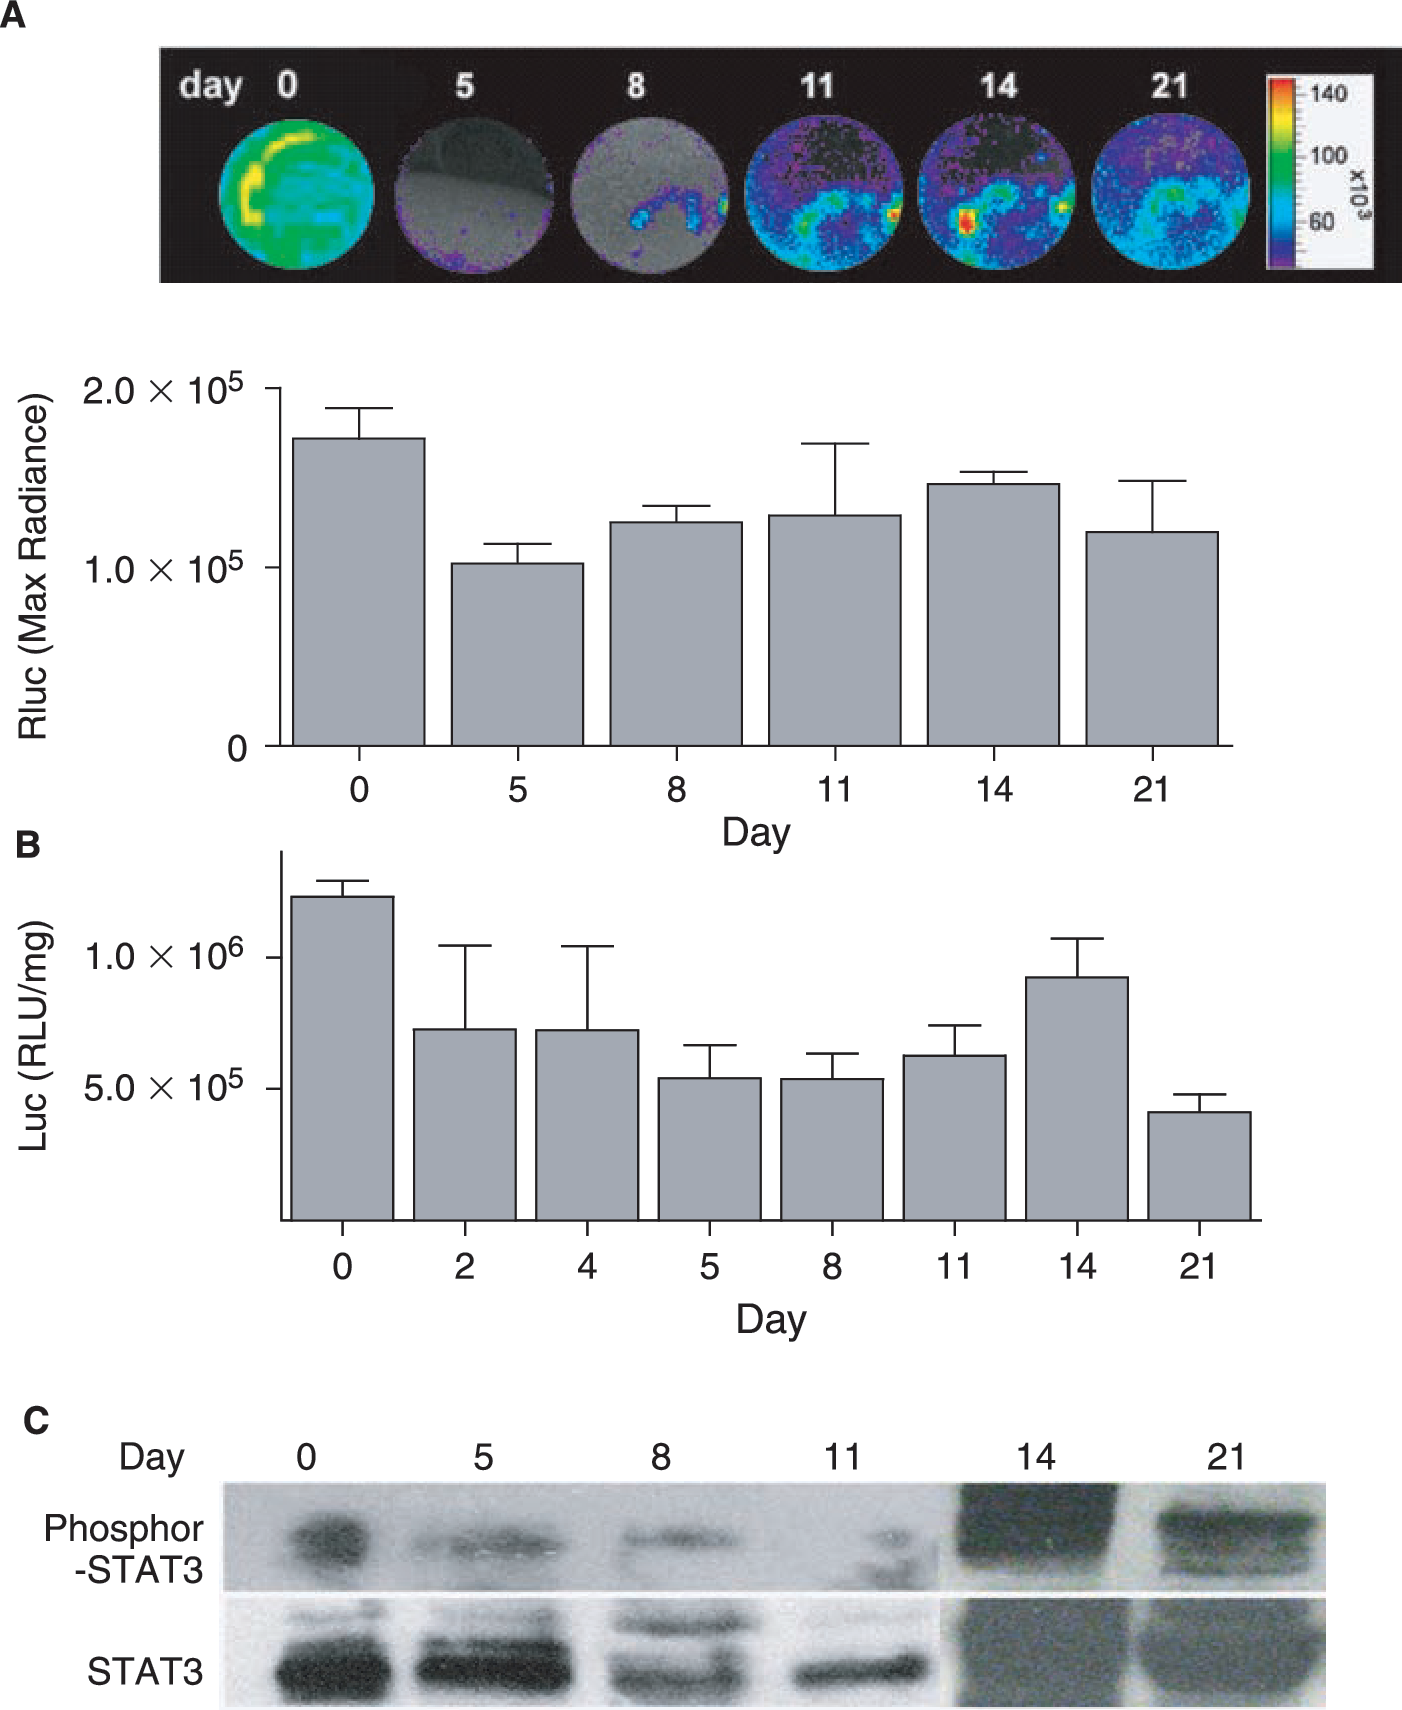
STAT3 activation is involved in mouse ES cell differentiation. (
Phosphorylation of STAT3 corresponded with cardiomyocyte derivation
The heart is the first mesoderm-derived functional embryonic organ that is developed after gastrulation [31]. To further define the coincidence of STAT3 activation and cardiomyocyte differentiation, beating clusters from day 14 EBs were dissected under microscope, trypsinized, fixed, and stained with cardiac-specific troponin T, reporter RFP, or phosphor-STAT3 antibodies. Troponin T was stained with FITC-conjugated secondary antibody. As expected, most of the troponin T positive cells were RFP or phosphor-STAT3 positive (Fig. 6A). Since the selection marker GFP loses its fluorescence after fixation, they could not contribute to background signals. All three markers also showed high colocalization with one another. By taking advantage of fluorescence protein imaging, the double fusion reporter gene allowed us to identify STAT3 activated cells as well as cardiomyocytes. Likewise, semiquantitative RT-PCR (Fig. 6B), bioluminescence imaging (Fig. 6C), and Western blot (Fig. 6D) comparing the cardiac marker β-MHC expression, the Rluc activity, and the STAT3 phosphorylation among undifferentiated mouse ES cells, day 14 EBs, and beating clusters again confirmed that STAT3 activation and cardiomyocyte differentiation occurred together. Overall, results from our group (Fig. 6B–D) and other investigators [32] demonstrate the in vitro cardiomyocyte differentiation from mouse ES cells initiates around days 5–7, and the most robust beating clusters and cardiac transcriptions appear around day 14. After this period, mature cardiomyocytes stop proliferation and the other lineages grow out robustly. The correlation of STAT3 activity with these timelines suggests that phosphorylation of STAT3 might be involved in cardiomyocyte differentiation, as reported by others as well [16,33,34].

STAT3 activation during cardiomyocyte differentiation. (
Discussion
Previous studies have demonstrated that STAT3 is indispensable in preventing mouse ES cells from differentiation [3 –5,9] as well as in promoting subsequent differentiation into various cell lineages [11 –16,33]. The mechanism of this opposing role for STAT3-signaling pathway remains unclear. A recent study shows STAT3 activity is regulated by phosphorylation and induction of STAT3β. Correspondingly, STAT3 acts as a regulator of proliferation and differentiation during development [35]. However, this hypothesis requires further investigation since proliferation and differentiation are not separate events, and it does not explain why the same level of STAT3 activity can provoke different response in different developmental stages. In order to understand STAT3 function and its temporal and spatial activity during ES cell differentiation, we developed a novel molecular imaging construct consisting of Rluc and RFP. Overall, our serial imaging results confirmed that STAT3 activity is elevated at the undifferentiated stage (day 0) as well as during EB formation (day 14). Furthermore, these imaging activities correspond with the phosphorylation of STAT3 as assessed by Western blots, and cardiomyocyte differentiation as assessed by immunostaining.
Recently, ES cells have undergone intensive scientific investigation. In addition to their potential applications in regenerative medicine, ES cells are also an ideal model to understand the early development. The self-renewal of mouse ES cell, e.g., can be maintained by a threshold level of STAT3 activation, which was deduced through a series of Western blot studies [3,9]. Here, we demonstrated the temporal kinetics of STAT3 activity during ES cell differentiation without disrupting the native cell structure. As we have shown before, reporter gene imaging can be reliably performed in intact cells and in living animals [17]. Rluc/Fluc can be used for high-throughput bioluminescence imaging of cell survival, proliferation, and intracellular events, whereas RFP/GFP allows imaging at the single-cell level by fluorescence microscopy and isolation of stable clonal population by FACS. In our study, both of these genes expressions were tightly regulated by the activation of the transcription factor STAT3. Thus, the pS3/RR reporter construct here may help us understand the activation patterns of STAT3 activity without destroying the ES cells, differentiated EBs, and their derivatives. Concurrently, applying this construct to a transgenic animal might further answer how STAT3 acts in specific tissue differentiation noninvasively.
Previous studies have shown that the expression of constitutively active STAT3 is sufficient to prevent differentiation of mouse ES cells in the absence of LIF [9], whereas a dominant negative STAT3 mutant could abolish the self-renewal as maintained by LIF [4,5]. Furthermore, in mice studies, STAT3 gene knockout leads to early embryonic lethality as a result of the embryo degenerating between E6.5 and E7.5 with no obvious mesoderm formation [36]. The available evidence thus suggests that STAT3 is a crucial nuclear target for LIF-induced-signaling pathways that regulate mouse ES cell differentiation, which, importantly, was also replicated by our STAT3 reporter construct imaging study. It is interesting to note that STAT3 activation is required in both undifferentiated and differentiated stages. A possible reason for STAT3's ability to generate a diversity of biological outcomes in different cell type might be attributed to DNA imprinting, especially in the promoter region and the shifting of responder genes to STAT3 [37]; this hypothesis will require further investigation in the future.
In conclusion, this is the first study to sequentially image native STAT3 activity during ES cell differentiation. We have provided another tool to study STAT3 in addition to STAT3 knockout and conditional-activated STAT3 [9]. Understanding the STAT3's activity might help elucidate its role in ES cell differentiation into other lineages such as endothelial, islet, neuronal, and cardiac cells.
Footnotes
Acknowledgments
This work was supported by grants from the AHA, BWF CAMS CIRM RS1–00322, and NIH HL089027 (to J.C.W.).
The authors declare no conflict of interest.
References
Supplementary Material
Please find the following supplemental material available below.
For Open Access articles published under a Creative Commons License, all supplemental material carries the same license as the article it is associated with.
For non-Open Access articles published, all supplemental material carries a non-exclusive license, and permission requests for re-use of supplemental material or any part of supplemental material shall be sent directly to the copyright owner as specified in the copyright notice associated with the article.