




Abstract
As previously shown, higher levels of NOTCH1 and increased NF-κB signaling is a distinctive feature of the more primitive umbilical cord blood (UCB) CD34+ hematopoietic stem cells (HSCs), as compared to bone marrow (BM). Differences between BM and UCB cell composition also account for this finding. The CD133 marker defines a more primitive cell subset among CD34+ HSC with a proposed hemangioblast potential. To further evaluate the molecular basis related to the more primitive characteristics of UCB and CD133+ HSC, immunomagnetically purified human CD34+ and CD133+ cells from BM and UCB were used on gene expression microarrays studies. UCB CD34+ cells contained a significantly higher proportion of CD133+ cells than BM (70% and 40%, respectively). Cluster analysis showed that BM CD133+ cells grouped with the UCB cells (CD133+ and CD34+) rather than to BM CD34+ cells. Compared with CD34+ cells, CD133+ had a higher expression of many transcription factors (TFs). Promoter analysis on all these TF genes revealed a significantly higher frequency (than expected by chance) of NF-κB-binding sites (BS), including potentially novel NF-κB targets such as RUNX1, GATA3, and USF1. Selected transcripts of TF related to primitive hematopoiesis and self-renewal, such as RUNX1, GATA3, USF1, TAL1, HOXA9, HOXB4, NOTCH1, RELB, and NFKB2 were evaluated by real-time PCR and were all significantly positively correlated. Taken together, our data indicate the existence of an interconnected transcriptional network characterized by higher levels of NOTCH1, NF-κB, and other important TFs on more primitive HSC sets.
Introduction
T
The basis for the differences observed between BM and UCB transplants are not well defined. Some of them can be partially explained by the different cellular composition of UCB and BM graft, while others, could be attributed to intrinsic cellular and molecular features related to the position of the CB-HSC and BM-HSC in the hierarchy of the HSC development.
In a previous study, we analyzed comparatively the global gene expression of CD34+ HSC from UCB and BM, and showed that CD34+ HSC from UCB have a higher expression of transcriptional targets and components of the constitutive nuclear factor kappa B (NF-κB) pathway in comparison to CD34+ HSC from BM [7]. In addition, proteins such as NOTCH1 that positively regulate NF-κB activity [8,9] were found at higher levels on UCB HSC [7]. We attributed this feature to the more primitive state of the UCB CD34+ HSC.
However, CD34+ cells represents a heterogeneous cell population composed of early and committed HSC in different developmental stages [10]. In fact, BM and UCB CD34+ HSC differ in their subpopulation compositions and the differences observed may reflect a higher proportion of more primitive CD133+ cells among UCB CD34+. For instance, in BM only around 35% of CD34+ cells express CD133, whereas in UCB, around 50% do so [11].
The surface marker CD133 defines a more primitive subpopulation of CD34+ cells that are highly enriched in long-term culture-initiating cells and NOD/SCID-repopulating cells compared to CD34+ CD133− cells [11]. Also, CD133+ UCB and BM cells, are postulated to have hemangioblast potential [12,13].
Our hypothesis is that a specific genetic network that involves, at least, the NF-κB pathway, characterizes more primitive HSC. To test this hypothesis, we analyzed the differential gene expression profile between immunomagnetically selected CD133+ and CD34+ HSC, derived from UCB and BM. In the light of recent published data, our results may indicate the existence of an interconnected regulatory transcription network, which integrates the co-expression of NF-κB, NOTCH1, and other important transcription factors (TFs), related to primitive characteristics of HSC and their proposed hemangioblast potential.
Materials and Methods
Isolation of CD34+ and CD133+ HSC
All samples were obtained after informed consent. The study was approved by the institutional Ethics Committee. Bone marrow and UCB mononuclear cells from all samples were obtained by centrifugation over Histopaque®-1077 (Sigma, St. Louis, MO) and CD34+ or CD133+ cells were immunomagnetically purified using MACS Direct Progenitor Cell Isolation Kit (Miltenyi Biotec, Bergisch Gladbach, Germany). Purity was accessed by flow cytometry (FACS; Becton Dickinson, Franklin Lakes, NJ) using anti-CD45 and anti-CD34 or anti-CD133, and isotype controls (Becton Dickinson), as previously described [7]. Mean purity of the sample pools used on microarray experiments were all >90%.
As mentioned, CD133+ cells are a subpopulation of CD34+ cells. Thus, while virtually all HSCs imunomagnetically selected using anti-CD133 antibodies co-express CD34 (CD133+CD34+), HSC selected using anti-CD34 antibodies correspond to a population with variable percentages of CD133+ cells (CD133±CD34+). In order to simplify nomenclature in this work, HSC samples are referred only by the marker used for immunoselection, except when otherwise specified.
Flow cytometry evaluation of CD34 and CD133 co-expression
To define to which extent CD34 and CD133 markers are co-expressed on HSC populations from UCB (n = 9) and BM (n = 5), mononuclear cells were evaluated by flow cytometry using monoclonal antibodies against CD34 and CD133, and appropriate isotype controls (Becton Dickinson). The percentages of CD133+ cells in the CD34+ population in BM and UCB samples were graphed and statistically compared (Mann–Whitney test) using GraphPad Prism 4.0. Additionally, six UCB samples were evaluated for the percentage of CD133 positive cells among CD34 positive cells, before and after the immunomagnetic selection using anti-CD34 antibodies. A nonparametric paired t-test was used to statistically access the changes on cell composition after the selection procedure.
RNA isolation
Total RNA from HSC samples were obtained using the Trizol LS reagent, according to the manufacturer’s instructions (Invitrogen, Carlsbad, CA), and RNA was quantified by spectrophotometry at 260 nM. Samples used for the microarray experiments were pooled and purified with RNeasy Kit (Qiagen, Valencia, CA) and RNA quality was assessed by agarose gel electrophoresis through 28S and 18S ribosomal RNA visualization.
Microarray experiments
Gene expression analysis was performed with Amersham CodeLink UniSet Human I BioArrays (Amersham Biosciences, Piscataway, NJ), containing ∼10,000 probes, as previously described [14]. Basically, Biotin-labeled cRNA generated from RNA samples were hybridized to oligonucleotide arrays and detected with a Cy5-Streptavidin conjugate. Microarray fluorescence images were acquired with a GenePix 4000B scanner using the software GenePix Pro 6.0 (Axon Instruments, Foster City, CA). Images were then analyzed with the software CodeLink Expression Analysis (CodeLink EXP v4.1; Amersham Biosciences) and the resulting normalized expression values were used for further analysis.
In order to obtain a representative expression profile of each of the cell types studied, we adopted a pooling strategy. For each cell type, 2 pools were generated with an equal number of independent samples. The number of samples used for BM CD133+, UCB CD133+, and UCB CD34+ pools were 5, 4, and 3, respectively (eg, 2 pools for BM CD133+ microarrays, with 5 independent samples in each pool). Exceptionally, bone marrow CD34 expression profiles were generated from cells obtained from 2 distinct donors, in duplicates.
The complete microarray data was deposited at ArrayExpress and can be accessed at http://www.ebi.ac.uk/microarray-as/ae (ArrayExpress accession: E-MEXP-1890).
Microarray data analysis
Hierarchical clustering. After excluding spots masked in any of the microarrays, a total of 9,925 genes were used to group the expression profiles, according to their similarities. The software Cluster 3.0 was used in the cluster procedure using a Spearman Rank Coefficient-based correlation metric and the Average Linkage method. Java TreeView was used for dendrogram generation [15,16].
Differential expression and promoter analysis. Gene expression profiles of CD133 HSC (from BM and UCB) were compared to those of CD34 HSC (from BM and UCB) and differentially expressed transcripts (upregulated or downregulated on CD133 HSC) were defined with the aid of the software SAM V3.00—Significance Analysis of Microarray [17] using a nonpaired two class analysis and T statistics.
In an attempt to identify TFs that could be responsible for the upregulation of some of these genes on CD133 HSC, the on-line tool TELIS–Transcription Element Listening System [18]—was used in two distinct promoter analyses.
Initially, TELIS was used to identify TF-binding sites (BS) significantly over-represented in the promoters of all upregulated genes on CD133+ cells, as compared to promoters of all human genes. TELIS was run using promoters of 3 distinct sizes: 300 bp and 600 bp upstream of the transcription start sites (TSSs) and a region 1,000 bp upstream to 200 bp downstream the TSS. Promoters in the TELIS database were identified by gene symbols obtained from the SOURCE database (http://smd.stanford.edu/cgi-bin/source/sourceSearch), using NCBI IDs from the microarrays. TF-BS were identified by high stringency searches (set to maximum, 0.95) using position-specific scoring matrices (PSSM) from TRANSFAC [19].
Next, in an attempt to identify key TF that could be responsible for the regulation of downstream TF, we carried a similar promoter analysis, but using only a subset of the upregulated transcripts in CD133+ cells, comprising TFs, regulators and activators (collectively referred as TF in this work). These TFs were identified using the Gene Ontology classification contained in the microarray output (IDs: GO:0003700, GO:0030528, and GO:0016563). Figures depicting the expression profiles of these TF were generated using HeatMap Builder (http://quertermous.stanford.edu/heatmap.htm). As none of the TF-BS databases used by TELIS (TRANSFAC or JASPAR) contained matrices for the Notch-regulated TF CSL, the over-representation of CSL BS could not be accessed. Conversely, RSAT—Regulatory Sequence Analysis Tools [20,21]—permits the upload and evaluation of larger promoter sequences, with user-defined TF-BS matrices. This allowed us to construct a TF-BS matrix for CSL [22] which, together with other selected BS (identified by TELIS or corresponding to TF upregulated on CD133+ cells), were searched in the promoters of selected genes. Matrices were obtained from the public TRANSFAC database [19]. Promoter sequences, 2,000 bp upstream of the TSS of the TF upregulated on CD133 HSC, were obtained from PROMOSER [23], using NCBI accession numbers from the microarray as references. Promoters from NOTCH1 and all NF-κB members were similarly obtained and analyzed. A background Markov model (order 0) was estimated from input sequences and only individual matches with a P value equal or inferior to 0.0001 were considered.
In order to identify potential regulatory elements distinctly represented on alternative promoters, RSAT was also used to search TF-BS and to compare alternative upstream (distal) promoters to proximal promoters of selected genes. Promoters of AML1c and TAL1a transcript isoforms (NCBI Acc: D43969 and S53245, respectively) were retrieved using PROMOSER, and the promoter from GATA3a was retrieved using BLAT [24,25].
Real-time quantitative-PCR
Total RNA from samples were reverse transcribed using the High Capacity cDNA Archive Kit (Applied Biosystems, Foster City, CA), according to the manufacturer’s instructions. A total of 25 UCB samples (11 CD34+ and 14 CD133+ samples) and 29 BM samples (18 CD34+ and 11 CD133+ samples) were used. All the CD34+ samples from BM and UCB, except those also used for microarray experiments, were derived from a previous study [7].
For real-time PCR experiments, we used an ABI Prism 7300 Sequence Detection System using TaqMan PCR Master Mix and probes (Applied Biosystems) for NFKB2 (Hs00174517_m1), RELB (Hs00232399_m1), NOTCH1 (Hs00413187_m1), GATA3 (Hs00231122_m1, detecting both isoforms), RUNX1 (Hs00231079_m1, detecting AML1b and AML1c isoforms and Hs01021967_m1, specific for AML1c), USF1 (Hs00273038_m1), TAL1 (Hs00268434_m1, detecting both isoforms), HOXA9 (Hs00365956_m1), HOXB4 (Hs00256884_m1), HES1 (Hs00172878_m1), and HEY1 (Hs00232618_m1). PCRs were carried in duplicates under standard thermal cycling conditions.
The housekeeping gene GAPDH was used to normalize sample loading (Applied Biosystems). For each gene, real time PCR was initially carried for BM samples and the 2 BM CD34+ samples with the median ΔCT value were used as calibrator samples during evaluation of the UCB samples, thus, allowing the comparison of all samples. The 2−ΔΔCt method [26] was used to calculate the expression, relative to the median ΔCT value of the BM CD34+ samples. A nonparametric Mann–Whitney test was used to calculate statistically significant differences. Transcript levels obtained for all HSC samples were used in a statistical correlation analysis using a nonparametric Spearman Rank test. GraphPad Prism 4.0 was used to calculate statistics and to generate graphs.
Results
Differences in the percentage of CD34+ cells expressing CD133
Our flow cytometric analysis on mononuclear cells revealed that while virtually all CD133+ cells express the CD34 marker, irrespective of the source evaluated (data not shown); CD34+ cells from BM and UCB significantly differ (P = 0.001, Mann–Whitney) in their CD133 composition. While in BM, only around 40% of the CD34+ cells express the CD133 marker, around 70% of the UCB CD34+ cells co-express the CD133 marker (Fig. 1). Furthermore, evaluation of marker composition on UCB samples before and after the immunomagnetic selection of CD34+ cells, revealed a significant increase (P = 0.0029, paired t-test) in the percentage of cells co-expressing both markers. For instance, the mean percentage of CD133+ cells among CD34+ cells increased from 63% to 80% after the procedure (Supplementary Fig. 1; Supplementary materials are available online at http://www.liebertpub.com/).
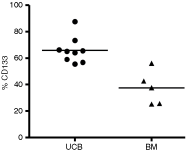
Percentage of CD133+ cells in the CD34+ population. Mononuclear cells from BM and UCB were submitted to a flow cytometry analysis to evaluate the percentage of CD133-expressing cells among the CD34+ fraction. The percentage of CD133+ cells significantly differ (P = 0.001, Mann–Whitney) between bone marrow (BM) and umbilical cord blood (UCB).
Overall gene expression similarities of HSC
Hierarchical clustering allowed us to compare the cells based on overall transcriptional similarities. As can be seen on the dendrogram displayed in Figure 2, experimental replicates from BM CD34+ samples were grouped together. Importantly, transcription profiles of pools composed of similar cells (marker and source) grouped together. Furthermore, the UCB CD34+ and UCB CD133+ groups appear as a closely related group, while, BM CD133+ and BM-CD34+ do not. In fact, BM CD133+ clustered with both UCB groups rather than with BM CD34+, which appears as a very distinct group.

Hierarchical cluster analysis. Expression values from all microarrays were used to group transcription profiles according to their similarities. Distinct pool (1 or 2) or experimental duplicates (A1, A2 and B1, B2) are indicated between parenthesis. Abbreviations: BM, bone marrow; UCB, umbilical cord blood.
Differentially expressed transcripts between CD34+ and CD133+ cells
The comparison of the gene expression profiles between CD34+ and CD133+ samples using SAM resulted in a set of 1,399 differentially expressed genes, with a median false discovery rate of 29.89% (delta value of 0.492). Of those, 1,195 were upregulated, while 204 were downregulated on CD133+ samples. The mean and median fold change of this set of differentially expressed genes was around 1.7.
Crucial genes involved with the G2-M transition, such as CDC25B (and CDC25C), CDC2, and Cyclin B1 had the highest levels on BM CD34+ cells, followed by BM CD133+, UCB CD34+, and finally UCB CD133+ cells, which had the lowest levels. This pattern was observed for many other genes involved in cell division (Supplementary Fig. 2).
A total of 75 TFs were identified and selected from the 1,195 transcripts upregulated in CD133+ cells, including factors such as EP300, MYB, RUNX1/AML1, GATA3, USF1, TAL1/SCL, HOXA9, and HOXB4 (Fig. 3).
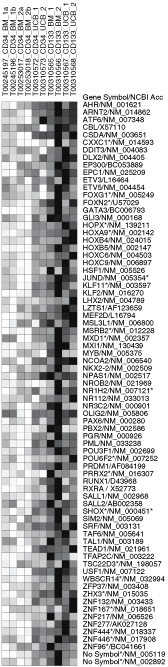
Transcription factors upregulated in CD133+ cells. The expression profiles of transcription factors, regulators, and activators, upregulated in CD133+ cells, were used to generate a heatmap depicting the relative microarray transcript levels (darker indicating higher expression levels). Abbreviations: BM, bone marrow; UCB, umbilical cord blood.
Supplementary files containing detailed results, including the complete list of differentially expressed genes (Supplementary File 1), and additional results from the following promoter analyses, with all promoters sequences and TF-BS matrices used (Supplementary Files 2, 3, and 4), can be found at our Web site http://www.hemocentro.fmrp.
Promoter analysis
Promoters from 740 genes, upregulated on CD133+ cells, were found and analyzed by TELIS (out of 1,079 gene names obtained from SOURCE). In all 3 analyses, using distinct promoter sizes, BS for MZF1, SP1, and EP300, as well as GC box elements, were considered significantly over-represented. In addition, BS for USF, AP2, AP4, and NF-κB were also considered over-represented, depending on the promoter size analyzed (Supplementary Files 2 and 3).
Further analyses of the promoters from 55s TF upregulated on CD133+ cells and found by TELIS (out of 70 obtained from SOURCE), revealed the over-representation of NF-κB BS, in all 3 analyses using distinct promoter sizes. In addition to NF-κB BS, binding sites for SP1 and E47 were also identified as over-represented, indicating their potential involvement in the transcriptional regulation of some of the factors upregulated on CD133+ cells (Supplementary Files 2 and 3).
By using RSAT, we were able to extend our analysis to the promoters of 73 of the 75 TFs upregulated on CD133+ cells. Binding sites for NF-κB, E47 and SP1 were found on 60, 51, and 62, respectively, of the promoters evaluated. In contrast, only 22 of these genes contained BS for CSL (Supplementary File 2).
In addition to the matrices identified by TELIS and the constructed CSL matrix, we selected matrices derived from BS of some TF that were upregulated on CD133+ cells, including AML1, GATA3, and MYB. The presence of BS was then evaluated on the promoters of selected genes (Supplementary Files 2 and 4). CSL BS were found in the promoters of all NF-κB members (except NFKB1) and of, NOTCH1, HOXB4, EP300, MYB, and of TAL1a, GATA3a, and AML1c isoforms. GATA3 BS were also found on the promoters of these 3 isoforms and of RELA, RELB, NFKB1, HOXA9, HOXB4, MYB, USF, and TAL1b. Finally, NF-κB BS were found on the promoters of GATA3a, MYB, USF1, EP300, HOXA9, HOXB4, both isoforms of TAL1, and AML1 and on the promoters of all NF-κB members.
When the alternative promoters of distinct isoforms of AML1, GATA3, and TAL1 were compared, a striking pattern became evident (Supplementary Files 2 and 4). Although BS for EP300, E47, GATA3, and CSL were exclusively found on the promoter of the AML1c isoform, SP1, and GC elements were only found on the promoter of AML1b. Furthermore, AML1c promoter contained more BS (with higher score and closer to the TSS) for MZF1 and USF1, as compared to the AML1b promoter. A similar trend was observed on the promoters of GATA3. Binding sites for NF-κB, MYB, CSL, and GATA3 were exclusively found on the promoter of the GATA3a isoform, which also contained more BS for MZF1, with higher score and closer to the TSS, as compared to GATA3b promoter. Moreover, SP1 and GC elements were enriched on the GATA3b promoter. Finally, few differences were identified between the alternative promoters of TAL1, with exclusive BS for CSL and E47 on TAL1a promoter, and MYB on TAL1b promoter.
Real-time PCR transcript evaluation
Evaluation of the transcript levels by real-time PCR confirmed the result found by microarray (Fig. 4). Except for TAL1, transcript levels of GATA3, RUNX1 (AML1b plus AML1c isoforms), USF1, HOXA9, and HOXB4 were at significantly higher levels on BM CD133+ cells, compared to BM CD34+ cells. In addition to the TF selected by the microarray analysis, NFKB2, RELB, and NOTCH1 were also evaluated, and followed the same expression pattern. In contrast, except for USF1, HOXB4, and HOXA9, there was no significant difference between UCB CD34+ cells and UCB CD133+ cells, for any of these transcripts.
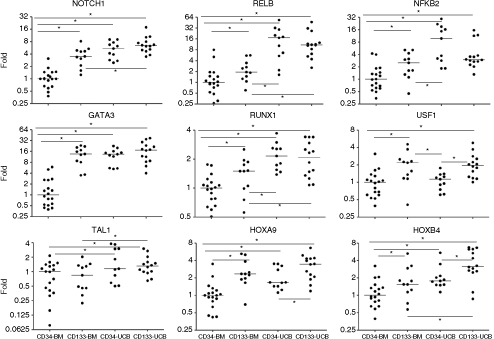
Gene expression levels of evaluated transcripts on hematopoietic stem cell (HSC). Transcript levels of NFKB2, RELB, NOTCH1, GATA3, RUNX1, USF1, TAL1, HOXA9, and HOXB4 were evaluated by real-time PCR. Expression levels are shown as fold relative to the median value of the BM CD34+ samples. Asterisk (*) indicates a P value <0.05. Abbreviations: BM, bone marrow; UCB, umbilical cord blood.
Furthermore, except for USF1, all transcripts were at higher levels on UCB CD34+ cells than BM CD34+ cells. A higher expression level was also found on UCB CD133+ cells, compared to BM CD133+ cells, except for HOXA9, GATA3, USF1, and NFKB2.
The quantification of the AML1c isoform, using a different Real Time probe on a subset of samples from CD34+ and CD133+ cells from BM, revealed that the relative fold difference between BM CD34+ and CD133+ samples was similar to that observed with the unspecific RUNX1 probe (AML1b-c). However, for this specific subset of samples analyzed, while the difference obtained using the probe for the AML1c isoform was significant (P = 0.0322), the one obtained with the AML1b-c probe (P = 0.0835) was not (Supplementary Fig. 3).
The quantification of the HES1 and HEY1, carried on a subset of the samples, revealed that HES1 was expressed at statistically significant higher levels on UCB, compared to BM for both, CD34+ (P = 0.0380) or CD133+ cells (P = 0.0003). For HEY1, there was also difference between BM and UCB when comparing CD34+ cells (P = 0.0036), but not CD133+ cells. Moreover, in BM, HEY1 levels were significantly higher (P = 0.0061) in CD133+ cells compared to CD34+ cells (Supplementary Fig. 4).
Correlated expression patterns
To uncover potentially co-regulated genes, we carried a correlation analysis between the evaluated transcripts. Our results allowed us to detect a statistically significant correlation between all the transcripts evaluated (Table 1). As can be seen in Table 1, NOTCH1, RUNX1 (AML1b-c), GATA3, and HOXA9 are all correlated to each other with high correlation coefficients and statistical significance (Spearman r > 0.7 and P < 0.0001). Similarly, NOTCH1, RELB, and GATA3 are also connected by high correlation coefficients (r > 0.7 and P < 0.0001). In addition, highly correlated levels are found between HOXB4 and HOXA9 transcripts (r = 0.87), as well as between RELB and NFKB2 (r = 0.88).
C
Spearman correlation coefficient (r) values are displayed for each comparison. Values above 0.7 are in bold to highlight strong correlations.
Correlation analysis using a subset of samples from CD34+ and CD133+ cells from BM, revealed a significant correlation between the transcript levels of TAL1 and AML1c (P = 0.0006 and R = 0.59); in contrast, there was no significant correlation between TAL1 and AML1b-c (P = 0.06 and R = 0.30; Supplementary Fig. 3).
Discussion
In a previous study, we showed that a higher expression of transcription targets and components of the NF-κB pathway is a distinctive feature of UCB CD34+ HSC as compared to BM CD34+ and this could be related with the primitive state of the newborn’s HSC [7].
In order to better characterize the differences between cellular composition of CD34+ HSC from BM and UCB, we used flow cytometry to evaluate the percentage of CD133+ cells. In line with reported data [11], our results revealed that, while virtually all CD133+ cells express the CD34 marker irrespective of the source evaluated, CD34+ cells from BM and UCB significantly differ in the percentage of CD133 co-expressing cells (Fig. 1). These results clearly identified a higher proportion of more primitive CD133+ cells among UCB CD34+ cells, compared to BM, and guided us during gene expression analysis.
By carrying a cluster analysis of the microarrays expression profiles (Fig. 2), we observed the closest grouping for the experimental replicates from BM CD34+ cells, reflecting the experimental reproducibility of the microarray platform. Moreover, the independent grouping of the transcription profiles from pools composed of similar cells (CD34 or CD133 from BM or UCB) indicates that our pooling approach generated a representative gene expression profile, reflecting overall similarities and differences between the analyzed cells.
Interestingly, the close grouping of UCB CD34+ and UCB CD133+ samples followed by BM CD133+ and finally by BM CD34+ samples, indicates that the CD133 marker, in fact, defines a more primitive population inside the BM CD34+ population, with molecular characteristics closer to the ontologically more primitive UCB. Nevertheless, this result also indicates that even CD133+ cells from BM and CD133+ from UCB are different, as they do not group together. Our results are in line with the observation carried for the primitive CD38 negative subset of CD34+ HSC, which is more abundant in UCB [27]. Even this subpopulation has distinct intrinsic properties depending on the ontological age [28].
As most of the CD133 positive cells are CD34bright and CD34dim cells are CD133 negative [29], we reasoned that upon immunomagnetic selection of CD34+ cells, the percentage of CD133 co-expressing cells could increase, as the selection method would preferentially isolate cells with greater number of CD34-binding epitopes (CD34bright cells), what would explain the high proportion of CD133+ cells found among CD34+ selected cells reported by different authors [30 –32]. In fact, our analysis corroborated our assumption revealing that, despite the use of different markers, CD34+ and CD133+ cells immunomagnetically selected from UCB are very similar in terms of cellular composition. This would partially explain the close grouping of UCB CD133+ and UCB CD34+ samples obtained in our cluster analysis (Fig. 2).
An important characteristic of primitive stem cells is their cycling status, which is related to their quiescence. BM CD34+ cells display increased cycling compared to UCB CD34+ cells, as defined by the percentage of cells in G2/M phase (5.3% and 0.3%, respectively) [33]. In agreement, crucial genes involved with the G2-M transition, such as CDC25B (and CDC25C), CDC2, and Cyclin B1 were expressed at higher levels on BM CD34+ cells, compared to UCB CD34+ cells (as determined by microarray). The same was true for CD133+ cells, which had a much lower expression level compared to CD34+ cells from the corresponding source. Moreover, several other genes involved in cell division followed the same pattern (Supplementary Fig. 2), thus, reflecting a more quiescent state of UCB/CD133+ cells, as compared to BM/CD34+ cells.
By further comparing microarray expression profiles, we identified many TFs at higher levels on CD133+ samples, compared to CD34+ samples (Fig. 3). Among these, we found many factors with important functions related to the regulation of hematopoiesis in the early stages of development as well as to self-renewal of HSC such as, EP300 [34,35], MYB [34,36], RUNX1/AML1 [37,38], GATA3 [39], USF1 [40,41], TAL1/SCL [42 –45], HOXA9 [46 –48], and HOXB4 [49].
Although the enrichment of these TF on CD133+ cells defines, per se, biologically significant regulatory mechanisms related to the proposed hemangioblast potential of these cells, promoter analyses carried in this work allowed us to identify many know, as well as potentially new regulatory mechanism acting on HSC.
The over-representation of EP300-BS in the promoters of the whole set of upregulated transcripts on CD133+ cells, and the upregulation of EP300 itself lead us to investigate the potential role of this protein on the regulation of other TFs identified in this study.
The protein EP300 is a histone acetyltransferase (HAT) that acts on the chromatin structure by reducing the affinity of histones for DNA and consequently, increasing the accessibility of transcriptional regulatory proteins to the DNA. This action can occur in a generally broader way, or in a more restricted gene-specific way, guided by the interaction of EP300 with sequence-specific DNA-binding proteins [50]. Interestingly, in addition to guiding EP300 to specific promoters, the regulatory proteins themselves may be acetylated and regulated by EP300 [51]. Strikingly, EP300 interacts and acetylates many of the TF identified by us, including MYB [52], NF-κB [53], GATA1/3 [54], TAL1 [55,56], and RUNX1 [57]. Moreover, EP300 also binds to NOTCH and promotes the transcription of its targets [58].
The MYB protein plays a critical role on HSCs [36], controlling their proliferation and differentiation through its interaction with EP300 [34]. Interestingly, acetylation of MYB by EP300 increases its DNA-binding activity, upregulating the expression of the HSC marker CD34, one of its targets [52]. Of notice, the enrichment of MYB on more primitive HSC was reported a long time ago and members of the NF-κB family are involved in the positive regulation of its transcription [59]. In line, acetylation of NF-κB members by EP300, also positively regulates their activity [53], and this could contribute to the potential role of NF-κB in the upregulation of some transcripts (including MYB), on more primitive HSC subsets, as observed by us.
By restricting the analysis to the promoters of the genes upregulated on CD133+ cells, we could identify the over-representation of NF-κB-binding sites, further corroborating our assumption that NF-κB may, in fact, play an important role in the control of the characteristics of primitive HSC [7].Consistently, NFKB2 and RELB were expressed at significantly higher levels on BM CD133+ cells, compared to BM CD34+ cells. Moreover, compared to BM, UCB cells had significantly higher levels for these transcripts for both, CD34+ or CD133+ cells (except for NFKB2 between BM and UCB CD133+ cells, P = 0.0992).
The transcript quantification of selected TF in a large number of independent HSC samples, allowed us to identify the existence of statistically significant correlations between evaluated transcripts and further explore the potential regulatory mechanisms underlying the genetic program of primitive HSC.
Interestingly, NOTCH1 and GATA3 transcripts were highly correlated and recent works published during the course of our research described the direct regulation of GATA3 by NOTCH1, what could account for the strong correlation observed by us [60 –62]. Accordingly, we could identify CSL-BS in the promoter of GATA3a.
Transcript levels of USF1 and HOXB4 were also highly correlated, what may reflect the potential regulation of HOXB4 transcription by USF1 [40,41]. Interestingly, HOXA9 and HOXB4 levels were highly correlated to each other (r = 0.87) and also with RUNX1, GATA3, and NOTCH1, indicating that other factors in addition to USF1 may play more important roles on the regulation of HOXB4 in HSC.
Of notice, the presence of CSL BS in the promoters of the AML1c isoform and the correlation between NOTCH1 and AML1b-c transcripts is in line with the proposed downstream role of RUNX1, relative to NOTCH1, in the generation of HSC from the “hemogenic endothelium” [63,64]. However, as GATA3 BS were also found on the promoter of the AML1c isoform, and their transcripts levels are highly correlated, this would also indicate a positive regulation of the AML1c isoform by GATA3. Also, by interacting to BS found on the promoters of both AML1 isoforms, NF-κB could contribute to their regulation. In line, evaluation of AML1b-c by Real-Time PCR confirmed their higher levels on BM CD133+ cells, compared to BM CD34+ cells (the same pattern of NFKB2 and RELB).
In addition to NF-κB-binding sites, E47 BS were also over-represented in the promoters of the TF upregulated on CD133+ cells. The E47 protein is coded by the E2A gene and it can bind to DNA as a homodimer or as a heterodimer together with TAL1 [65]. While E47 homodimers are considered transcriptional activators, TAL1 can exert positive or negative effects on transcription [66].
During development, TAL1 is required for genesis of HSC but is dispensable for adult HSC functions such as engraftment, self-renewal, and differentiation into myeloid and lymphoid lineages. Nevertheless, megakaryopoiesis and erythropoiesis depend on TAL1, whereas lymphocytes are partially affected by the absence of this TF [67]. In contrast, E47 is not required for HSC emergence, but, in its absence, adult HSC homeostasis and lymphoid differentiation are affected [68,69].
Interestingly, Notch signaling can interfere with E47 and TAL1 through distinct mechanisms, including the inhibition of E47 by a noncanonical CSL-independent Notch pathway, presumably via Deltex [70], or inducing the ubiquitination and degradation of both [71]. In contrast, TAL1 can promote the activation of Notch signaling [66], whereas E47 can induce the expression of diverse genes associated with Notch signaling including NOTCH1 [68]. The above observations may indicate a negative feedback mechanism that could take place during lymphoid differentiation at later stages, fine-tuning the activity of TAL1 and E47 [68,72].
Of great interest, alternative promoter usage, allows the selective expression of different transcript isoforms from a given gene. With that in mind, we reasoned that an alternative promoter with the exclusive (or preferential) presence of TF-BS considered over-represented by TELIS (or corresponding to TF upregulated on CD133+ cells), could potentially indicate its preferential use on more primitive HSC, with the consequent expression of the corresponding transcript isoform.
When previously identified alternative promoters of AML1 [73], GATA3 [24], and TAL1 [74] were compared, few differences were identified between the alternative promoters of TAL1. In contrast, marked differences between the alternative promoters of AML1 and GATA3 became evident. Binding sites for NF-κB, MYB, NOTCH1-binding-partner CSL, and GATA3 were exclusively found on the promoter of the GATA3a isoform, which also contained more BS for MZF1, with higher score and closer to the TSS, as compared to GATA3b promoter. Strikingly, all of these BS were considered over-represented by TELIS or were associated to TF upregulated on CD133+ cells.
A similar trend was observed on the alternative promoters of AML1. The AML1c promoter contained exclusive BS for EP300, TAL1-binding-partner E47, GATA3, and the NOTCH1-binding-partner CSL. Furthermore, the AML1c promoter also contained more BS for MZF1 and USF1, compared to the AML1b promoter. Interestingly, recent works have described the regulation of AML1 by factors including TAL1 [75,76].
To investigate whether the AML1c isoform would, in fact, be regulated by TAL1, we specifically quantified AML1c transcripts on a subset of BM CD34+ and CD133+ samples. In corroboration to the proposed preferential use of the AML1c promoter, the transcript levels of TAL1 were significantly correlated to AML1c but not to AML1b-c. Moreover, the relative fold differences between BM CD34+ and CD133+ samples were significant for AML1c, but not for AML1b-c. Altogether, our data may indicate that the higher transcript levels of the AML1c isoform on more primitive HSC, would be, partially controlled by TAL1/E47.
A higher level of NOTCH1, on more primitive HSC, may also be related to increased NF-κB signaling. An increasing amount of data indicate the coordinated activation of NOTCH and NF-κB signaling on normal and pathological processes [77 –79]. Also, EP300 is involved in the crosstalk between both pathways [80]. Interestingly, NOTCH1 is known to positively regulate NF-κB activity, upregulating the transcription of NF-κB subunit, and facilitating the nuclear retention of NF-κB complexes [8,9] as well as de-repressing the NFKB2 promoter [81,82]. Further highlighting the potential interplay between these TF on HSC, NOTCH1, RELB, and NFKB2 transcript levels were highly correlated. Accordingly, we could identify CSL-BS in the promoters of all NF-κB members (except NFKB1) and NOTCH1, whereas NF-κB BS were found on the promoters of all NF-κB members but not on NOTCH1.
During development, NOTCH1 has a known and indispensable role in the emergence of definitive HSCs from endothelial cells of the aorta-gonad-mesonephros [64].
Upon cell–cell contacts, the interaction of specific ligands to Notch receptors promotes their cleavage and the release of the Notch intracellular domain (NICD), which translocates to the nucleus and binds the TF CSL forming, together with Mastermind-like proteins (MAMLs), a ternary complex. This complex can recruit transcriptional coactivators, such as histone acetyltransferase p300, to activate Notch target genes, including HES1 and HEY1 [83].
Many studies have attributed important roles for Notch signaling in the regulation of differentiation and self-renewal of distinct types of stem cells [84]. Specifically on HSC, although some reports have concluded that increased Notch signaling promotes self-renewal and decreases differentiation, in physiological conditions canonical Notch signaling seems to be dispensable for adult HSC maintenance [85]. Nevertheless, the potential role of a noncanonical Notch pathway (independent of MAMDL or CSL) cannot be excluded from these experiments. In fact, noncanonical Notch signaling can inhibit apoptosis triggered by the withdrawal of nutrients, showing that Notch NICD can mediate important functions, independent of CSL and outside the nucleus [86].
Whether UCB HSC, experienced canonical Notch signaling before detaching from their niches or whether some form of noncanonical Notch signaling [87] actively occurs in these cells is an open issue. In an attempt to evaluate Notch signaling in the cell populations studied, transcript levels of HES1 and HEY1 were quantified. The results revealed that HES1 were at higher levels on CD34+ and CD133+ UCB cells, compared to their BM counterparts. This was also noticed for HEY1 when comparing CD34+ cells, but not CD133+ cells. Moreover, in BM, HEY1 levels were significantly higher in CD133+ cells compared to CD34+ cells. These results could indicate increased Notch signaling on HSC from the UCB. In fact, despite the arguable role of Notch in the maintenance of adult HSC, Notch is indispensable for the commitment of T cells in the thymus [88] and also at extrathymic sites, following BM transplantation [89]. The increased transcript levels of NOTCH1, TAL1, distinct NF-κB subunits, and other TF on UCB HSC may prompt these cells to respond more effectively to signals driving lymphopoiesis, even at extrathymic sites, consistent with the ongoing establishment of a newborn hematopoietic system. Alternatively, higher levels of Notch targets may indicate that UCB HSC may have experienced Notch signaling before transiently detaching from their niches to circulate and migrate to definitive niches. This would also explain why marrow-ablated receptors transplanted with HSC from UCB show a better reconstitution of early and committed hematopoietic progenitors and a higher thymic function and TCR diversity, as compared to those receiving HSC from BM [1,2].
Finally, despite the known regulation of HES1 and HEY1 by canonical Notch signaling, their transcription cannot be attributed exclusively to this pathway. For instance, basal levels of HES1 on adult mouse hematopoietic progenitors are not dependent on canonical Notch signaling, as progenitors expressing a dominant negative form of MAML (DNMAML) do not differ in HES1 levels [85]. Interestingly, the NF-κB inhibitory protein IκB can occupy the promoter of HES1 and transcriptionally repress it, while following TNF-α treatment, IKKs are recruited to the HES1 promoter and IκB is released, activating HES1 transcription [90]. This mechanism could indicate that higher levels of HES1 on UCB cells may also be related to NF-κB signaling.
Conclusion
Our work compared distinct HSC populations, as defined by the expression of classic surface markers. The identification of TFs in higher level on HSC considered more primitive (high expression of CD133 marker and/or derived from UCB) and the presence of their corresponding BS in each other’s promoters, may indicate the existence of a core circuitry, analogous to that proposed for embryonic stem cells [91]. Together, these factors would keep their levels up-regulated, through autoregulatory and feedforward loops, controlling the expression of genes responsible for the distinct characteristics of the HSC populations studied. Better understanding of the molecular mechanisms controlling adult HSC properties, such as self-renewal and differentiation, would greatly impact the in vitro generation and expansion of HSC and could improve the early reconstitution of certain blood lineages (such as T-cells), following HSC transplantation.
Footnotes
Acknowledgments
The authors would like to thank Aline C.G. Silva, Viviane C. Oliveira, Greice A. Molfetta, and Marli H. Tavela for their assistance with laboratory techniques. This work was supported by Fundação de Amparo à Pesquisa do Estado de São Paulo (FAPESP), Conselho Nacional de Desenvolvimento Científico e Tecnológico (CNPq), and Financiadora de Estudos e Projetos (FINEP), Brazil.
Author Disclosure Statement
No competing financial interests exist.