
Abstract
MicroRNAs (miRNAs), important regulators of cellular processes, show specific expression signatures in different blood cell lineages and stages of hematopoietic stem cell (HSC) differentiation, indicating their role in the control of hematopoiesis. Because neonatal blood displays various features of immaturity, we might expect differential miRNA regulation. Herein, we determined miRNA expression profiles of umbilical cord blood (UCB) cell lineages and compared them to those of bone marrow (BM) and peripheral blood (PB) cell counterparts. Further, we determined mRNA expression profiles using whole-genome microarrays. An approach combining bioinformatic prediction of miRNA targets with mRNA expression profiling was used to search for putative targets of miRNAs with potential functions in UCB. We pointed out several differentially expressed miRNAs and associated their expression with the target transcript levels. miR-148a expression was suppressed in HSCs and its level inversely correlated with the previously verified target, DNA methyltransferase 3B, suggesting dependence of de novo DNA methylation in HSCs on miR-148a. Prolonged cell survival of UCB HSCs may be associated with low expression of miR-143 and miR-145 and up-regulation of their downstream targets (high expression of c-MYC and miR-17-92 and following repression of TGFBR2). In HSCs, we monitored significant up-regulation of eight miRNAs, which were previously verified as regulators of HOX genes. Further, miR-146b may be associated with immaturity of neonatal immune system because it is strongly up-regulated in UCB granulocytes and T lymphocytes compared to PB cell counterparts. Comparative analysis revealed 13 miRNAs significantly altered between UCB and BM CD34+ cells. In UCB CD34+ cells, we monitored up-regulation of miR-520h, promoting differentiation of HSCs into progenitor cells, and reduction of miR-214, whose expression might support HSC survival. In conclusion, UCB cells show specific miRNA expression patterns, indicating different regulation in these cells.
Introduction
M
We hypothesized that specific features of neonatal blood, resulting from altered signal transduction mechanisms, may be associated with differential regulation of miRNAs. In this study, we analyzed miRNA expression signatures in UCB cell lineages (CD34+ stem/progenitor cells, T lymphocytes, monocytes, and granulocytes) and studied differences of miRNA transcript levels between UCB, PB, and bone marrow (BM) cells with emphasis on UCB HSCs.
Materials and Methods
Cell samples
Ten samples of UCB were obtained from Cord Blood Bank of the Czech Republic (kindly provided by Dr. Kobylka). Peripheral blood was collected from 10 adult donors (age ranged from 25 to 74 years, median 35, equal male/female distribution). Three samples of CD34+ cells isolated from BM of healthy individuals using positive immunomagnetic selection were purchased from Lonza (Basel, Switzerland). All blood samples were obtained with donor’s written informed consent.
Mononuclear cells and granulocytes were separated by Ficoll-Paque (Sigma, St Louis, MO, USA) density gradient centrifugation. To separate individual lineages of the mononuclear cells, following MACS kits were used according to manufacturer’s protocol: CD3+ (T lymphocytes), CD14+ (monocytes), and CD34+ cells (stem/progenitor cells) (Myltenyi Biotech, Bergisch Gladbach, Germany). The purity of isolated cell lineages was controlled using FACSAria (Becton Dickinson, San Jose, CA) and purity of the isolated cells was >95%.
Total RNA extraction
Total RNA was isolated by TriReagent (MRC, Cincinnati, OH) and RNA quality was assessed by Agilent 2100 Bioanalyzer instrument (Agilent Technologies, Santa Clara, CA). The RNA quality was comparable among all samples; only the samples with RNA integrity number (RIN) >7.5 were used for gene expression profiling.
Quantification of miRNA expression
TaqMan Low Density Arrays (TLDA; Applied Biosystems, Foster City, CA) were used for gene expression profiling of 365 miRNAs and several small nuclear RNAs (RNU6B, RNU44, RNU48) in three samples of each UCB cell lineage (CD34+ cells, T lymphocytes, monocytes, and granulocytes) and in three samples of BM CD34+ cells. Total RNA (75 ng per pool) was reverse-transcribed using Human Multiplex RT Set and TaqMan® MicroRNA Reverse Transcription Kit (Applied Biosystems). cDNA was loaded to the TaqMan® Array Human MicroRNA Panel v1.0 microfluidic card that was analyzed on 7900HT Fast Real-Time PCR System (Applied Biosystems).
SDS 2.3 Software and RQ Manager 1.2 software (both Applied Biosystems) were used for the analysis of TLDA data. The undetectable miRNAs were excluded from further analysis. The data were normalized to an endogenous control RNU48 since it showed the most consistent expression in our samples (data not shown). The relative miRNA expression levels were calculated by the ΔC T method. To obtain normal linear distribution, logarithmic transformation was performed.
Quantification of mRNA expression
Gene expression profiling of messenger RNA (mRNA) was carried out in the same UCB and BM samples using Illumina microarray system (Illumina, San Diego, CA). Total RNA (200 ng) was transcribed into cRNA using Illumina TotalPrep RNA Amplification Kit (Ambion, Foster City, CA). After in vitro transcription, cRNA quality was verified by Agilent 2100 Bioanalyzer instrument. The cRNA (750 ng) was hybridized to HumanRef-8 v2 Expression BeadChip (Illumina). The microarrays were scanned using Illumina BeadArray Reader.
Quality control and quantile normalization of the microarray data was done by BeadStudio 3.0 software (Illumina). To reduce false positives, we filtered out the undetectable genes (detection P > 0.05 in all arrays).
Validation of array data by qRT-PCR
Validation of miRNA array data was performed in a larger set of UCB (n = 10) and PB (n = 10) samples by singleplex quantitative real-time PCR (qRT-PCR) using TaqMan MicroRNA Expression Assays (Applied Biosystems) and RotorGene 3000 apparatus (Corbett Research, Sydney, Australia). The data were normalized to the endogenous control RNU48 and the relative miRNA expression levels were calculated by the ΔC T method.
Data analysis
Hierarchical clustering of miRNA expression data was done using average linkage and Euclidean distance. Analysis of variance (ANOVA) was performed using a 0.1% false discovery rate threshold to identify differentially expressed miRNAs/mRNAs between UCB cell lineages. Non-parametric Mann–Whitney test was applied to find out differentially expressed miRNAs/mRNAs between UBC and PB or UCB and BM samples. All analyses were performed using Genesis 1.6.0Beta1 software (http://genome.tugraz.at/) and GraphPad Prism 4 software (GraphPad Software, La Jolla, CA).
Putative targets of the miRNAs were predicted by miRBase Targets v.5 (http://microrna.sanger.ac.uk/), TargetScan 4.2 (http://www.targetscan.org/), and PicTar (http://pictar.mdc-berlin.de/).
Results
Hierarchical clustering of UCB cell lineages based on miRNA expressions
miRNA expression profiles were determined in CD34+ progenitor cells, T lymphocytes, monocytes, and granulocytes of three UCB samples using TLDA. Out of 365 miRNAs, 78 miRNAs were undetectable across all samples and were excluded from further analysis. An unsupervised hierarchical cluster analysis of 287 miRNAs revealed specific miRNA signatures for each cell lineage that discriminated samples according to their origin (Fig. 1).
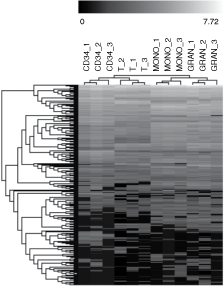
Hierarchical cluster analysis of umbilical cord blood cell lineage samples according to their miRNA expression profiles. Each column represents a sample and each row represents a single miRNA. The black and white scale encodes the logarithm of relative gene expression level (black indicates the lowest expression; white indicates the highest expression).
Figure 2 shows expression patterns of 10 miRNAs with the highest transcript levels across all tested cell lineages. The highest expression was detected in these miRNAs: miR-223, miR-142-3p, miR-16, miR-26a, and miR-92. miR-223 was predominantly expressed in monocytes, granulocytes, as well as in CD34+ cells, but its expression was ∼100-fold reduced in T lymphocytes. miR-142-3p, miR-16, miR-26a had similar expression patterns, showing the highest expression in granulocytes and the lowest expression in CD34+ cells. On the contrary, miR-92 showed at least 2-fold higher transcript level in CD34+ cells compared to the rest of samples. Interestingly, three members of oncogenic cluster miR-17-92 (miR-19b, miR-20a, and miR-92) were present in the set of 10 abundantly expressed miRNAs in CD34+ cells.
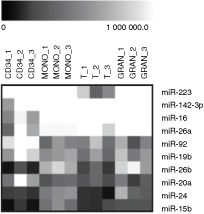
Ten miRNAs with the highest expression across all tested umbilical cord blood cell lineages. The black and white scale encodes the relative gene expression level (black indicates the lowest expression; white indicates the highest expression).
Differentially expressed miRNAs in UCB cell lineages
ANOVA test with a 0.1% false discovery rate filter was applied to TLDA data set to identify differentially expressed miRNAs between UCB cell lineages and 48 miRNAs were found.
The largest set of differentially expressed miRNAs was observed in CD34+ cells (Fig. 3B). It comprised 19 miRNAs, for example, down-regulation of miR-143-3p, up-regulation of miR-181d and miR-222. Further, a group of miRNAs regulating HOX genes (miR-10a/b, miR-99a/b, miR-126, miR-130a, and miR-196b) [13 –18] was overexpressed in CD34+ cells.
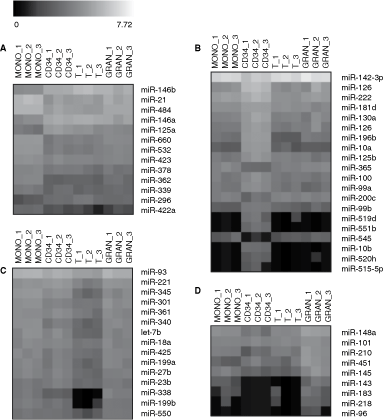
Differentially expressed miRNAs in particular umbilical cord blood cell lineages. False discovery rate filter was set up to P = 0.001 (with exception of granulocytes P = 0.01). The black and white scale encodes the logarithm of relative gene expression level (black indicates the lowest expression; white indicates high expression). (
In monocytes, 13 miRNAs showed differential expression (Fig. 3A). Transcript level of nine miRNAs was increased (eg, miR-21 or miRNA cluster on chromosome X comprising miR-362, miR-500, miR-501, miR-502, miR-532, and miR-660) and expression of four miRNAs was reduced (eg, miR-146a/b). In T lymphocytes, 14 miRNA genes were down-regulated (eg, let-7b, miR-221) but no significant increase of miRNA level was observed (Fig. 3C). In granulocytes, only increased expression of miR-218 passed the 0.1% false discovery rate filter but up-regulation of other eight miRNAs was revealed when the stringency was lightened to 1%, for example up-regulation of miR-143, miR-145, miR-148a, and miR-451 (Fig. 3D).
miRNA expression profiles of UCB and BM CD34+ progenitor cells
To determine differences in miRNA expression between UCB and BM CD34+ progenitor cells, we performed miRNA profiling using TLDA method (performed in triplicates). Ninety-seven miRNAs with no signal were excluded from analysis. An unsupervised hierarchical cluster analysis was applied to the set of 268 miRNAs and the analysis distinguished the origin of progenitor cells based on miRNA expression pattern (Fig. 4).
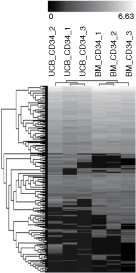
Hierarchical cluster analysis of CD34+ cells according to their miRNA expression profiles. Each column represents a sample and each row represents a single miRNA. The black and white scale encodes the logarithm of relative gene expression level (black indicates the lowest expression; white indicates the highest expression).
Out of the complete data set, 13 miRNAs were differentially expressed between UCB and BM CD34+ cells (more than 2-fold, P < 0.01) (Fig. 5). On the one hand, let-7b, miR-1, miR-34a, miR-195, miR-203, miR-214, miR-545, and miR-548d showed higher expression in BM CD34+ cells. On the other hand, the set of miRNAs (miR-517c, miR-518a, miR-519d, and miR-520h) forming cluster on chromosome 19q13 was expressed only in UCB CD34+ cells.
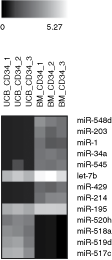
Differentially expressed miRNAs between umbilical cord blood and bone marrow CD34+ cells. The 2-fold threshold (P < 0.01) was set to identify the miRNAs to be considered as significant. The black and white scale encodes the logarithm of relative gene expression level (black indicates the lowest expression; white indicates high expression).
Validation of TLDA data using singleplex qRT-PCR
The TLDA data were re-evaluated using singleplex qRT-PCR method in the larger group of 10 UCB samples. We focused on miRNAs that may have relevant function in UCB cells: miR-10a, miR-92, miR-145, miR-146b, miR-148a, miR-362, and miR-451. High correlation (R = 0.995) between the methods was observed for all tested miRNAs; only miR-451 showed ∼10-fold higher expression levels when measured by singleplex qRT-PCR, probably due to primer competition in the multiplex reactions of array experiment (data not shown).
Differential expression of selected miRNAs in UCB and PB cells
Relative expression level of seven miRNAs (miR-10a, miR-92, miR-145, miR-146b, miR-148a, miR-362, and miR-451) was further measured in PB cell lineages to examine whether they have similar expression pattern to those of UCB cells. Majority of the tested miRNAs had similar transcript level (data not shown); however, we detected significant changes in expression of miR-10a, miR-146b, and miR-451. miR-10a had higher expression in PB T lymphocytes compared to UCB (8.3-fold, P = 0.007). miR-146b was reduced in PB T lymphocytes (4.6-fold, P = 0.0007) and granulocytes (2.3-fold, P = 0.012), whereas miR-451 was significantly increased in PB T lymphocytes (3.2-fold, P = 0.04) and granulocytes (10.1-fold, P = 0.008).
Expression of miRNA target genes
To correlate levels of differentially expressed miRNAs with relative expression of their putative or previously verified target genes, we performed whole-genome expression profiling using Illumina microarrays in the UCB and BM samples.
Using miRNA arrays, we demonstrated high expression of the group of miRNAs regulating HOX genes (miR-10a/b, miR-99a/b, miR-126, miR-130a, miR-181d, and miR-196b) [13 –18] in CD34+ cells compared to other UCB cell lineages. Thus, we examined expression data of 39 HOX genes presented on Illumina microarrays (see gene annotation file at http://www.switchtoi.com/annotationfiles.ilmn), but we did not detect significant decrease of any monitored HOX transcript in CD34+ cells.
On the other hand, expression of several miRNAs differentially expressed in UCB cells showed association with their previously verified target genes (Fig. 6A–C). For example, we detected association of miR-148a suppression in CD34+ cells with mRNA level of its direct target DNA methyltransferase 3B DNMT3B [19]. DNMT3B expression was ∼3.5-fold higher in CD34+ cells compared to other lineages (Fig. 6A). Further, expression of the oncogenic miRNA cluster miR-17-92 was high in CD34+ cells, whereas transcription of its verified target gene TGFBR2 [20,21] was suppressed in these cells (Fig. 6B). We tested whether low expression of tumor suppressors miR-143 and miR-145 in CD34+ cells and T lymphocytes had an impact on transcription of its direct target EKR5 MAP kinase [22]. Although we did not detect correlation of miR-143 and miR-145 with EKR5 transcript, we observed overexpression of ERK5 downstream target, c-MYC [23], in CD34+ and T cells (Fig. 6C).
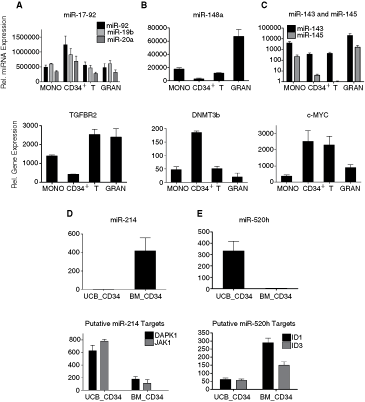
Expression of miRNAs and their previously verified or putative target genes. The upper panels show relative miRNA expressions detected by TLDA and the lower panels demonstrate relative levels of corresponding target transcripts detected by Illumina microarrays. miRNAs differentially expressed between umbilical cord blood (UCB) monocytes, CD34+ cells, T lymphocytes, and granulocytes: (
An approach combining bioinformatic prediction of miRNA targets with gene expression profiling was used to search for putative targets of miR-214 and miR-520h deregulated in UCB CD34+ cells (compared to BM). miRNA targets were predicted by miRBase Targets v.5, TargetScan 4.2 and PicTar software, and level of their mRNAs was monitored in UCB and BM CD34+cells using Illumina microarrays. The target genes, whose transcript level inversely correlated (P < 0.01) with miR-214 and miR-520h expression, are summarized in the Table 1. In the Figure 6D, association of miR-214 expression with transcript levels of JAK1 and DAPK1 is shown. miR-214 was detected only in CD34+ cells of BM origin whereas JAK1 and DAPK1 kinases had significantly higher levels in UCB progenitor cells. In contrast, miR-520h was expressed in UCB CD34+ cells and was undetectable in those of BM, suggesting possible modulation of ID1 and ID3 levels (Fig. 6E).
Genes expressed in bold are shown in Figure 6.
Putative targets of the miRNAs were predicted by miRBase Targets v.5, TargetScan 4.2, and PicTar. Gene expression of the targets was determined using Illumina microarrays.
aThe gene names are available at http://www.ncbi.nlm.nih.gov.
Discussion
miRNA expression in UCB cell lineages
In last few years, miRNA expression has been extensively studied in various PB or BM cell lineages to clarify how miRNAs regulate hematopoiesis and lineage commitment. Nevertheless, we expect that regulation of gene expression by miRNA molecules in immature neonatal blood cells may display specific features.
Using TLDA arrays, we determined miRNA expression profiles of several UCB cell lineages (CD34+ progenitor cells, T lymphocytes, monocytes, and granulocytes) and identified miRNAs predominantly expressed in the cells (miR-223, miR-142-3p, miR-16, miR-26a, and miR-92). The most abundant miRNA was miR-223, which is known to be myeloid-specific regulator involved in granulocytic differentiation [24]. In UCB, miR-223 showed similar expression pattern to PB, that is, high level in granulocytes and monocytes, intermediate in CD34+ cells, and very low in T cells. Also another highly expressed miRNAs in UCB (eg, miR-15, miR-16, miR-142-3p) are known as important regulators of hematopoiesis [2,25].
Statistical analysis of miRNA array data pointed out several differentially expressed miRNAs in particular cell lineages: for example, CD34+ progenitor cells: up-regulation of miR-10a/b, miR-99a/b, miR-126, miR-130a, miR-181d, miR-196b, miR-222 and down-regulation of miR-143-3p, miR-365; monocytes: up-regulation of miR-21, miR-362, miR-532, miR-660 and down-regulation of miR-146a/b; T lymphocytes: down-regulation of let-7b, miR-221; granulocytes: up-regulation of miR-143, miR-145, miR-148a, and miR-451. The largest set of differentially expressed miRNAs was identified in CD34+ cells. It likely reflects progenitor status of CD34+, which requires different spectrum of regulatory molecules in comparison to other differentiated lineages. In these cells, we found significantly up-regulated miR-10a/b, miR-99a/b, miR-126, miR-130a, miR-181d, and miR-196b that were previously confirmed as direct regulators of HOX gene expression [13 –18]. HOX genes are members of a homeobox gene family that play an important role in the regulation of early stages of hematopoiesis, including self-renewal of HSCs/early progenitors [26]. However, we did not detect any mRNA reduction of the tested HOX genes in CD34+ cells, suggesting regulation at the protein level that is an alternative mechanism of miRNA action.
In the set of differentially expressed miRNAs, we found two miRNA clusters whose expression was increased in particular UCB cell lineages (oncogenic cluster miR-17-92 in CD34+ cells and cluster of miRNAs encoded on chromosome X in monocytes). The coordinated regulation of clustered miRNAs indicates that these clusters may have specific function in hematopoietic cells. miR-17-92 cluster is known to promote cell proliferation, suppress apoptosis of cancer cells, and induce tumor angiogenesis [27]. In this study, miR-17-92 was highly expressed in CD34+ progenitor cells while its expression was repressed in differentiated cells. Analysis of miR-17-92 target genes expression revealed an association of the cluster with low level of tumor suppressor TGFBR2 [20]. Further, we showed that up-regulation of miR-17-92 in CD34+ cells might be caused by high expression of c-MYC oncogene, direct regulator of miR-17-92 cluster [28]. Upstream of this pathway, we observed reduced expression of tumor suppressors miR-143 and miR-145, indirect regulators of c-MYC (via ERK5 suppression) [23]. Taken together, we hypothesize that prolonged cell survival of HSCs may be associated with low expression of miR-143/145 and up-regulation of their downstream targets (high expression of c-MYC and miR-17-92 oncogenes resulting in repression of tumor suppressor TGFBR2).
It has been previously demonstrated that miR-148 represses DNA methyltransferase 3B (DNMT3B) gene expression via region in the coding sequence, indicating its action through the mRNA decay mechanism [19]. Here, we showed that miR-148a expression was suppressed in UCB CD34+ cells and its level was associated with enforced expression of DNMT3B, whereas DNMT3B transcript level remained low in the differentiated cells. DNMT3B has been identified as de novo methyltransferase, which methylates DNA during early development and gametogenesis [29,30]. It is known that up-regulation of DNMTs may contribute to the pathogenesis of leukemia by inducing aberrant regional hypermethylation [22]. Thus miR-148a suppression may induce de novo methylation of DNA in HSCs and the process may be diminished during differentiation probably along with the increase of miR-148a expression.
Comparison of UCB and BM miRNA expression
Recently, UCB has become a useful alternative source of CD34+ cells for clinical and research applications. Analyses of BM, UCB, and PB stem cells showed that the cells from various sources have distinct characteristics. For example, Ng et al. [31] demonstrated that diverse CD34+ cells vary mostly in expression profiles of genes associated with cell cycle (lower in UCB CD34+ cells), apoptosis (higher in UCB CD34+ cells), and key transcriptional factors (increased expression of GATA-2, FOS genes, LIM-related genes, and JUN-B in UCB CD34+ cells). Further, UCB contains the largest percentage of the most immature, pluripotent CD34+ CD38− HSCs and produces more progeny cells than its adult counterparts [31]. Based on these facts, we hypothesized that UCB stem cells might display differential expression of miRNAs, indicating different regulation of cellular process in this tissue. Herein, we confirmed that expression of 13 miRNAs was significantly altered between UCB and BM CD34+ cells. To specify miRNA regulatory network in these cells, we used the approach that combined (i) miRNA expression data obtained for UCB and BM CD34+ cells, (ii) mRNA expression data of the same cell samples, and (iii) in silico predicted miRNA targets.
We found increased expression of several apoptosis-related miRNAs (miR-1, miR-34a, and miR-214) in BM compared to UCB progenitor cells. miR-1 and miR-34a are proapoptotic factors [32,33] whereas miR-214 induces cell survival [34]. We chose miR-214 for further analyses because we hypothesized that it might play a role in previously demonstrated suppression of apoptotic activity in BM stem cells [31]. We defined the list of miR-214 putative target genes that showed the inverse correlation with the miRNA expression. Out of these, many transcriptional factors, apoptosis and cell survival-related genes were present (ARID1A, ASXL1, BANP, CNOT2, DAPK1, HMG20A, JAK1, LHX6, MAP4K2, PAN3, POU2F2, PURB, TRIM33), suggesting coordinated regulation of equilibrium between apoptosis and proliferation.
Interestingly, miR-517c, miR-518a, miR-519d, and miR-520h, whose expression was detected only in UCB CD34+ cells, form miRNA cluster on chromosome 19. It has been suggested that miR-520h might promote differentiation of HSCs into progenitor cells by inhibiting expression of ABCG2 gene, which is crucial for maintenance of stemness [35]. Inhibitors of DNA binding ID1 and ID3 were predicted by MiRBase software as other target genes of miR-520h. The fact that expression of ID1 and ID3 inversely correlated with miR-520h supports hypothesis that these genes represent direct targets of miR-520h. These molecules function as key regulators of cellular differentiation and proliferation and can negatively regulate the ability of terminal differentiation in immature hematopoietic cells [36]. Therefore, we hypothesize that higher expression of miR-520h in UCB CD34+ cells may (possibly due to ID1 and ID3 suppression) enhance previously demonstrated potential of UCB progenitor cells to generate mature blood cells [31].
We did not detect any difference in expression of miR-143/145 and miR-17-92 cluster and their target genes between UCB and BM CD34+ cells. Therefore, we may expect similar regulatory loop controlling cell survival in BM CD34+ cells, as was suggested in previous section. However, we did analyze only CD34+ cells in BM and we cannot compare the expression of these regulatory loop genes with other BM cell counterparts to support more this hypothesis.
Comparison of UCB and PB miRNA expression
The comparison of miRNA expression between UCB and PB cells revealed several miRNAs whose expression changed between neonatal and adult hematopoiesis; that is increase of miR-451 and reduction of miR-146b in PB granulocytes and T lymphocytes, and increase of miR-10a in PB T lymphocytes. Differential expression of miRNAs in neonates may be associated with the immature immunity. Neonatal and adult immune systems differ in many quantitative and qualitative aspects, for example, altered physiologic function of granulocytes with respect to chemotaxis, phagocytosis, oxidative metabolism, and bacterial killing [37] or increased percentage of naïve T lymphocytes with correspondingly naïve functional program [38]. Up-regulation of miR-146b in UCB granulocytes and T lymphocytes suggests possible participation of this miRNA in neonatal defense system because its expression is induced in response to a variety of microbial components and proinflammatory cytokines [39]. Moreover, Monticelli et al. showed that miR-146 is up-regulated in Th1, but not in Th2 cells and predicted that it probably plays a role in establishing and/or maintaining cell identity of T lymphocytes [40].
To our knowledge, this is the first study describing detailed expression profiles of miRNAs in UCB cells versus BM and PB cell counterparts. We show that UCB cells display differential expression of miRNAs, demonstrating specific regulation of these molecules in the cells. Using microarrays, we determined potential targets of differently expressed miRNAs in UCB and suggested possible interplay between these genes and miRNAs. Our data underscore complexity of miRNA regulatory network and indicate that accurate regulation of miRNAs modulates HSC status. However, functional studies are needed to verify roles of these molecules in neonatal hematopoiesis.
Footnotes
Acknowledgments
The authors wish to thank Dr. Petr Kobylka, CSc. (IHBT), for providing UCB samples and Anna Baumgartnerova (IHBT) for her technical assistance with cell separations. We thank Mgr. Iva Sakmaryova (Institute of Rheumatology, Prague) who kindly provided 7900HT Fast Real-Time PCR System for our analyses.
The study was supported by NR/9236-3 IGA of the Ministry of Health of the Czech Republic.