
Abstract
Primitive marrow lineage-negative rhodamine low and Hoechst low (LRH) stem cells isolated on the basis of quiescence respond to the cytokines thrombopoietin, FLT3L, and steel factor by synchronously progressing through cell cycle. We have now profiled the mRNA expression, as determined by real-time RT-PCR, of 47 hematopoietic or cell cycle-related genes, focusing on the variations in the cell cycle regulators with cycle transit. LRH stem cells, at isolation, showed expression of all interrogated genes, but at relatively low levels. In our studies, there was a good deal of consistency with regard to cell cycle regulatory genes involved in the G1/S progression point of LRH murine stem cells. The observed pattern of expression of cyclin A2 is consistent with actions at these phases of cell cycle. Minimal elevations were seen at 16 h with higher elevations at 24, 32, 40, and 48 h times encompassing S, G2, and M phases. CDK2 expression pattern was also consistent with a role in G1/S transition with a modest elevation at 24 h and more substantial elevation at 32 h. The observed pattern of expression of cyclin F mRNA with marked elevations at 16–40 h was also consistent with actions in S and G2 phases. Cyclin D1 expression pattern was less consistent with its known role in G1 progression. The alterations in multiple other cell cycle regulators were consistent with previous information obtained in other cell systems. The cycle regulatory mechanics appears to be preserved across broad ranges of cell types.
Introduction
H
We have now characterized LRH cells progressing through cell cycle under cytokine stimulation as to expression of intrinsic cell cycle regulatory genes. This provides the first cell cycle regulatory gene profile of a population of primitive stem cell synchronously progressing through cell cycle.
Materials and Methods
Animals
Six- to eight-week-old congenic male B6.SJL-PtprcaPep3b/Boy.J (B6.SJL) were purchased from Jackson Lab (Bar Harbor, ME). All animals were housed in micro-insulator cages, in a conventional clean facility for at least 1 week prior to experimental use. The animals in this Animal Care Committee approved study were maintained in accordance with the guidelines of the Institutional Animal Care and Use Committee of Rhode Island Hospital and recommendations in the Guide for the care and use of laboratory animals. All animals were 6–8 weeks of age at the time of bone marrow harvest.
Isolation of whole bone marrow
Six- to 8-week-old male mice were sacrificed. Bone marrow was collected from femurs, tibiae, iliac crests, and spines by grinding bones in phosphate-buffered saline (PBS) supplemented with 5% heat-inactivated fetal calf serum (HIFCS; Hyclone, Logan, VT) and 1% penicillin/streptomycin (P/S; Life/Technologies/Gibco/BRL) using a mortar and pestle. The bone fragments were washed multiple times and the supernatant cell suspension and wash fractions filtered through a 40-μm nylon filter (Becton Dickinson, Franklin Lakes, NJ) to remove large bone particles. High lipid concentrations were reduced by centrifugation and resuspension of the cells in fresh buffer. The cells were incubated at 4°C for 5 min, so that small bone particles could settle out. The cell supernatant, depleted of these fragments, was then diluted to 107 cells/mL PBS with 5% HI FCS and 1% penicillin/streptomycin (PBS buffer).
LRH hematopoietic stem cell (HSC) purification
A low-density fraction (1.320 ± 0.001 g/mL) of the whole bone marrow was isolated on Optiprep (Accurate Chemical and Scientific Corporation, Westbury, NY). The cells were lineage-depleted with the following primary rat antibodies: anti-B220, anti-MAC-1, anti-GR1, anti-Lyt-2, anti-L3T4, and Ter119 (BD PharMingen, San Diego, CA). Each batch of antibody was evaluated by flow cytometry analysis for the concentration, which resulted in the greatest shift in mean channel fluorescence and/or the greatest percentage of positive cells detected. The optimal dilution for each antibody was at a final concentration of 0.1 μg/106 cells (0.5 μg/106 cells for GR-1). After a 15-min incubation on ice, the labeled cells were washed in 1× Dulbecco's phosphate-buffered saline, without calcium or magnesium chloride (PBS; Invitrogen Corp., Carlsbad, CA), 5% heat-inactivated fetal calf serum (HI FCS; Hyclone, Logan, UT), and resuspended in PBS buffer. The cells were incubated with washed sheep anti-rat IgG-conjugated immunomagnetic polystyrene spheres (M-450 Dynabeads; Dynal, Lake Success, NY) at 4°C for 20 min by adding beads in a drop-like fashion to obtain a 1:5 bead to cell ratio. The beads were suspended in PBS buffer and, when added to the cells, resulted in 1.5 times the original cell volume. After the 20-min incubation, immunomagnetic bead-rosetted cells were removed using a magnetic particle concentrator (Dynal, MPC-6), and the unrosetted cells remaining in suspension were harvested by pipette. The lineage-depleted cells were labeled with rhodamine 123 at a concentration of 0.1 mg/mL and Hoechst 33342 at 10 mM. Cells were incubated in the dark for 30 min at 37°C, washed, and followed by an additional incubation for 20 min at 37°C, allowing time for efflux of rhodamine. The last incubation was carried out twice before sorting. A population with both low expression of Hoechst and rhodamine fluorescence was isolated by FACS using a BD Cytopia InFlux high-speed cell sorter (BD Biosciences San Jose, CA).
LRH cultures
LRH marrow cells were established in Teflon (non-adherent) bottle cultures with DMEM + 15% HI FCS+ 1% P/S + 1%
Cell cycle evaluation with propidium iodide staining
LRH populations were analyzed for cell cycle status at different time points in culture. Cellular DNA was labeled with propidium iodide (Stain DNA Assay PI [RPI-2], Nova Century Scientific), and percentage of cells stained was analyzed on a MoFlo cell sorter (Cytomation, Fort Collins, CO) to assess the cycling status of the cells at different times in culture.
Gene analysis
Fold difference in gene expression was analyzed and expressed relative to the 0-h control. RNA was isolated from LRH cells at various points in cell cycle using the manufacturer's protocol (PicoPure™ RNA Isolation Kit, Arcturus Mt. View, CA). Reverse transcription was performed with the high-capacity cDNA reverse transcription kit (Applied Biosystems [ABI], Foster City, CA) using manufacturer's protocol for a 50-μL total reaction. Real-time PCR was performed using pre-developed Taqman Assays (ABI), targeted to mRNA in a 20-μL reaction mixture containing 2× Taqman Universal PCR Master Mix (ABI) and equal amounts of cDNA with nuclease-free water. Murine β2-microglobulin was used as an endogenous control. Samples were run, using the standard default thermal profile (7900HT Sequence Detection System, ABI). TaqMan® custom array was used for larger samplings of the genes. Relative gene expression was calculated with the comparative CT method. In this method, the relative quantitation of the target gene is normalized to an endogenous control (β2-microglobulin) and is expressed relative to a calibrator sample (0-h control) as 2−ΔΔCt or fold difference, where ΔCt = Ct of target gene –Ct of endogenous control gene and ΔΔCt = ΔCttarget gene – ΔCtcalibrator. Information on specific TaqMan® assays is detailed in Table 1.
Statistics
Data was evaluated using an unpaired Student's t-test.
Results
We first established the stability of our gene expression system. Figure 1 shows expression of our control housekeeper gene, β2-microglobulin, as indicated by cycle threshold (CT) values in multiple experiments at time 0 and after various times of cytokine culture. The relative reproducibility is shown by the very tight standard errors. Test values were all normalized to β2-microglobulin expression values.
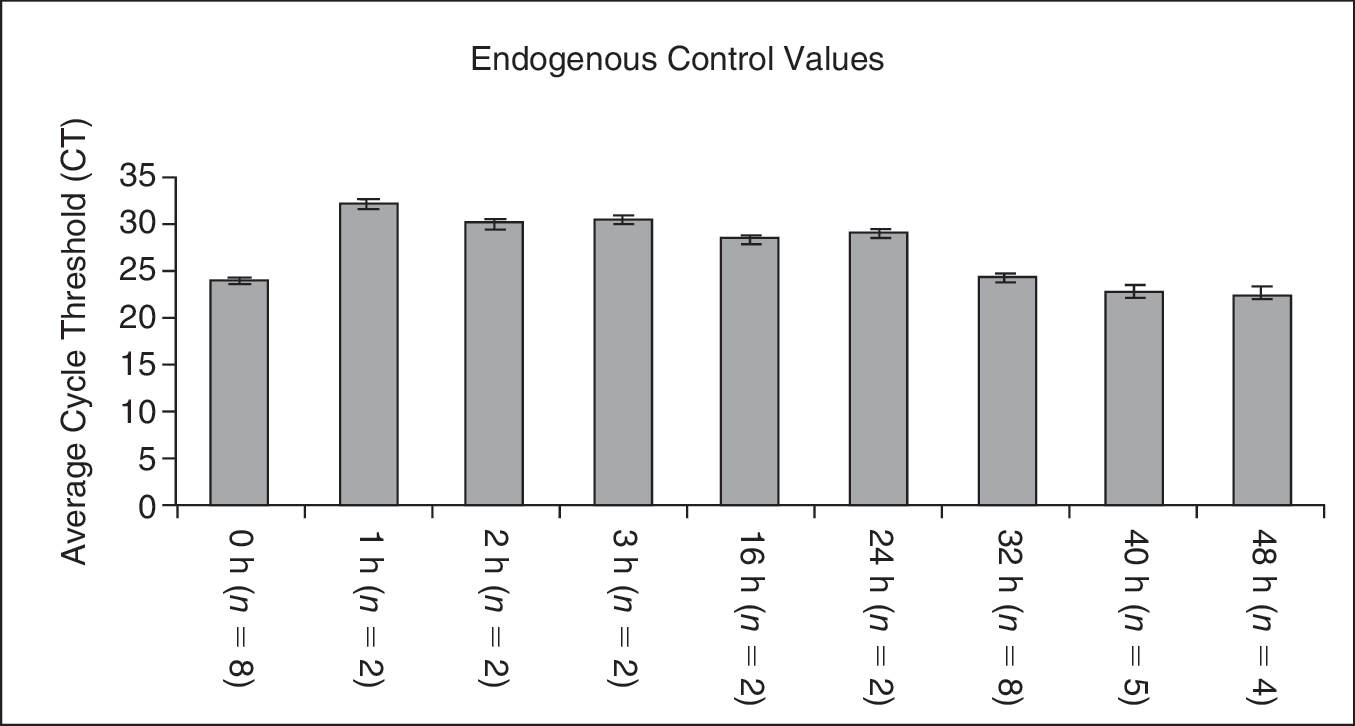
Endogenous control through cell cycle. Average cycle threshold (CT) values for β2-microglobulin are displayed as the rhodamine low and Hoechst low (LRH) stem cells are samples at various points in cell cycle transit. Error bars represent the standard error between experiments where the number of experiments (n) is indicated for each time point.
In order to present fold differences that varied over a wide range especially when the comparator was very low, we have created a value range to encompass the varied fold differences and for ease of presentation. This is presented in Table 2.
We have previously mapped the cell cycle status of LRH cells stimulated with thrombopoietin, FLT3L, and steel factor using propidium iodide [15]. At time 0, there are either very few or no LRH stem cells in S phase, and hence there is a highly synchronous progression through cycle. S phase progression probably occurs at around 15–16 h and, by 40 h, essentially all the LRH cells are in S phase.
In Figure 2, we present the absolute ΔCT values for the cell cycle genes to give an indication of baseline gene expression. In general, at time 0 in freshly purified LRH stem cells, expression of the cycle regulatory genes was low but quite varied. It is from this base that we are assessing the relative changes of gene expression over time.
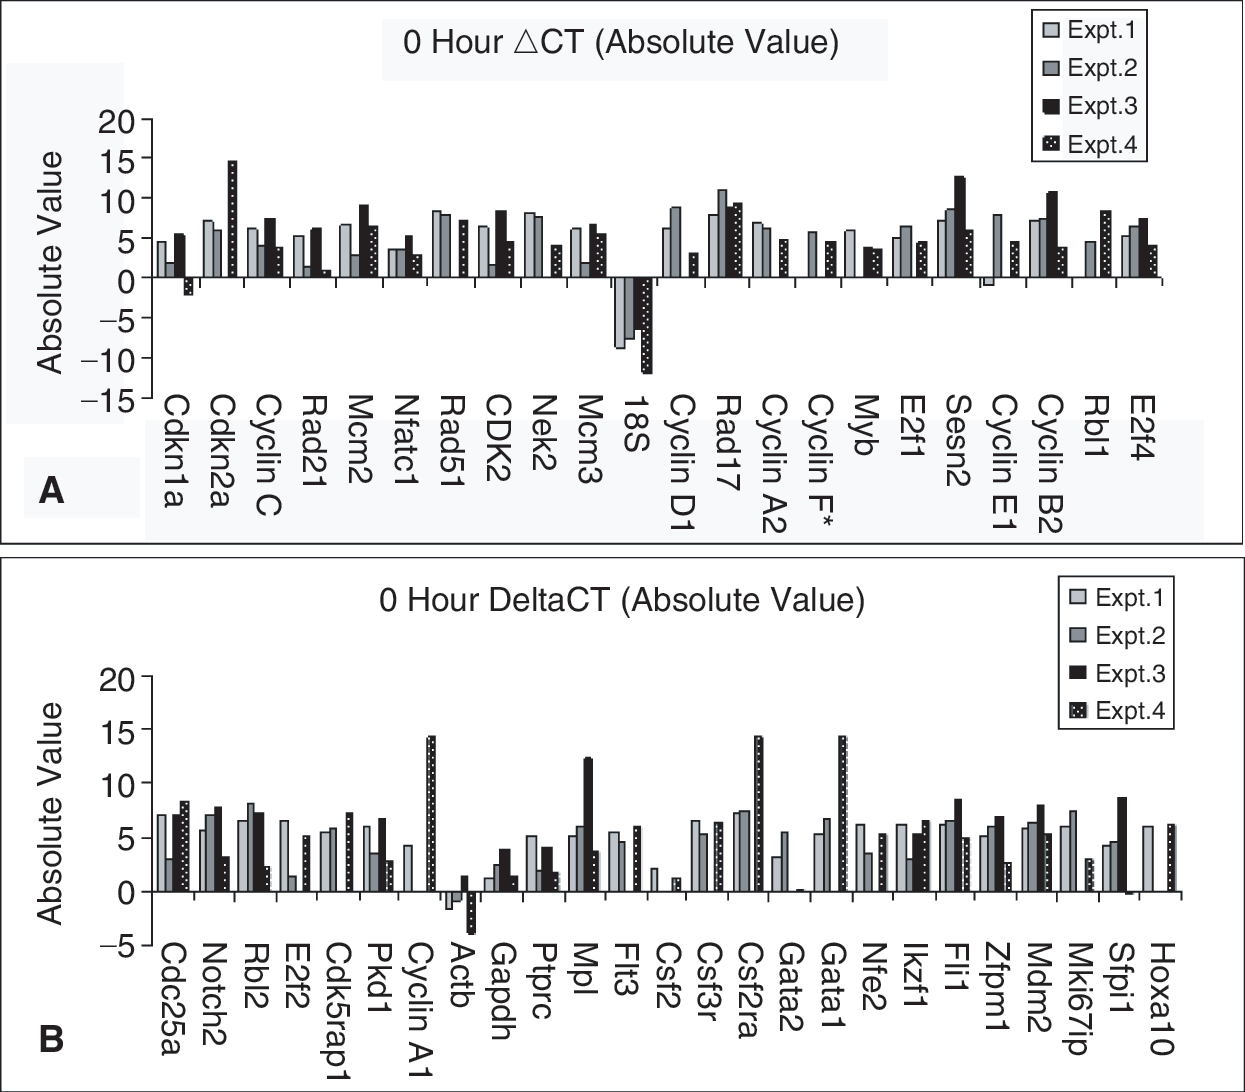
Absolute gene expression at isolation. Individual ΔCT values, which have been corrected with the endogenous control cycle threshold (CT) value, are expressed at isolation (0 h in culture).
Cyclin gene expression in LRH stem cells at different times in culture equating with different cell cycle points are shown in Figure 3. The striking elevations at cyclins A2 and F, at times of G1/S cycle transit and through the G2/M phases, are apparent. These changes were highly significant (P values in legend).

Mapping cyclin gene expression. Fold differences relative to 0-h control in rhodamine low and Hoechst low (LRH) stem cells cultured in TPO, FLT3, and steel factor. Number of experiments (n) is 2 for all values except 32-h samples (n = 6): cyclin D1; cyclin A1; cyclin A2; 40-h samples (n = 4); 48-h samples (n = 3). Statistical significance by Student's t-test: *P ≤ 0.05; † P < 0.01; ‡ P ≤ 0.005.
Expression of further cell cycle regulatory genes is presented in Figure 4. Here, correlations with function are complex and sometimes not clear. However, many of the expression patterns continued to be consistent with the presumed place of these entities in cell cycle regulation.
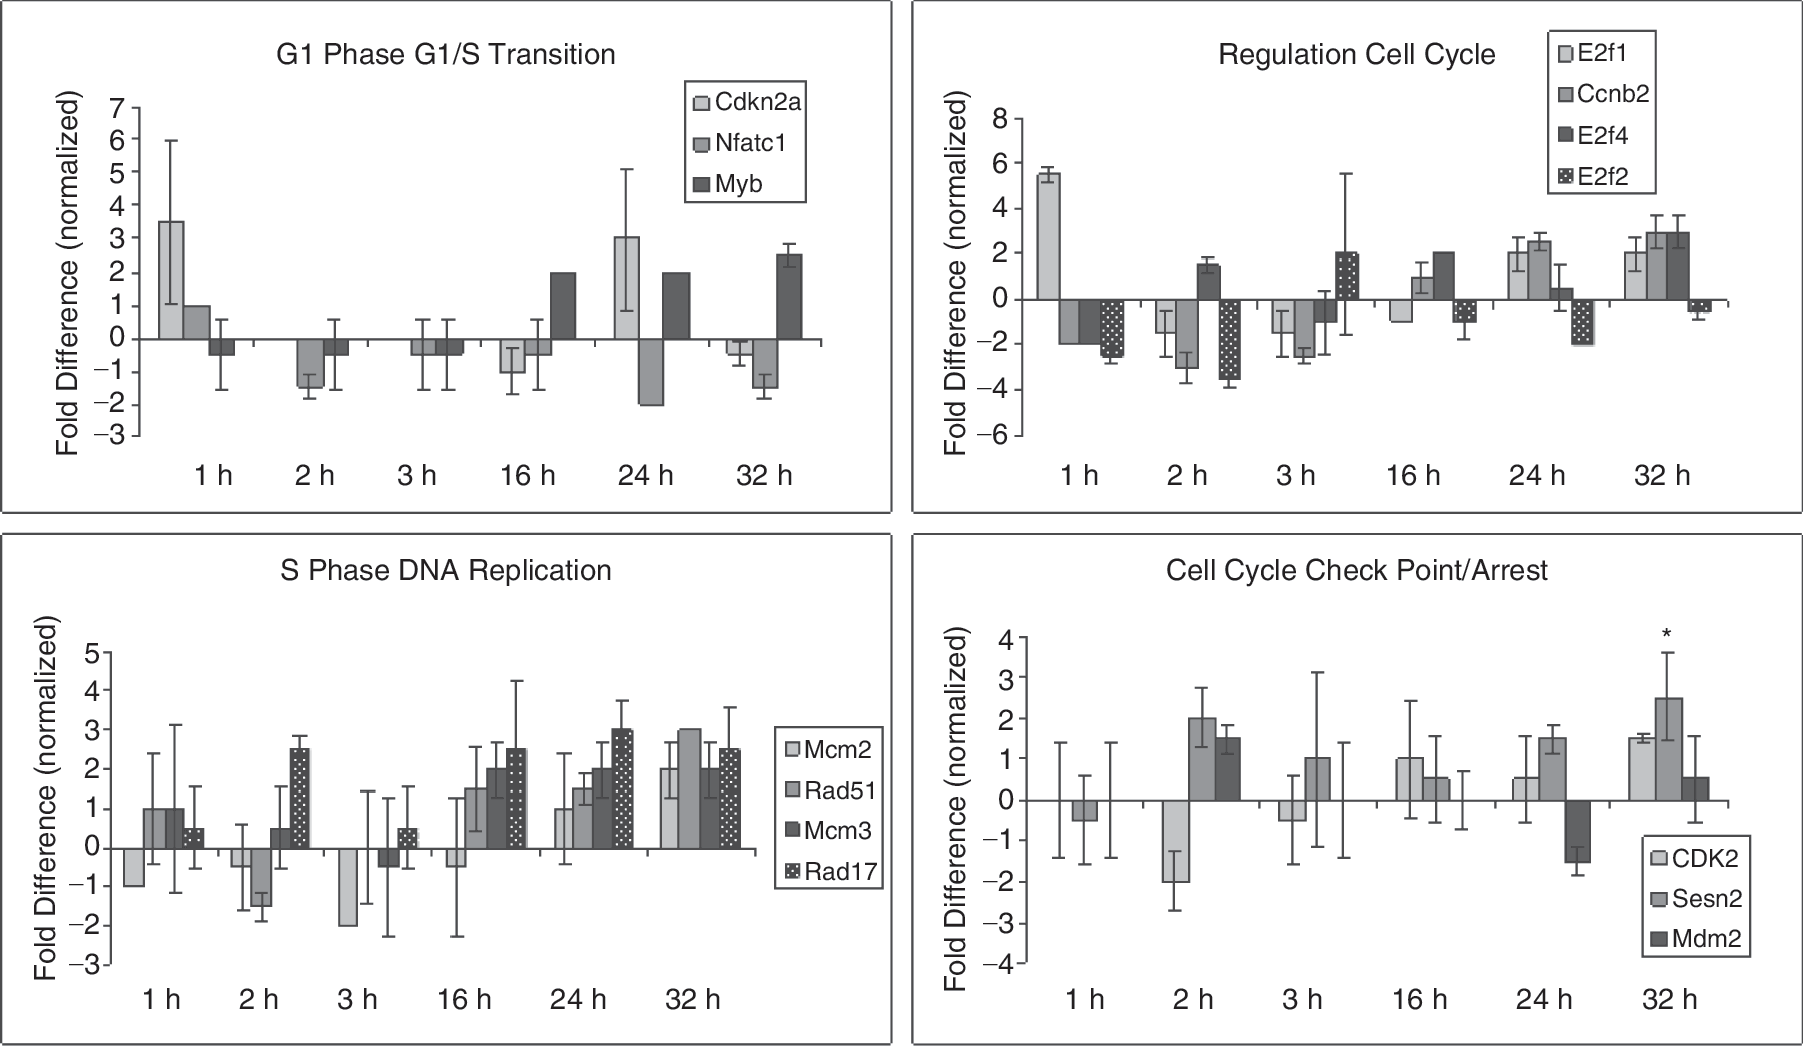
Normalized gene expression of rhodamine low and Hoechst low (LRH) stem cells through cycle. Cells cultured in TPO, FLT3, SCF, and analyzed at 0 through 32 h. Gene expression is represented as fold differences relative to the 0-h control. Variations in gene expression are shown with cycle transit. Statistical significance by Student's t-test: *P ≤ 0.05.
Discussion
Cyclins and cyclin-dependent kinases play complex roles in the progression of cell cycle [19], and their role may vary with different cell types or species under investigation. Much of this complexity is well-summarized in work by Sanchez and Dynlacht [20].
In our studies, there was a good deal of consistency with regard to cell cycle regulatory genes involved in the G1/S progression point of LRH murine stem cells. Most striking was the highly reproducible and quite striking elevations of cyclins A2 and F with progression from G1 through S phase. Cyclin A2 binds and activates CDC2 and CDK2 promoting transitions at G1/S and G2/M phases [21 –23]. The observed pattern of expression in 6 separate experiments is consistent with actions at these phases of cell cycle. No elevations were seen at 1, 2, and 3 h; minimal elevations were seen at 16 h with higher elevations at 24, 32, 40, and 48 h times encompassing S, G2, and M phases. CDK2 expression pattern was also consistent with a role in G1/S transition with a modest elevation at 24 h and more substantial elevation at 32 h. CDK2 interacts with a broad range of cyclins and also plays a role in chromosome stability [20]. Cyclin F belongs to the F box family of proteins that make up one of the 4 subunits of the ubiquitin ligase complex [24, 25]. This latter is involved in phosphorylation-dependent ubiquitination. In general, this is felt to be involved in control of cell cycle in S and G2 phases. This is also consistent with the observed pattern of expression of cyclin F mRNA with no elevations at 1, 2, and 3 h and marked elevations at 16–40 h but not at 48 h when the cells have entered their next cycle transit. These findings are consistent with findings in multiple other cell systems.
Cyclin D1 also showed increased expression in S phase, albeit not as pronounced as was seen with cyclins A2 and F. It did not show increased expression at 16 h, suggesting a lack of involvement in the G1/S transition. D1 also showed an increase at one point in G1 (2 h). Cyclin D1 expression pattern was less consistent with its known role in G1 progression [20, 26]. Cyclin D has a role in repair of double-strand DNA breaks and mitosis. It did show moderately increased expression in S phase and through mitoses.
Cyclin C showed modest elevations in mid- to late S phase and through M phase consistent with its known role in mitotic growth [27, 28].
Cyclin B2 showed modest elevations in S phase of the marrow stem cells [20,29, 30]. Its probable role in G2/M transition was not really interrogated in these experiments.
Cyclin A1 showed marginal changes around baseline and, although this may be involved in control of cell cycle at the G1/S and G2/M transitions, the present data in murine marrow stem cells are more consistent with its role in control of germ-line meiotic cell cycle [31].
Given the complexity of the cell cycle regulatory network, any division into specific classes is of necessity relatively arbitrary. We have grouped the cyclin gene expression, and presented this in Figure 4. Cdkn2a, Myb, and Nfatc1 were grouped in G1 phase and G1/S transition. Nfatc probably has a major role with T cells [32], and it was at baseline or depressed in the hematopoietic stem cells with cycle transit. Myb expression was modestly increased in S phase consistent with its known role in hematopoietic stem cell proliferation [33]. Cdkn2a or p16INK4a expression was variably up at 1 and 24 h, but not increased at other time points. This interacts with cyclin-dependent kinases 4 and 6 and inhibits their ability to interact with cyclin D. It induces cell cycle arrest at G1 and G2/M checkpoints [34 –36]. Its expression pattern fits with the generally successful cycle transit of LRH stem cells in these studies.
The next panel outlines cycle regulators involved in S phase relocation. Mcm2 is required for entry into S phase and cell replication. It is present and increased at 32 h into S phase. It is of interest that Rad51, Rad17, and Mcm3 are all involved with DNA damage/repair and are all elevated at multiple points in S phase at 16, 24, and 32 h. Whether this indicates that a percentage of the stem cells transiting cycle experience DNA damage and are possibly arrested for repair remains an open question [37].
In a related vein, putative checkpoint/arrest regulators including Cdk2, Mdm2, and Sesn2 showed variable and relatively minor changes through cycle except possibly for SESn2 at 32 h [38].
Finally, E2f1, E2f2, and E2f4 are lumped under regulation of cell cycle. There were relatively small elevations of E2f1 and E2f4 in S phase but, at most time points, its expression was below or at baseline, and it is not clear how these expressions fit into the cell cycle picture of hematopoietic stem cells.
Evaluation of the absolute cycle values at time 0 indicated relatively low but quite variable expression of the cell cycle regulators in LRH stem cells.
Altogether, these data give us a profile of cell cycle regulator mRNA expression with progress of primitive marrow hematopoietic stem cells through a cytokine-induced cell cycle transit. In general, based upon the described actions of these regulators, levels seen in the stem cells at different points in cycle were consistent with information obtained in multiple other cell systems. Particularly striking and highly reproducible were the marked elevations of expression of cyclins A2 and F coincident with transition from G1 to S phase. The cycle regulatory mechanics appear to be preserved across broad ranges of cell types.
Conclusion
Expression of cycle regulator genes at LRH stem isolation was very low and patterns of induction in general confirmed data from other cell systems. The G1/S transition was characterized by reproducible induction of cyclins A2 and F gene expression. These data provide a cycle regulator gene expression profile at different points in cycle transit of LRH stem cells.
Footnotes
Acknowledgments
We wish to acknowledge Ms. Sandy Bibby, Coordinating Editor for the Division of Hematology/Oncology Scholarly Publications, Rhode Island Hospital, Providence, RI, for her role in editing this manuscript. This work was supported by 1 P20 RR025179-01, 7R01 HL073749-05.